

Hotcoin Research|Has this bull market ended? In-depth analysis of the "changes" and "constants" in Bitcoin's four-year cycle
TechFlow Selected TechFlow Selected
Hotcoin Research|Has this bull market ended? In-depth analysis of the "changes" and "constants" in Bitcoin's four-year cycle
This article will analyze the market performance of the current Bitcoin halving cycle, exploring changes in its cyclical patterns and their underlying causes.

1. Introduction: The “Change and Continuity” of Cyclical Patterns
Bitcoin halves its supply increment roughly every four years—a mechanism that has shaped the cyclical ups and downs of the crypto market. However, since the fourth halving in April 2024, Bitcoin’s price and the broader crypto market have exhibited new characteristics unlike previous cycles. Historically, halvings often signal the end of a bear market, followed by a bull run peaking about one year later. Yet the 2024–2025 cycle has left many investors puzzled—while Bitcoin did reach new all-time highs, the market lacked the widespread public frenzy seen in past cycles. Instead, the rally appeared slow and mild, with reduced volatility, leading many to question whether the four-year cycle theory has failed.
What are the distinguishing features of this cycle? Which aspects of the four-year cycle theory still hold? What factors have altered the rhythm of this cycle? Amid shifting macroeconomic conditions, institutional capital inflows, and subdued retail sentiment, where is Bitcoin headed next? This article analyzes the market performance of the current Bitcoin halving cycle, explores changes in cyclical patterns and their causes, and forecasts price trends toward the end of 2025 and into 2026, aiming to provide investors with comprehensive and insightful analysis.
2. Performance and Characteristics of This Bitcoin Halving Cycle
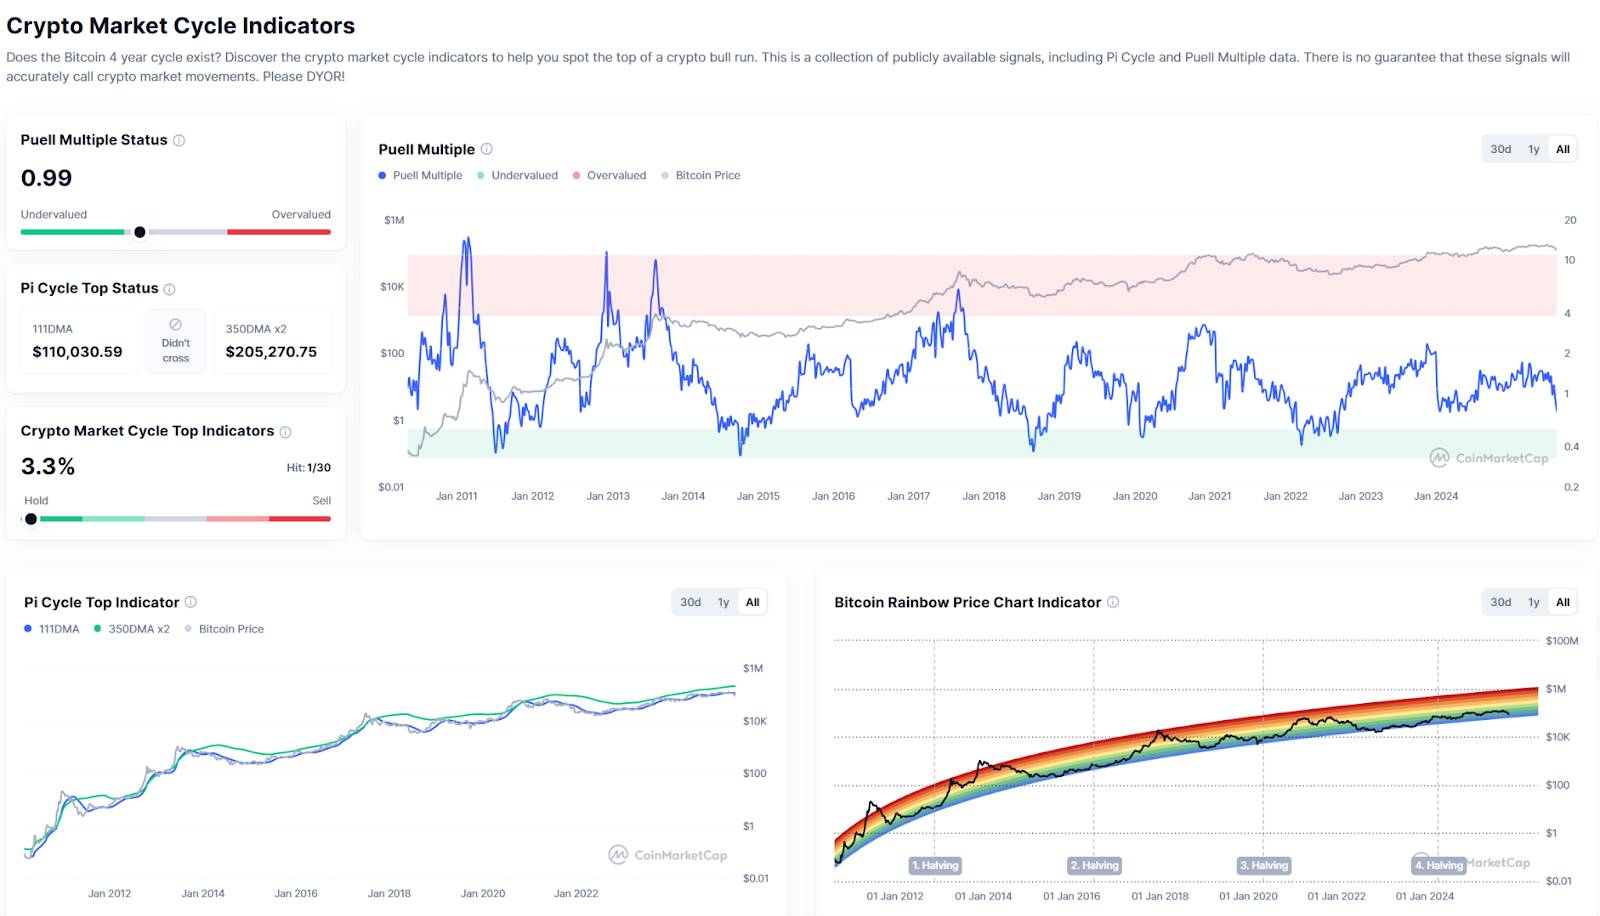
Source: https://coinmarketcap.com/charts/crypto-market-cycle-indicators/
On April 19, 2024, Bitcoin completed its fourth block reward halving, reducing the block reward from 6.25 BTC to 3.125 BTC. According to historical patterns, halvings typically occur at the tail end of bear markets, followed by a bull market within 12–18 months. However, the 2024–2025 cycle shows both familiar repetition and notable differences.
-
Price Trend Overview: New highs emerge, but the rally is sluggish. On the day of the halving, Bitcoin closed around $64,000. In the following months, prices fluctuated but continued an overall upward trajectory: in mid-November 2024, Bitcoin broke above $90,000; propelled by favorable developments including the resolution of the U.S. presidential election, it crossed the $100,000 milestone on December 5, 2024, setting a new record. In 2025, prices continued rising, reaching a peak of approximately $126,270 on October 6, 2025—about 18 months after the halving, superficially aligning with past cycles. However, this rally was relatively slow and mild, lacking the exponential surge typical of late-stage bull markets. From the 2022 bear market low (~$15,000) to the peak, Bitcoin rose about 7–8 times; from the halving price (~$64,000), the gain was less than two-fold. In contrast, Bitcoin surged nearly 20-fold from the 2017 bear bottom and about 3.5-fold in the 2021 bull run. Clearly, this cycle's price rise was significantly more gradual and restrained, exhibiting a "slow bull" pattern.
-
Market Sentiment and Volatility: Absence of Frenzy, Declining Volatility. Despite repeated new highs, the market did not witness the mass enthusiasm seen in prior cycles. At the peaks of the 2017 and 2021 bull runs, cryptocurrencies became mainstream topics, with altcoins flourishing. This time, even as Bitcoin surpassed $100K, public sentiment remained relatively calm, failing to spark a 2017-style speculative rush or a 2021-level NFT or Dogecoin mania. On-chain data shows capital concentrated mainly in large-cap assets like Bitcoin, whose market share briefly approached 60%. Many highly speculative altcoins showed weak rebounds. Market volatility also dropped significantly—the annualized volatility declined from over 140% earlier; though short-term swings intensified during the 2025 second-half correction, the market avoided the extreme roller-coaster swings of past cycles, making the entire rally appear restrained and gradual.
-
Gradual Multi-Phase Rise, Lacking a "Final Surge." Notably, the 2024–2025 bull market peak wasn’t reached through a single bubble burst, but in stages. From late 2024 to early 2025, Bitcoin repeatedly tested and consolidated around $100K before advancing: in January, MicroStrategy’s announcement of massive Bitcoin purchases pushed prices to $107K; after an August peak, weaker-than-expected U.S. inflation (PPI) data caused Bitcoin to quickly drop from $124K to below $118K. It wasn’t until early October that a final push brought prices to $126K—but even then, there was no "final blowoff top" as seen in prior cycles. Immediately after the peak, sustained selling pressure emerged, causing a nearly 30% drop over six weeks, hitting a seven-month low of ~$89,000 in mid-November. Thus, while prices kept making new highs, the rally lacked explosive acceleration, appearing calm throughout—yet the downturn arrived swiftly and sharply.
-
Partial Alignment with Four-Year Timing: Low-to-High Time Window. Despite many unusual aspects, when viewed purely through timing and trajectory, this cycle still loosely fits the classic "four-year cycle" framework. Bitcoin bottomed around $16,000 at the end of 2022, roughly one year after the previous peak ($69,000 in November 2021); the April 2024 halving marked the likely end of the bear market; and the peak in October 2025—about 18 months post-halving—aligns with the historical timing between halvings and bull market tops in 2013, 2017, and 2021. Thus, within the broad "halving → bull → peak → bear" structure, the cycle remains largely intact. As analysis notes: "From the April 2024 halving to the $125K high in October 2025, it took nearly 18 months. If we only look at this path, it still follows the cyclical pattern: halving marks the bottom, peak arrives about a year later, followed by a correction phase."
In summary, this post-halving market did achieve new highs and generally fit the expected time window, but the nature of the rally and investor experience clearly differed from past cycles. Consequently, increasing numbers of investors are questioning whether Bitcoin’s traditional four-year cycle has become obsolete. So which parts of the traditional theory still hold, and which are changing?
3. Is the Four-Year Cycle Theory Still Valid?
Despite apparent anomalies, deeper analysis reveals that the core logic of Bitcoin’s "four-year cycle" has not vanished entirely. Supply-demand shifts from halvings continue to support long-term price appreciation, and the psychological cycle of investor greed and fear persists—though this time in a milder form.
-
Long-Term Effects of Supply Contraction Remain. Bitcoin’s four-year halving reduces new supply, forming the fundamental basis for past bull markets. Even though total Bitcoin supply is now close to 94% of its cap and each halving reduces marginal supply less than before, the market’s perception of "scarcity" remains. In past cycles, the belief in long-term price growth post-halving led many investors to HODL rather than sell. The same occurred this time: the April 2024 halving cut daily new issuance from 900 BTC to 450 BTC, and despite price fluctuations, most long-term holders maintained their positions without mass selling due to limited gains. This indicates that supply contraction continues to tighten the market, though its price-boosting power has weakened compared to earlier cycles.
-
On-Chain Indicators Still Follow the Rhythm. Investor behavior still follows the typical "accumulation → profit-taking" cycle, with many on-chain metrics showing periodic patterns. For example, MVRV (Market Value to Realized Value) often falls below 1 at bear market bottoms and rises into overheated zones during bull markets. In the 2024 bull run, MVRV peaked around 2.8 and fell back below 2 during early 2025 corrections. SOPR = 1 is considered a bull-bear threshold: below 1 means most sellers are at a loss; above 1 indicates most transactions are profitable. During the 2024–2025 bull phase, SOPR stayed mostly above 1, consistent with past bull markets. Similarly, the RHODL ratio, measuring funds from short-term vs. long-term holders, reached a cycle high in 2025, signaling late-stage market structure and potential topping. Overall, key on-chain indicators like MVRV, SOPR, and RHODL continue to follow established cycles—though absolute levels vary, the emotional cycle of greed and fear still leaves clear traces on-chain.
-
Historical Data: Diminishing Returns, But Trend Intact. From a macro perspective, declining peak returns per cycle are inevitable as market size grows—not evidence of cycle disappearance. Historical peak returns have indeed decreased: ~20x from 2013’s peak, ~20x from 2017’s end to 2021’s peak (~3.5x increase), and only ~80% (0.8x) from 2021’s $69,000 to 2025’s $125,000. This diminishing return is normal: as market scale increases, marginal impact from new capital weakens. Thus, lower gains aren’t proof of cycle failure, but a natural outcome of market maturation.
Summary: The underlying drivers of the traditional four-year cycle—supply contraction and investor behavior patterns—still function. Halvings still trigger supply-demand inflection points, and markets still follow the "fear → greed" rhythm. However, new factors are distorting the cycle’s surface expression, making its external timing harder to predict.
4. The Truth Behind Cycle Imbalance: Rising Variables and Fragmented Narratives
If the internal logic of the halving cycle still holds, why is this cycle so hard to interpret? The root cause lies in the disruption of what was once a single dominant force (halving-driven momentum) by multiple new influences. These interacting forces have created a complex new landscape.

Source: https://coinmarketcap.com/charts/bitcoin-dominance/
1. Structural Impact of ETFs and Institutional Capital. Starting in 2024, spot Bitcoin ETFs were approved and listed in the U.S., introducing a steady flow of institutional capital and altering the market’s previous reliance on retail and leveraged traders. By October 2025, U.S.-listed Bitcoin ETFs held a total of $176 billion in assets. This institutional influx not only lifted prices but also increased market stability: ETF investors’ average entry cost sits around $89,000, which has become a strong support level. However, when sentiment turns, large-scale ETF outflows can create unprecedented liquidity shocks. Since late October 2025, amid macro headwinds, institutions pulled back significantly: from October 10, U.S. spot Bitcoin ETFs saw net outflows of ~$3.7 billion, with $2.3 billion occurring in November alone. Thus, the ETF-era market is "more stable yet more fragile": reduced volatility during slow rallies, but sharper sell-offs if key support (e.g., $89K average cost) breaks.
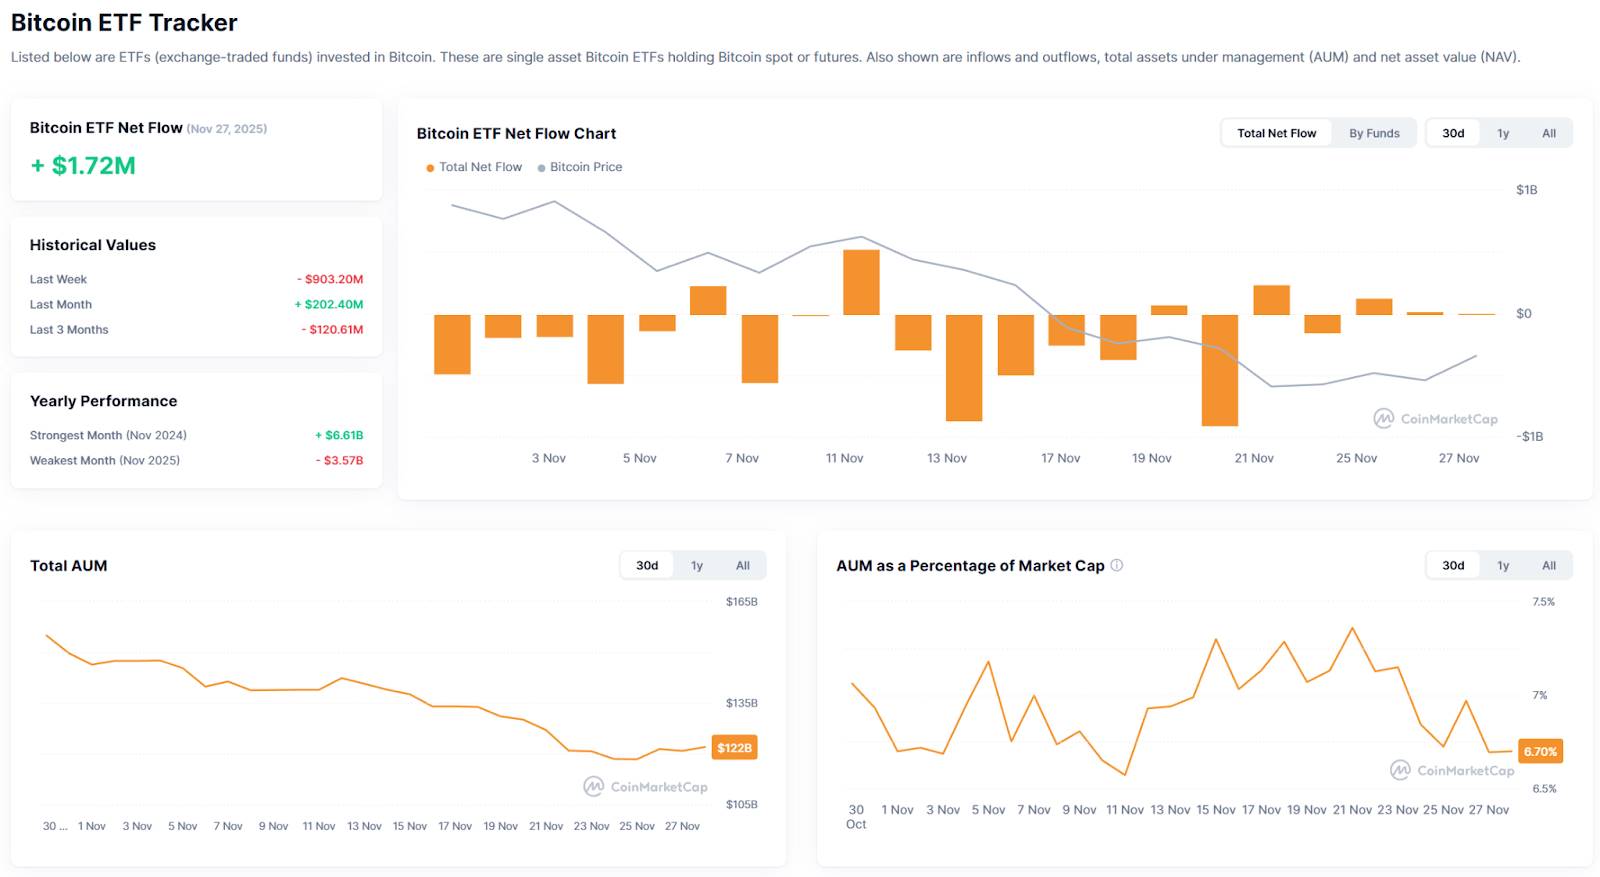
Source: https://coinmarketcap.com/etf/bitcoin/
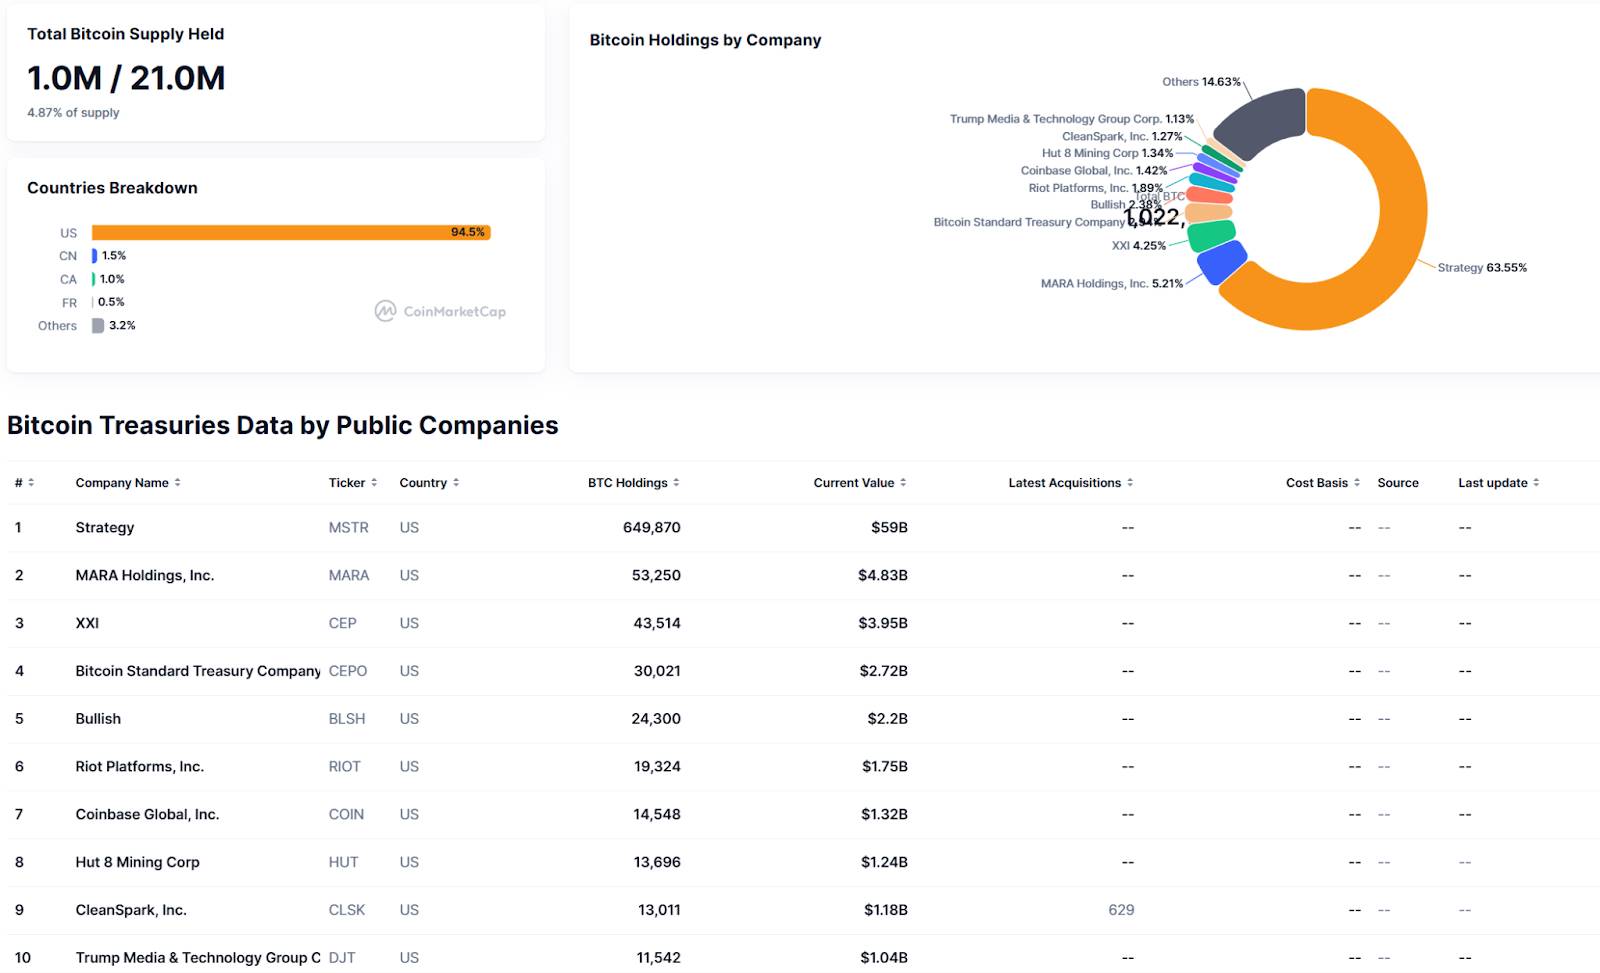
Source: https://coinmarketcap.com/charts/bitcoin-treasuries/
2. Narrative Fragmentation and Accelerating Theme Rotation. The 2020–2021 bull market had coherent narratives—DeFi and NFTs—that drove capital systematically from Bitcoin to higher-risk assets. This cycle, however, featured fragmented, short-lived themes. Rapid narrative rotation led to frequent capital switching, breaking the traditional "Bitcoin leads, altcoins follow" pattern. Reviewing 2023–2025, themes emerged rapidly but lacked sustained momentum:
-
Late 2023–Early 2024: Anticipation of Bitcoin ETF approval sparked momentum, followed by the Bitcoin Ordinals inscription trend;
-
Mid-2024: Solana ecosystem surged, and meme coins (e.g., Doge) briefly gained popularity;
-
Late 2024–Early 2025: AI-related speculation began (AI memes, AI agents becoming recurring topics);
-
2025: InfoFi, Binance memes, new layer-1 chains, x402 gained niche traction but with limited duration.
Frequent sector rotation meant capital chased short-term fads without settling, preventing a broad altcoin breakout. Many mid-cap coins peaked early and reversed, while Bitcoin maintained dominance despite modest gains. This "fragmented market" deprived the late bull phase of widespread euphoria. Thus, this cycle’s peak came from Bitcoin’s steady climb, not a sweeping crypto-wide boom, making it feel relatively "quiet."
3. Self-Fulfilling Cycles Prematurely Realized. As the "four-year halving cycle" became widely known, investor behavior itself began altering the cycle’s rhythm. With everyone expecting post-halving gains, many front-run the move and sell early. Many seasoned players entered early and exited sooner than usual. Meanwhile, large players—ETF holders, market makers, miners—adjusted strategies based on cycle signals: collectively reducing exposure as prices neared "theoretical peaks," amplifying sell-side pressure. The bull market may have been artificially "snuffed out" before reaching full frenzy, causing the peak to arrive earlier and lower than historical patterns.
4. Macro and Policy Variables: Conflicting External Signals. Compared to past cycles, regulatory, political, and macro factors—especially Federal Reserve policy and geopolitical risks—have had unprecedented influence, disrupting traditional cycle dynamics. After Trump took office, he introduced policies favorable to Bitcoin and crypto, though implementation lagged expectations. Late 2024 optimism around a new easing cycle benefited crypto broadly. However, in late 2025, macro conditions shifted: volatile U.S. inflation data and uncertain economic outlook caused Fed rate-cut expectations to waver. In October 2025, U.S.-China trade tensions triggered stock market declines, raising doubts about further Fed easing. Interest rate uncertainty pressured risk assets broadly, pulling Bitcoin down amid rising risk-off sentiment.
5. Dual Impact of Digital Asset Treasuries (DAT). A new phenomenon since 2024 is the growing number of institutions and corporations adding crypto assets like Bitcoin to their balance sheets—forming Digital Asset Treasuries (DAT). Large firms like MicroStrategy keep accumulating Bitcoin as corporate reserves; even small, unrelated companies announce crypto purchases to boost valuations. These holders provided steady buying demand during the bull run, acting as "reservoirs" supporting price growth. However, DATs carry risks: many bought at high prices, so deep price drops could trigger unrealized losses, investor pressure, or forced sales. While no large-scale dumping has occurred, DAT presence adds concern around price floors. The rise of DATs is a new factor in this cycle, reinforcing Bitcoin’s "digital gold" narrative but also tying its volatility more closely to traditional finance.
In sum, multiple variables—ETFs/institutional capital, fragmented narratives, self-fulfilling expectations, macro policy, and DATs—interacted to shape the "abnormal" 2024–2025 cycle. We need a broader, more complex lens. Simply applying past cycle rules may no longer suffice; understanding the underlying drivers and structural shifts is now essential.
5. Outlook and Conclusion
As 2025 draws to a close, Bitcoin stands at a critical juncture after a sharp correction: is this the end of the bull market and start of a bear phase, or merely consolidation before another leg up? Market views are sharply divided. Looking ahead to December 2025 and 2026, we must integrate cyclical patterns with new variables and consider diverse perspectives for rational forecasting.
-
Cycle Perspective: Has the Bull Run Ended, Bear Emerging? Cyclical analysts argue that, under the classic four-year model, the $126K peak in October 2025 likely marked the bull market top. The market is now entering a prolonged adjustment phase, with the next major bull run unlikely until near the 2028 halving. Given the lack of extreme froth at the peak, the decline may be milder. Some suggest this bear market could be a "slow bleed" rather than a crash—institutional resilience may turn a drop to $50K–$60K into a long sideways grind, using time instead of depth to complete the bear phase. Others believe the traditional four-year model no longer applies, arguing the bear market started six months earlier and we’re already in its later stages. Overall, cyclical analysis leans toward Q4 2025 marking a bull-bear turning point, with 2026 trending weakly downward—but declines may be softer and more prolonged than historical bears.
-
Macro Perspective: Policy Easing May Cushion, Risk Assets Still Have Hope. From a macro view, the environment in 2026 may be far friendlier than 2022–2023. Major central banks ended tightening in 2024–2025, and the Fed is expected to begin rate cuts by late 2025. Markets currently assign an ~85% probability to a 25bp cut in December 2025, with multiple cuts anticipated in 2026. Low rates and ample liquidity favor inflation-resistant assets like Bitcoin. Even if the cycle turns downward, macro easing could prevent deep price declines. If correct, 2026 might see a "spring in winter": rate cuts and economic stabilization could lift risk appetite, bringing incremental capital back into crypto for a rebound. Possible scenarios include a U-shaped or L-shaped bottom: continued range-bound trading in H1 2026, followed by gradual recovery in H2 on easing effects. Risks remain: if global recession or geopolitical crises escalate, rate-cut benefits could be offset by flight-to-safety moves, leading to choppy Bitcoin price action. Overall, easing expectations bring hope, but the reversal path may be winding.
-
Market Structure Perspective: Institutional Play and Rational Pricing Become Norm. The 2024–2025 cycle transformed market participant structure, shaping 2026 dynamics. Higher institutional share means prices will be more driven by fundamentals and data, with reduced sensitivity to short-term sentiment. ETF cost basis (~$89K) becomes a key technical level: sustained trading below may trigger further outflows, capping rebounds; conversely, a stable move above could attract fresh inflows. Regarding DATs, 2026 may see divergence: some Bitcoin treasury firms facing financial stress might reduce holdings, but others could take the opportunity to add Bitcoin at lower prices. Miners, as persistent sellers, have production costs (~$40K–$50K) that influence the floor: prolonged drops below cash cost could force shutdowns, reducing supply and aiding bottom formation. Thus, 2026’s Bitcoin market will be more mature and rational—not devoid of opportunities, but less prone to extreme wealth creation or destruction.
Yet, top-tier institutions remain highly confident in Bitcoin’s long-term outlook. ARK Invest reaffirmed its $1.5 million 2030 price target, providing long-term conviction. But in the short to medium term, investors care more about 2026’s actual path. 2026 may be a test of patience and endurance.
Conclusion
In conclusion, Bitcoin’s four-year cycle has not truly failed—but it is evolving. The 2024–2025 market shows that halving-driven supply shocks still exist, invisibly guiding long-term trends. Yet institutional entry, macro integration, and shifting investor expectations have jointly shaped a more complex and unpredictable cycle. At the same time, we see the rise of rational forces, infrastructure progress, and long-term value accumulation.
For crypto investors, this means upgrading knowledge and strategy: embracing data-driven analysis, long-term value investing, and structural opportunities. More importantly, it calls for rational engagement with cycles: staying calm during bull euphoria, maintaining conviction during bear despair. After all, Bitcoin has weathered multiple cycles, consistently reaching new highs, with its underlying value and network effects only strengthening. Cycles may lengthen and amplitudes narrow, but the long-term upward trajectory remains unchanged. Each correction weeds out the weak, letting valuable assets consolidate; every innovation seeds new growth, driving industry evolution.
About Us
Hotcoin Research, the core research arm of Hotcoin Exchange, transforms professional analysis into practical tools for your trading. Through our "Weekly Insights" and "Deep Dive Reports," we unravel market dynamics; via our exclusive column "Top Picks" (AI + expert dual screening), we identify promising assets and reduce trial-and-error costs. Weekly, our analysts engage you live, decoding trends and forecasting movements. We believe that informed guidance and supportive partnership empower more investors to navigate cycles and capture Web3’s value opportunities.
Join TechFlow official community to stay tuned
Telegram:https://t.me/TechFlowDaily
X (Twitter):https://x.com/TechFlowPost
X (Twitter) EN:https://x.com/BlockFlow_News


