Macro Report: How Trump, the Federal Reserve, and Trade Sparked the Largest Market Volatility in History
TechFlow Selected TechFlow Selected
Macro Report: How Trump, the Federal Reserve, and Trade Sparked the Largest Market Volatility in History
The deliberate depreciation of the dollar, colliding with extreme cross-border imbalances and excessive valuations, is brewing a volatile event.
Author: Capital Flows
Translation: TechFlow
Macro Report: The Storm is Coming
"What important truth do very few people agree with you on?"
This is a question I ask myself every day when researching markets.
I have models for growth, inflation, liquidity, market positioning, and prices, but the ultimate core of macro analysis is the quality of insight. Quantitative funds and emerging AI tools are eliminating every statistical inefficiency in the market, eroding previously existing edges. What remains is macro volatility that manifests over longer time horizons.
The Truth
Let me share with you a truth that very few agree with:
I believe within the next 12 months, we will see a significant increase in macro volatility—on a scale surpassing 2022, the pandemic, and possibly even the 2008 financial crisis.
But this volatility’s source will be a deliberate depreciation of the dollar against major currencies. Most people think a falling dollar or "dollar weakness" would boost risk assets, but the opposite is true. In fact, I believe this is today's biggest market risk.
In the past, most investors thought mortgages were too safe to trigger systemic panic, while credit default swaps (CDS) were too complex and irrelevant to matter. Today, there's similar complacency regarding the potential sources of dollar depreciation. Almost no one deeply examines this mechanism, which could shift from being a leading indicator to a real driver of asset price risk. You can spot this blind spot by discussing it with others. They insist dollar weakness always benefits risk assets and assume the Fed will step in at the first sign of serious trouble. It is precisely this mindset that makes a deliberately engineered dollar depreciation more likely to cause risk assets to fall, not rise.
The Path Ahead
In this article, I will detail how this mechanism works, what signals indicate when this risk emerges, and which assets will be most affected—both positively and negatively.
All of this boils down to the convergence of three key factors, accelerating as we approach 2026:
-
Liquidity imbalances from global cross-border capital flows creating systemic fragility;
-
The Trump administration's stance on monetary policy, geopolitics, and trade;
-
The appointment of a new Fed Chair whose monetary policy will align with Trump’s negotiation strategy.
Roots of Imbalance
For years, unbalanced cross-border capital flows have created structural liquidity imbalances. The issue isn't the size of global debt, but how these flows have shaped balance sheets into inherently fragile structures. This dynamic resembles the adjustable-rate mortgage situation before the Global Financial Crisis (GFC). Once this imbalance begins to reverse, the system’s own structure accelerates correction, rapidly draining liquidity and making the process uncontrollable—a mechanical vulnerability embedded in the system.
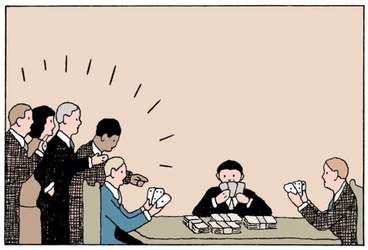
It all starts with the U.S. acting as the world’s sole “buyer.” Thanks to the dollar’s reserve currency status, America imports goods at prices far below domestic production costs. Every time the U.S. buys from the rest of the world, it pays in dollars. Most often, foreign holders reinvest those dollars into U.S. assets to maintain trade relationships, largely because the U.S. market is nearly the only viable destination. After all, where else can you bet on the AI revolution, robotics, or someone like Elon Musk?
This cycle repeats endlessly: U.S. buys goods → pays foreigners in dollars → foreigners use those dollars to buy U.S. assets → enabling the U.S. to keep buying cheap goods, as foreigners continue holding dollars and U.S. assets.
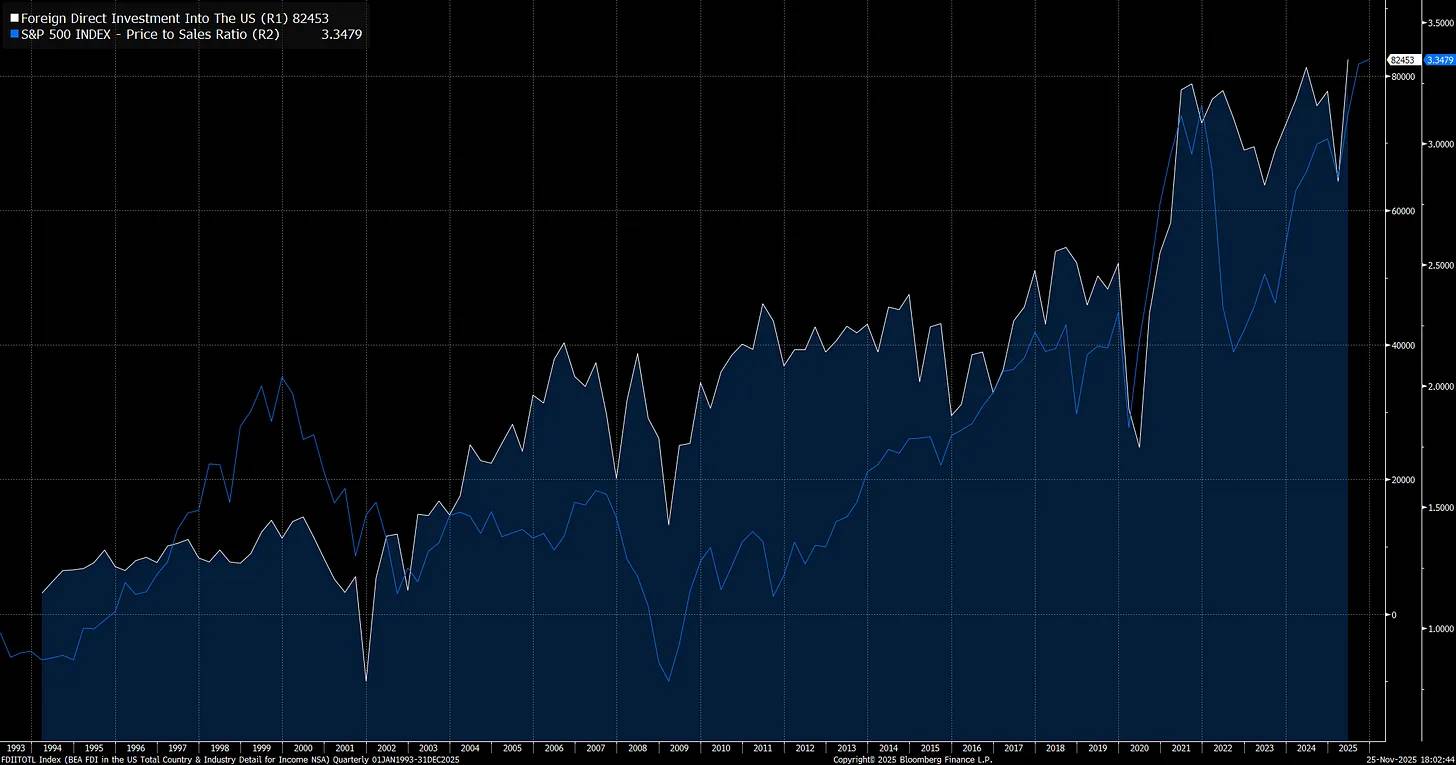
This loop has led to severe imbalances—the U.S. current account (the gap between imports and exports, white line) is now at extreme levels. On the flip side, foreign investment in U.S. assets (blue line) has reached historic highs:

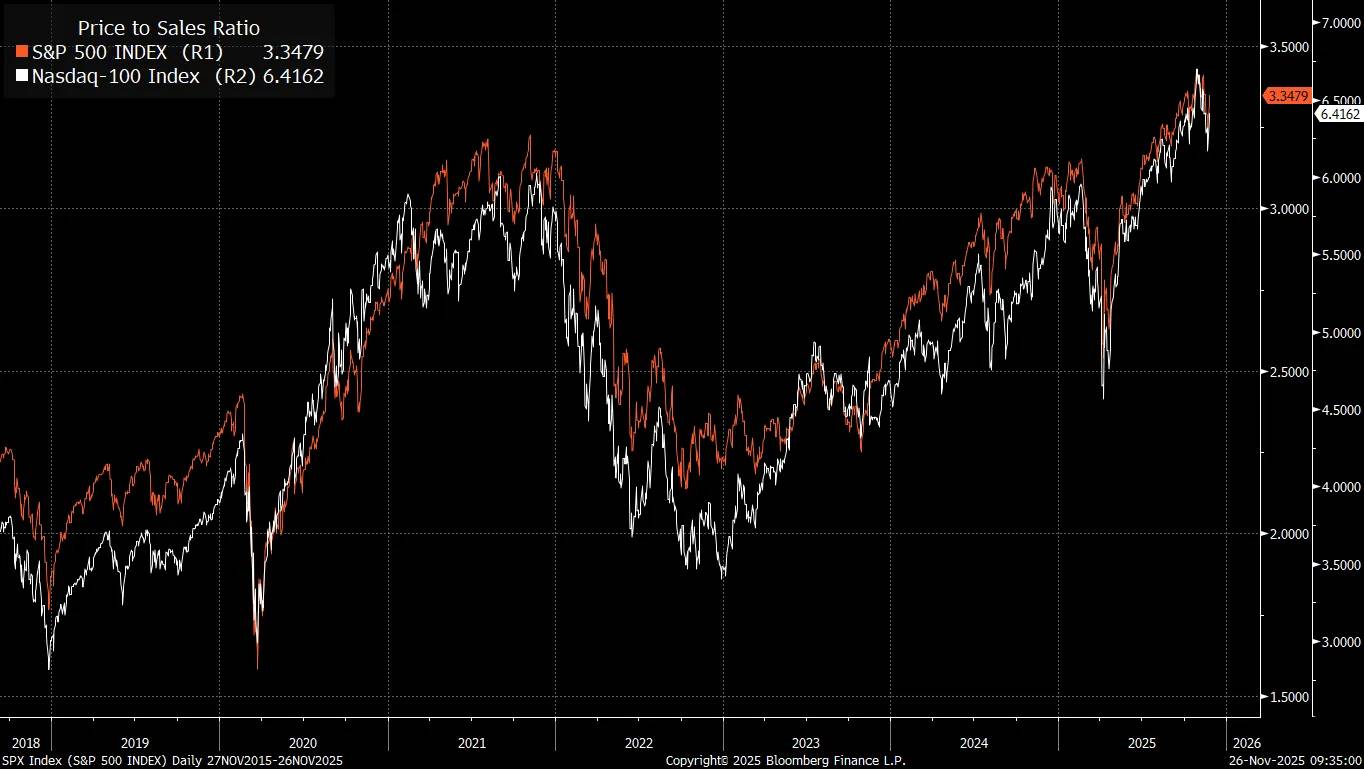
When foreign investors indiscriminately buy U.S. assets just to keep exporting to America, this explains why the S&P 500’s valuation (price-to-sales ratio) has reached record highs:
Traditional stock valuation frameworks stem from Warren Buffett’s value investing principles. These worked well in an era of limited global trade and lower system-wide liquidity. But what’s often overlooked is that global trade itself expands liquidity. From an accounting perspective, one side of the current account corresponds directly to the capital account on the other.
In practice, when two countries trade, their balance sheets effectively guarantee each other, and these cross-border flows exert powerful influence on asset prices.
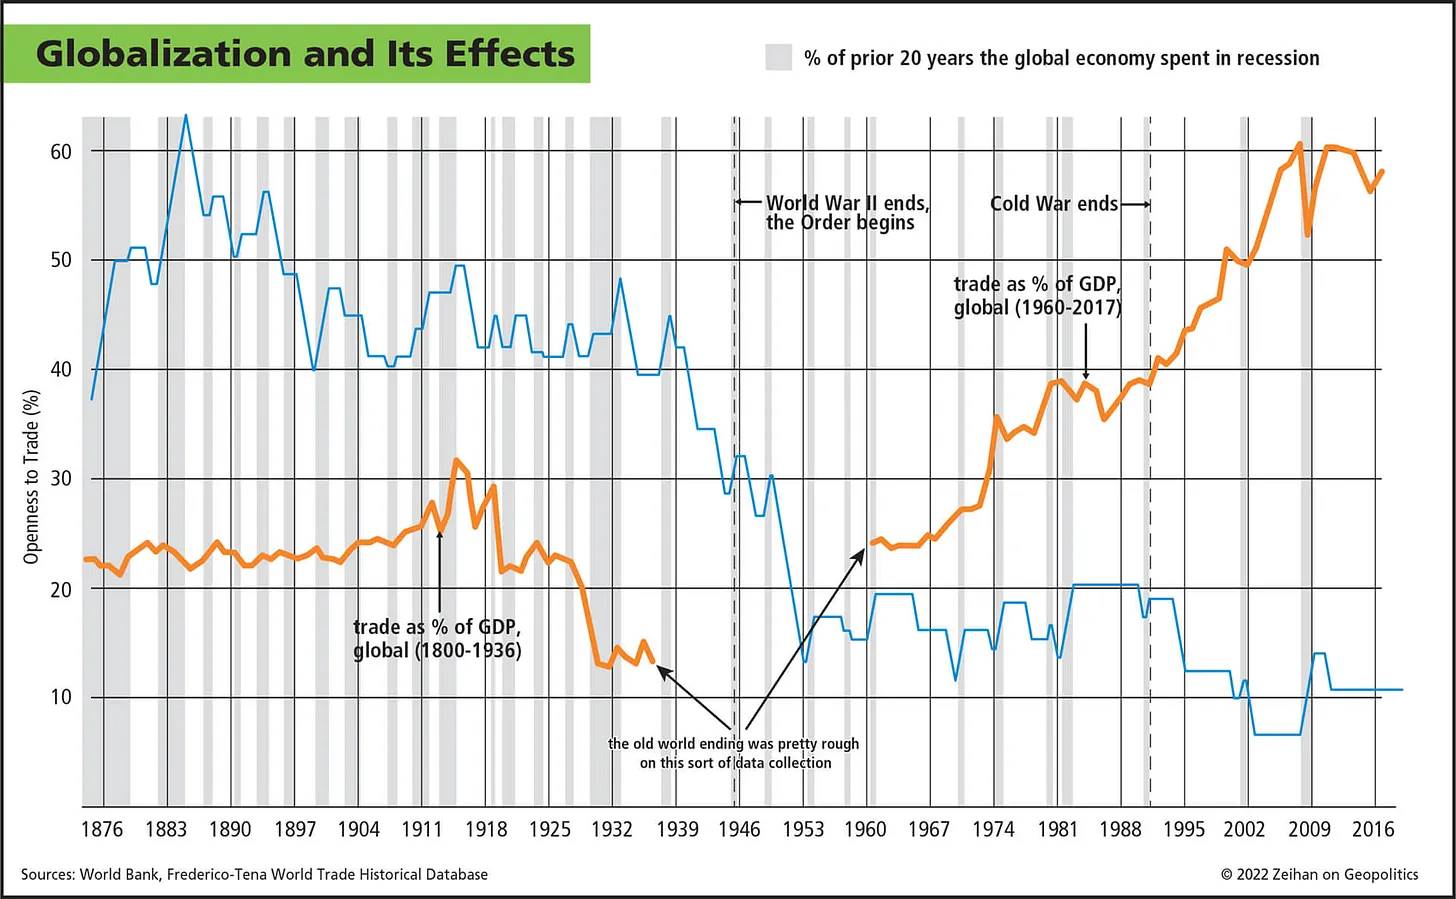
As the world’s largest importer, the U.S. receives massive capital inflows, explaining why the ratio of total U.S. market capitalization to GDP is significantly higher than in the 1980s—the era when Graham and Dodd established the value investing framework in *Security Analysis*. This isn’t to say valuations don’t matter, but rather that from a market cap perspective, much of this shift is driven by changes in macro liquidity—not simply “Mr. Market behaving irrationally.”

Before the GFC, one major source of fragile capital structure in the mortgage market was foreign investors buying private-sector U.S. debt:
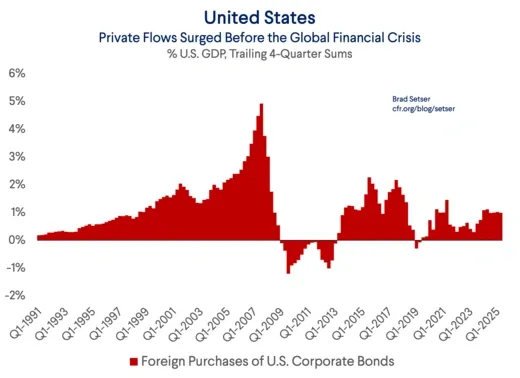
Michael Burry’s famous “big short” during the GFC was based precisely on recognizing this fragile capital structure, with liquidity repricing as domestic and cross-border flows shifted. That’s why I find a fascinating link between Burry’s current analysis and my work on cross-border liquidity.
Foreign investors are injecting ever more capital into the U.S., and both foreign inflows and passive investments are increasingly concentrated in the top seven stocks of the S&P 500.
Crucially, note the type of imbalance here. Brad Setser offers brilliant analysis showing how carry trade dynamics in cross-border flows structurally breed extreme market complacency:
Why does this matter? Because many financial models today (in my view, incorrectly) assume that during future financial instability—such as a sell-off in U.S. equities or credit—the dollar will rise. This assumption makes investors more comfortable holding unhedged dollar-denominated assets.
The logic goes: Yes, my fund is heavily overweight U.S. assets because U.S. dominance in global equity indices is unquestionable, but this risk is partly offset by the natural hedge offered by the dollar. After all, the dollar usually rises during bad news. During major equity corrections (like in 2008 or 2020, for different reasons), the dollar tends to strengthen, so hedging dollar exposure would effectively remove this natural hedge.
Even more conveniently, expectations that the dollar acts as a hedge for equities (or credit), based on past correlations, also justify higher current returns—since it provides rationale for not hedging U.S. exposure when hedging costs are high.
However, the problem is that past correlations may not persist.
If the dollar rose in 2008 not due to its reserve status, but because funding currencies tend to rise (and destination currencies fall) during carry unwind, then investors shouldn’t assume the dollar will keep rising during future turmoil.
One thing is certain: the U.S. is currently the recipient in most carry trades.
Foreign money did not flow out of the U.S. during the global financial crisis
This is exactly what makes today’s world different: foreign investors’ returns on the S&P 500 depend not only on index performance but also on currency returns. If the S&P 500 rises 10% in a year but the dollar depreciates by the same amount against the investor’s home currency, there’s no positive return for foreign investors.
The chart below compares the S&P 500 (blue line) with a hedged version. As shown, accounting for currency shifts significantly alters long-term investment returns. Now imagine compressing these multi-year shifts into a short timeframe. The massive risk driven by cross-border flows could be amplified dramatically.

This brings us to an accelerating catalyst—one that puts global carry trades at risk: the Trump administration’s stance on currency, geopolitics, and trade.
Trump, FX, and Economic War
At the start of this year, two specific macro shifts emerged, accelerating the buildup of latent risks in the global balance of payments system.
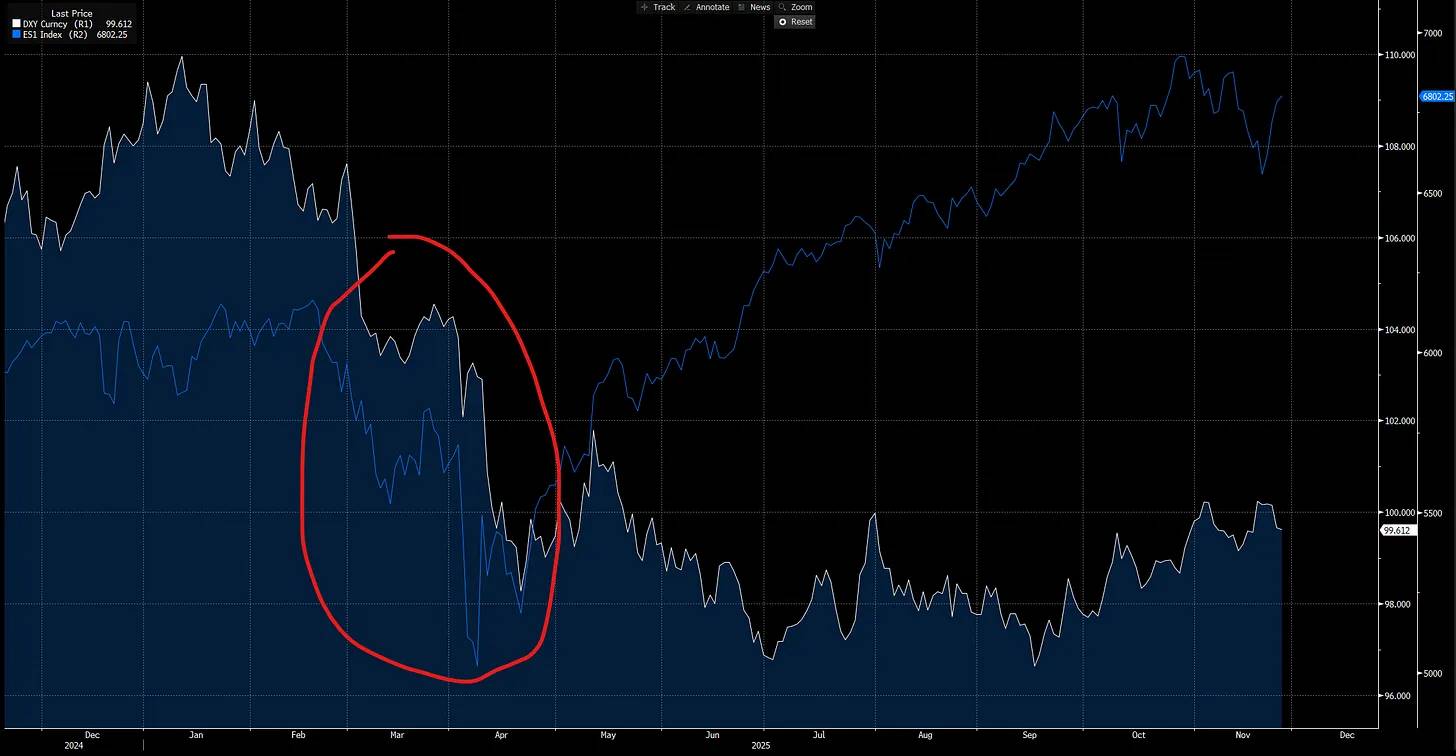
We’ve seen dollar depreciation and U.S. equity declines happening simultaneously, driven by tariff policies and cross-border capital flows—not domestic default concerns. This is precisely the kind of risk stemming from the imbalance I described earlier. The real danger is that if the dollar weakens while U.S. stocks fall, any Fed intervention would further weaken the dollar, almost certainly amplifying downward pressure on equities (contrary to traditional views of the “Fed Put”).
When selling pressure comes externally and is currency-driven, the Fed’s position becomes far more difficult. This signals we’re already in the “macro end game,” where currency becomes the asymmetric linchpin of everything.
Trump and Bessent are openly pushing for a weaker dollar, using tariffs as leverage in economic conflict with China. If you haven’t read my prior research on China’s economic war against the U.S., check out my YouTube video titled *The Geopolitical End Game*.
The core idea: China is intentionally weakening other nations’ industrial bases to create dependency and gain strategic leverage.
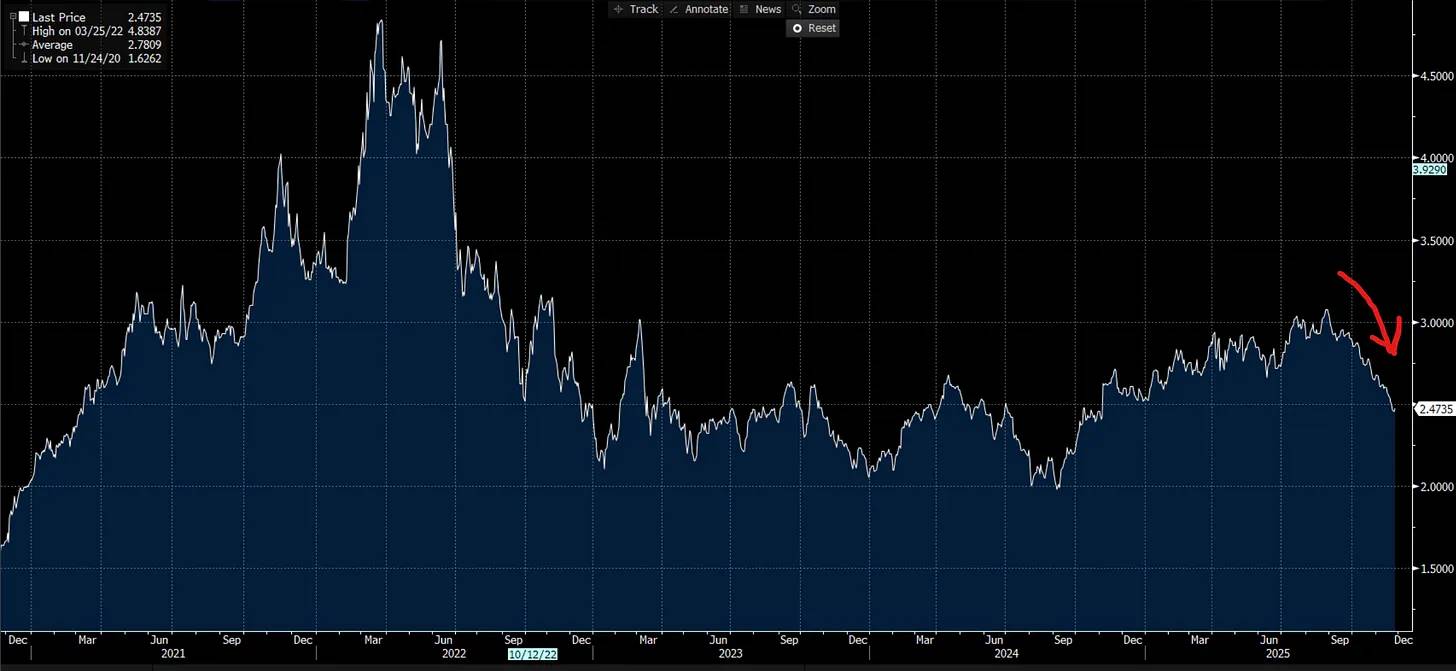
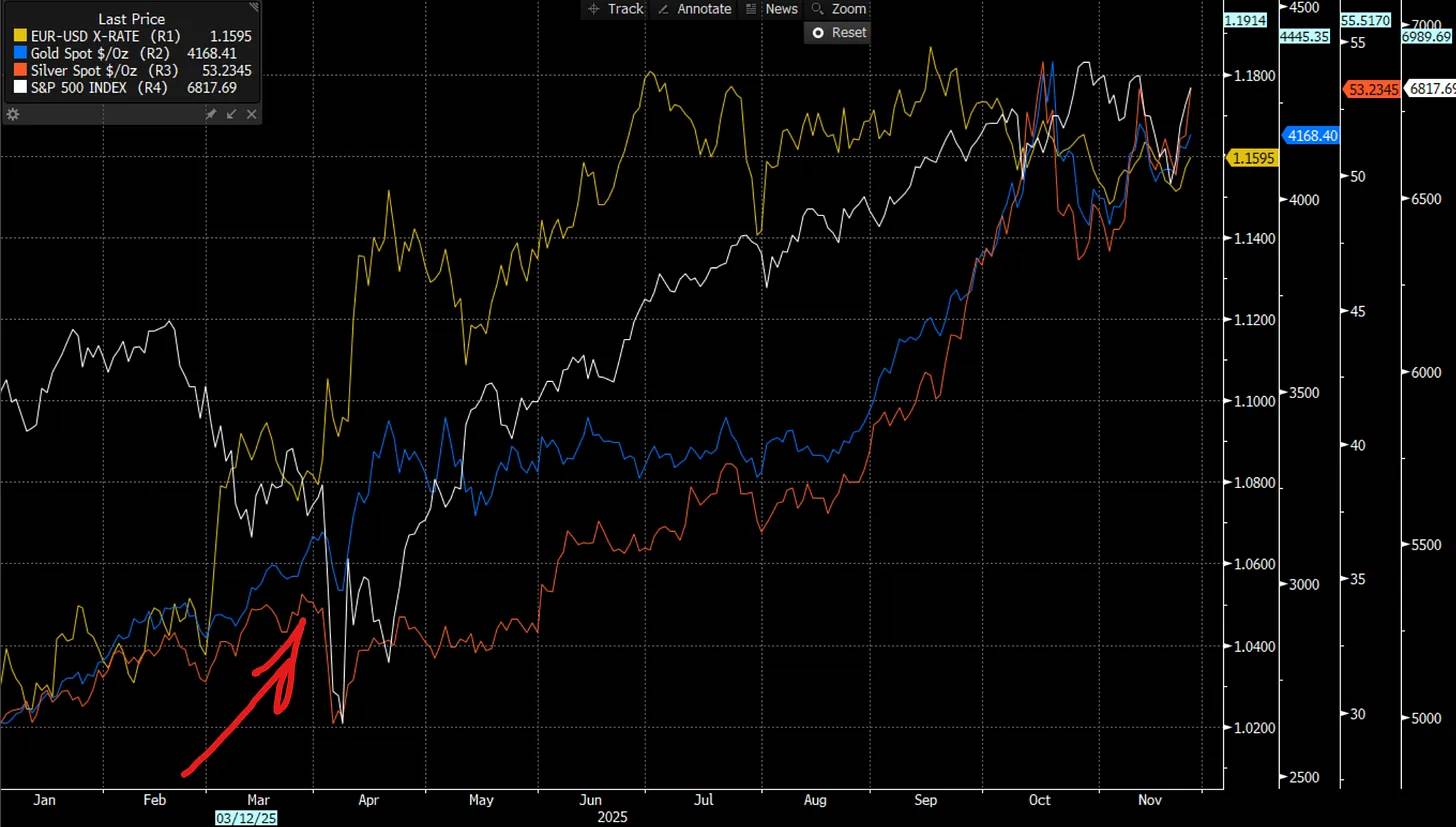
From the moment Trump took office (red arrow), the dollar index (DXY) began declining—and this is just the beginning.
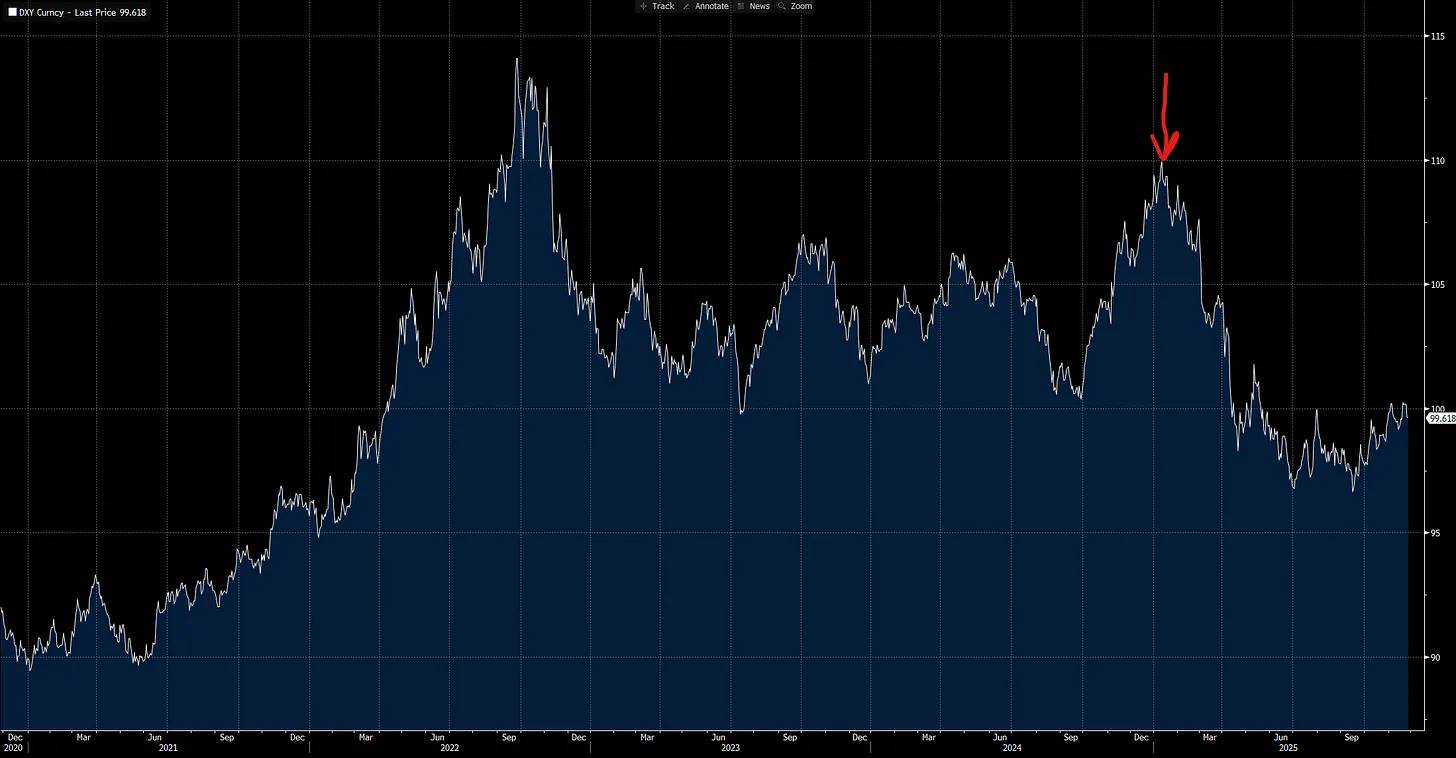
Note that short-end real interest rates are one of the main drivers of the dollar index (DXY), meaning both monetary policy and Trump’s tariff agenda are jointly fueling this trend.

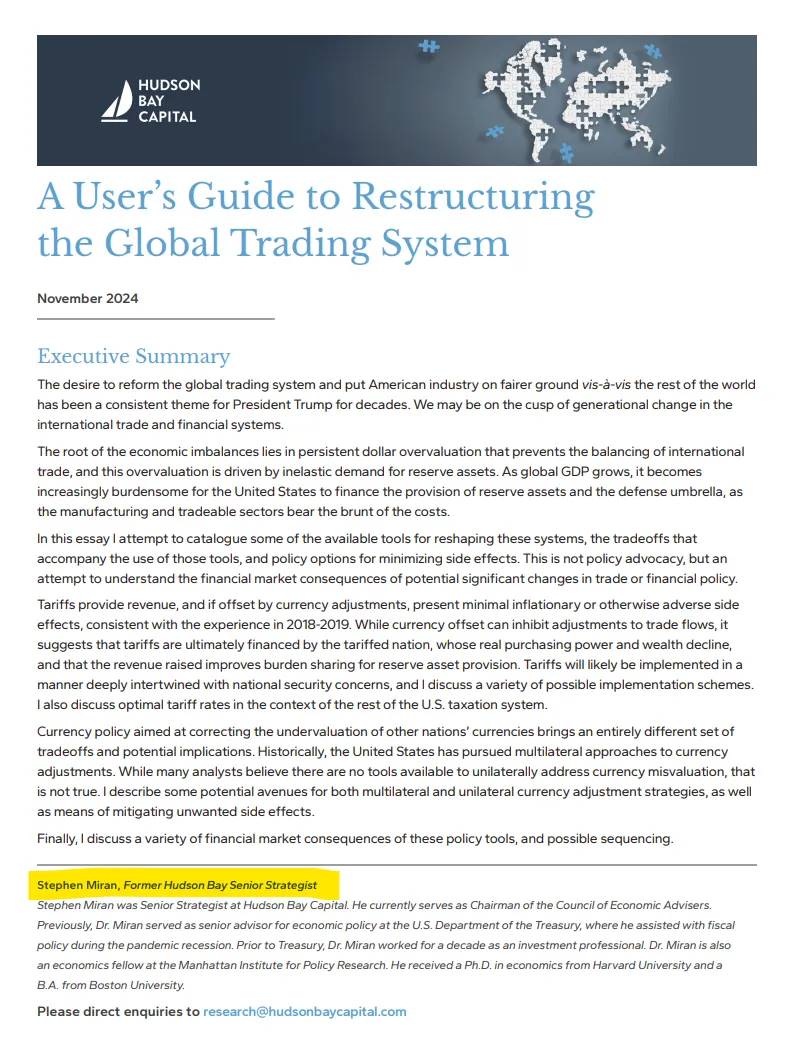
Trump needs the Fed to adopt a looser monetary stance—not just to stimulate the economy, but to weaken the dollar. One reason he appointed Steven Miran to the Fed Board is Miran’s deep understanding of how global trade functions.
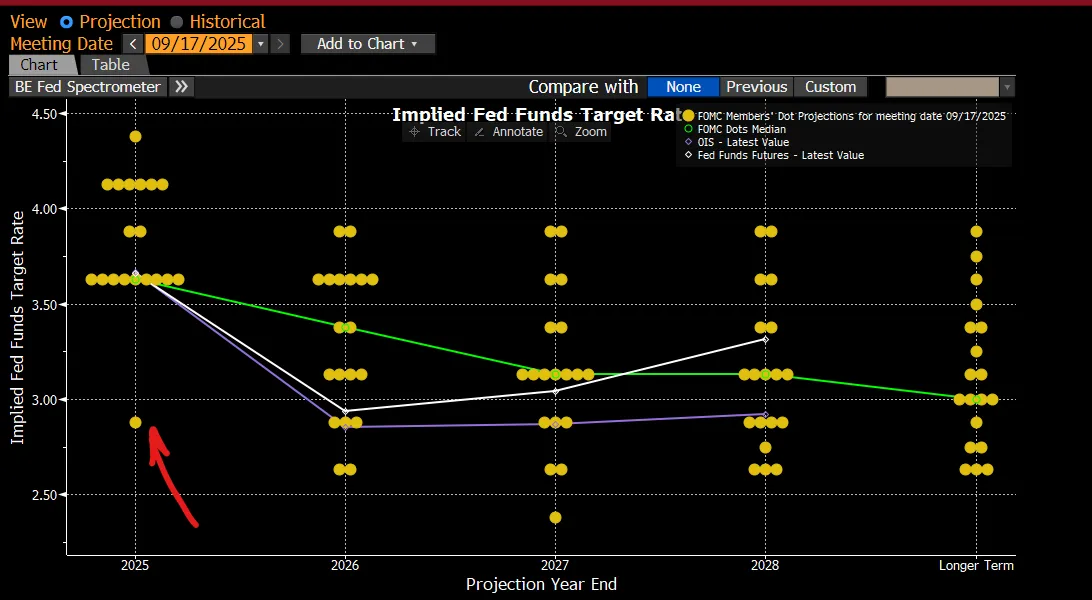
What was Miran’s first move upon joining? He placed his dot plot projections a full 100 basis points below other FOMC members—an unmistakable signal of extreme dovishness and an attempt to pull others toward easier policy.
Core Point:
There’s a central dilemma: the U.S. is in a real economic conflict with China and must respond aggressively, or risk losing strategic dominance. Yet a weak-dollar policy achieved through ultra-loose monetary policy and aggressive trade negotiations is a double-edged sword. In the short term, it boosts domestic liquidity, but simultaneously suppresses cross-border capital flows.
A weaker dollar may prompt foreign investors to reduce exposure to U.S. equities amid dollar depreciation, as they adjust to new trade conditions and shifting FX environments. This places the U.S. on a cliff edge: one path is confronting China’s economic aggression head-on; the other risks a sharp repricing of U.S. equities due to dollar depreciation against major currencies.
New Fed Chair, Midterms, and Trump’s Grand Strategy
We are witnessing the formation of global imbalances directly tied to cross-border capital flows and currency dynamics. Since Trump took office, these imbalances have accelerated as he confronts the system’s largest structural distortions, including economic conflict with China. These aren’t theoretical—they’re already reshaping markets and global trade. All of this sets the stage for a catalytic event next year: a new Fed Chair taking office during midterms, as Trump enters his final two years determined to leave a lasting legacy.
I believe Trump will push the Fed toward the most aggressive dovish monetary policy to achieve a weak dollar—until inflation risks force a reversal. Most investors assume a dovish Fed is always bullish for stocks, but this only holds when the economy is resilient. Once dovish policy triggers adjustments in cross-border positions, this logic collapses.
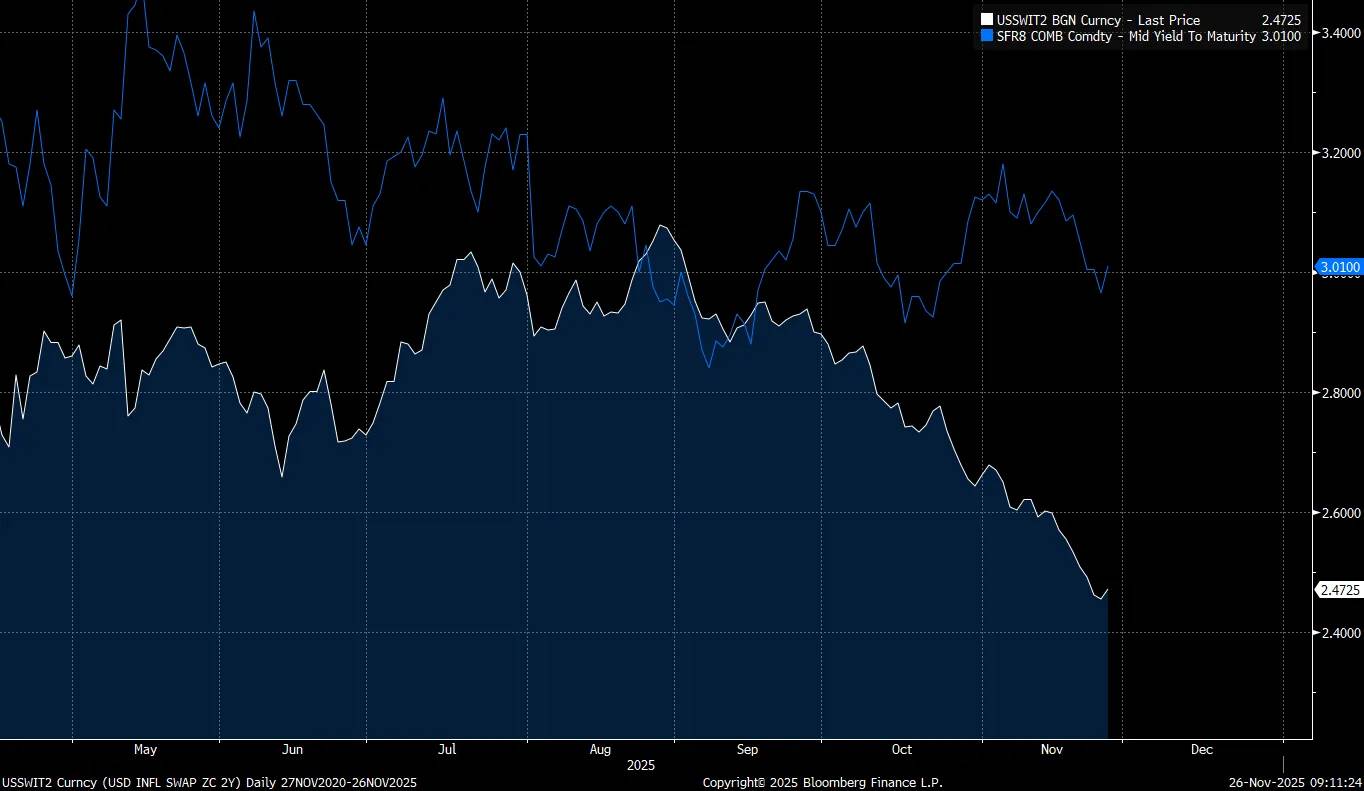
If you follow my research, you know long-term rates always price in central bank policy errors. When the Fed cuts too aggressively, long yields rise and the yield curve undergoes bear steepening to counteract policy mistakes. The Fed’s current advantage is that inflation expectations (see chart: 2-year inflation swap) have declined for a full month, shifting the risk balance and allowing temporary dovishness without triggering significant inflation pressures.
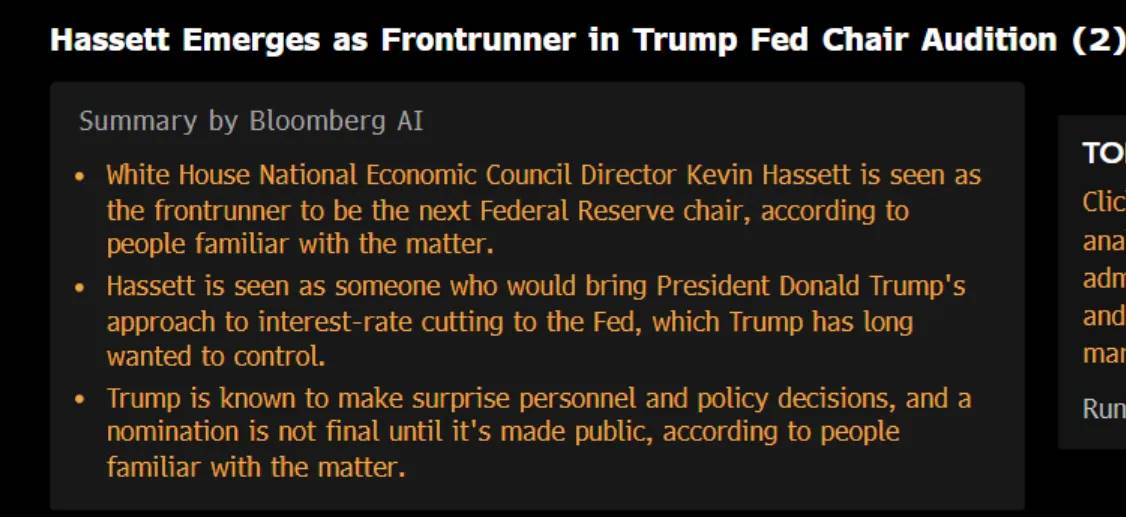
With inflation expectations falling, we now get word of a new Fed Chair taking office next year—one likely aligned more closely with Miran than other board members:
If the Fed adjusts the terminal rate (currently reflected in the eighth SOFR contract) to better reflect changing inflation expectations, this will begin lowering real rates and further weakening the dollar—because with inflation risk recently reduced, the Fed has room to act.
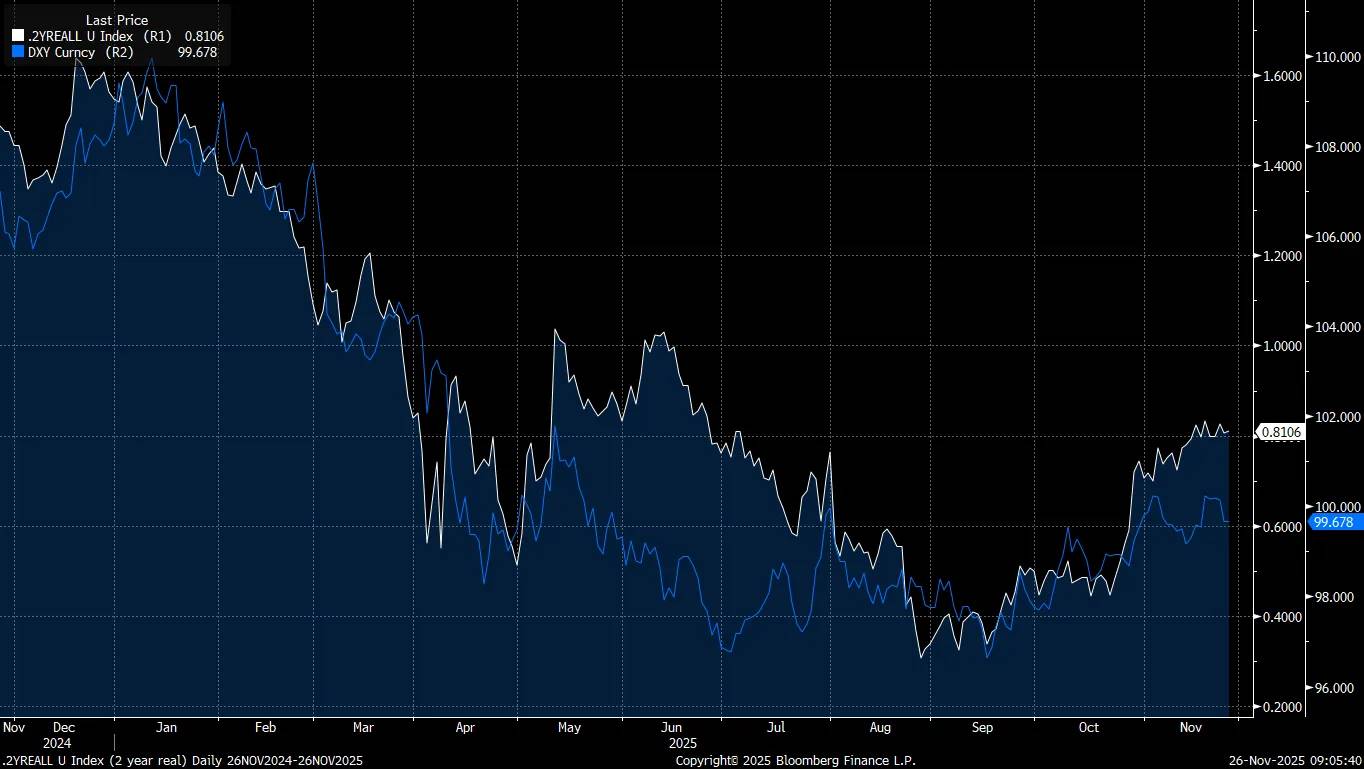
We’ve already seen recent rises in real rates (white line) slow the dollar’s (blue line) decline, but this is building greater imbalance, paving the way for further rate cuts that could push the dollar lower.
If Trump wants to reverse global trade imbalances and compete with China in economic conflict and AI leadership, he needs a significantly weaker dollar. Tariffs give him negotiating leverage to secure trade deals aligned with a weak-dollar strategy while preserving U.S. dominance.
The problem is that Trump and Bessent must balance multiple challenges: avoiding politically damaging outcomes before midterms, managing a Fed with internal resistance to extreme dovishness, and hoping the weak-dollar strategy doesn’t trigger foreign investors to dump U.S. stocks—widening credit spreads and hitting an already fragile labor market. This combination easily pushes the economy to the brink of recession.
The biggest risk is that current market valuations are at historic extremes, making equities far more sensitive to liquidity shifts than ever before. That’s why I believe we’re approaching a major turning point within the next 12 months. Potential catalysts for an equity sell-off are multiplying rapidly.
"What important truth do very few people agree with you on?"
The market is sleepwalking into a structural risk almost no one is pricing in: a deliberately engineered dollar depreciation that will turn what investors see as tailwinds into next year’s primary source of volatility. Complacency around a weak dollar mirrors pre-2008 complacency around mortgages—and that’s exactly why a deliberate dollar depreciation could hit risk assets harder than investors expect.
I firmly believe this is the most overlooked and misunderstood risk in global markets. I’ve been actively building models and strategies around this single tail event, preparing to massively short the market when structural collapse occurs.
Timing the Macro Turning Point
Now I want to connect these ideas directly to concrete signals that reveal when this specific risk is rising—especially as cross-border flows begin altering macro liquidity structures.
Position unwinds in U.S. equities happen frequently, but understanding the underlying drivers determines the severity of selling pressure. If driven by cross-border flows, market fragility increases significantly, requiring much higher vigilance.
The chart below shows key periods when cross-border positioning started exerting stronger selling pressure on U.S. equities. Monitoring this will be crucial:
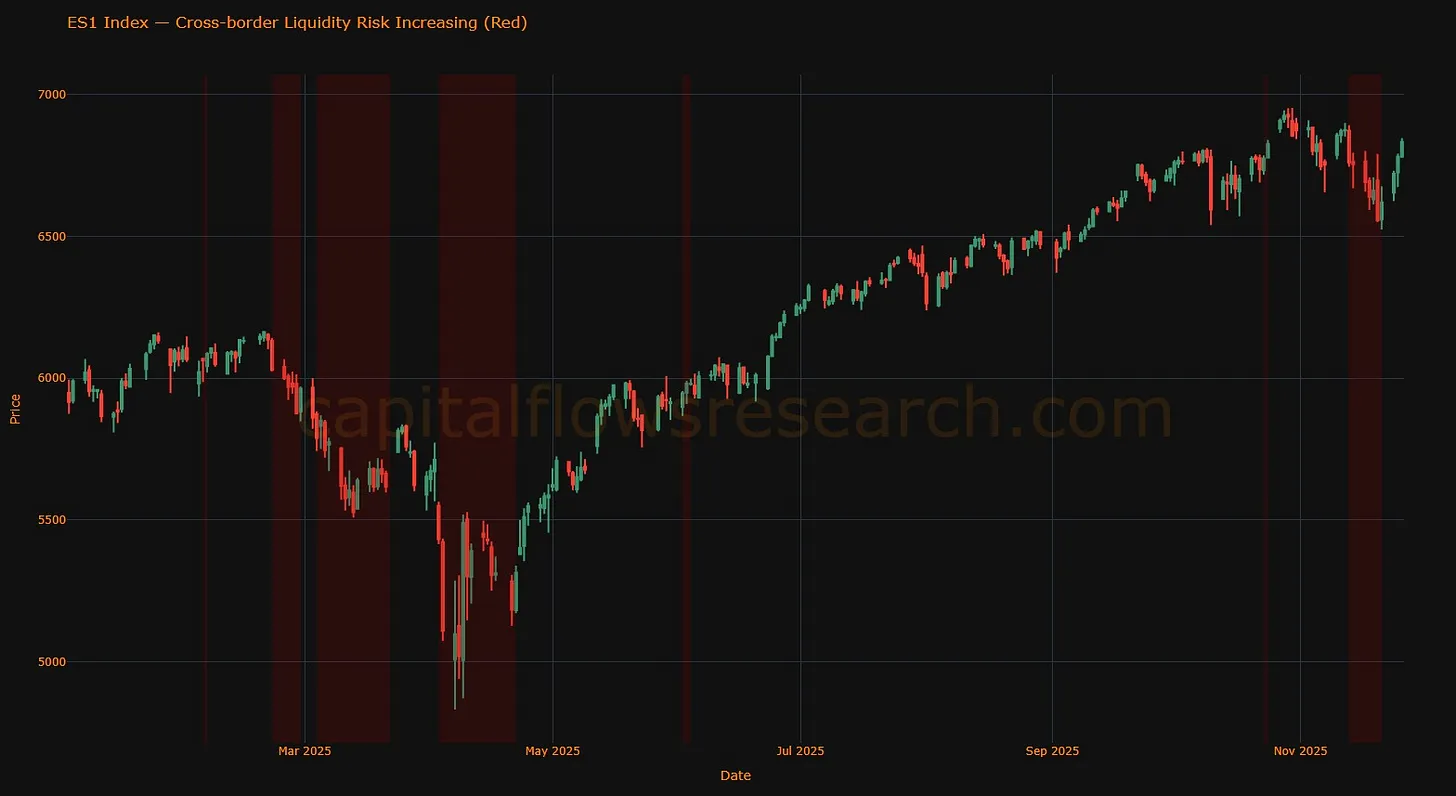
Note that since the March market sell-off, when EURUSD rebounded and call skew spiked, the market has maintained a higher baseline level of call skew. This elevated baseline is almost certainly linked to structural positioning risks in cross-border capital flows.
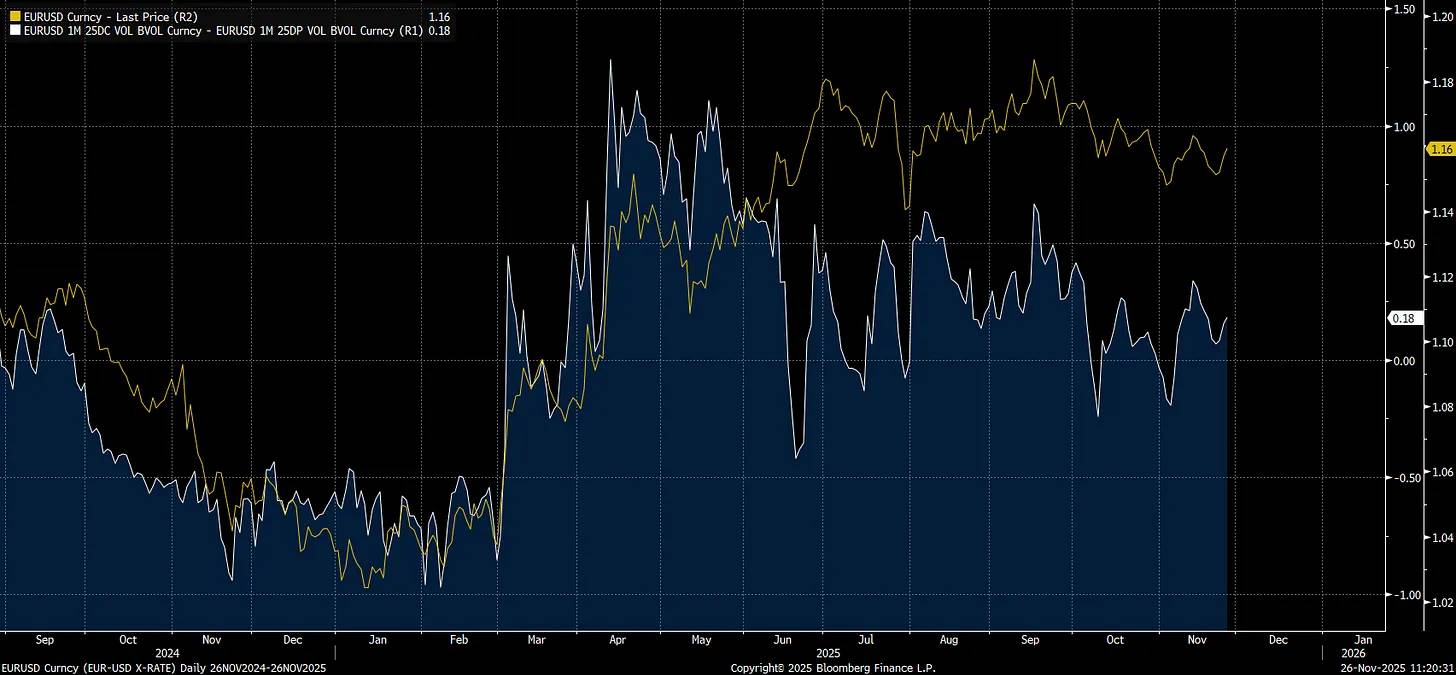
Whenever cross-border flows become the source of liquidity expansion or contraction, it correlates directly with net FX flows. Knowing exactly where foreign investors are adding or reducing exposure in U.S. equities is critical—it will signal when risk begins rising.
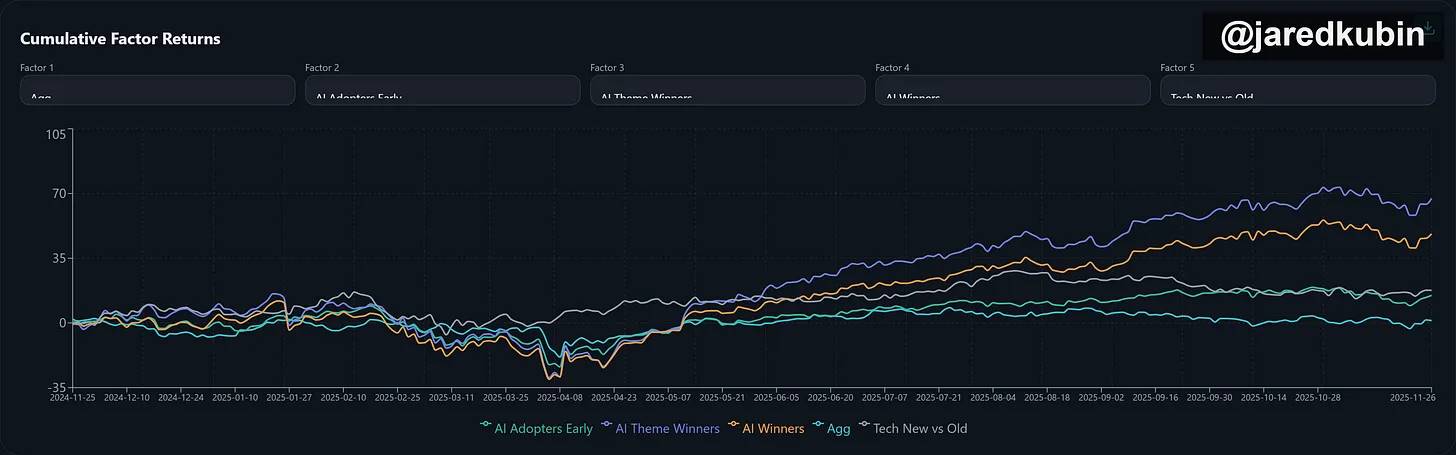
I recommend tracking this via the factor models provided by https://www.liquidationnation.ai/. Factor, sector, and thematic performance are key indicators for understanding how capital moves through the system.
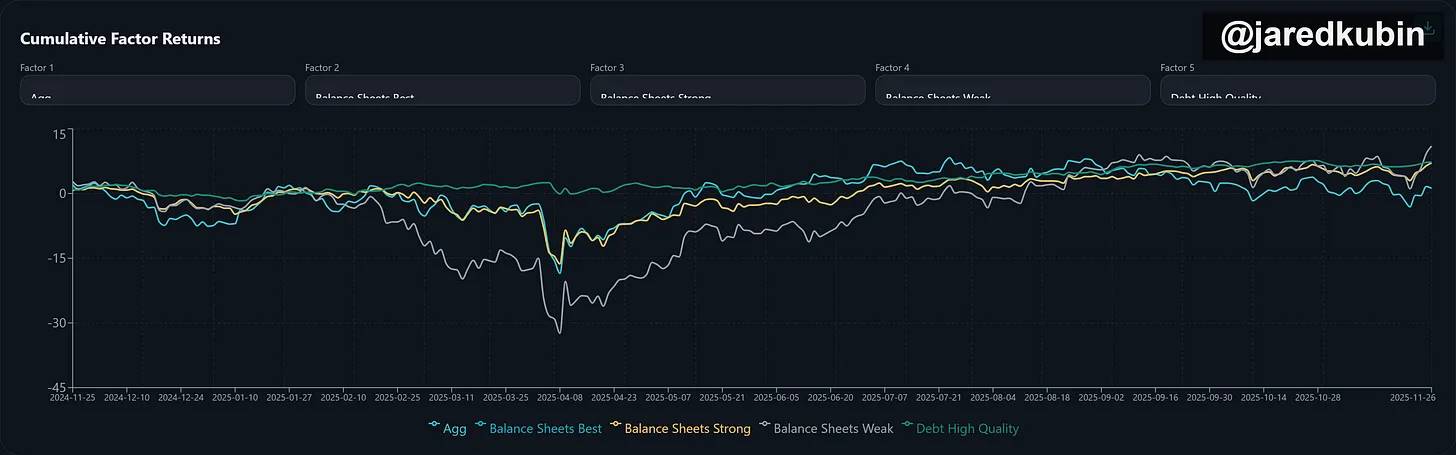
This is especially important for the AI theme, where capital is becoming increasingly concentrated:
To further explain these flow linkages, I’ll release an interview with Jared Kubin in the first week of December for subscribers (follow him on Twitter: link). He’s founder of https://www.liquidationnation.ai/ and a valuable resource in my research journey.
Main Signals of Cross-Border Sell-Off Include
-
Dollar depreciation against major currencies alongside rising cross-asset implied volatility.
-
Skew in major currency pairs will be key confirmation signals,
Monitor via CVOL tools:
https://www.cmegroup.com/market-data/cme-group-benchmark-administration/cme-group-volatility-indexes.html
-
Equity sell-offs occurring simultaneously with dollar depreciation.
Selling pressure may be led by high-beta stocks or themes, with low-quality stocks suffering most (which is why you should follow https://www.liquidationnation.ai/).
-
Cross-asset and cross-border correlations may approach 1.
Even small adjustments in the world’s largest imbalances could lead to extreme asset co-movement. Watching other countries’ equity and factor performance will be crucial.
-
Final signal: Fed liquidity injections cause the dollar to fall further and intensify equity sell-offs.
This scenario becomes even more dangerous if policy-driven dollar depreciation triggers domestic stagflation.
See Brad Setser: https://www.cfr.org/article/foreign-money-flowed-out-us-not-during-global-financial-crisis)
Although gold and silver rose slightly during earlier cross-border sell-offs this year, they still faced selling during true market collapses due to cross-collateralization across the system. While holding gold and silver may offer upside, they won’t provide diversification benefits when VIX truly spikes. The only profitable approach is active trading, holding hedged positions, shorting the dollar, and going long volatility.
The biggest challenge: we’re in an economic phase where real cash returns are declining. This systematically forces capital to move up the risk curve, building net long positions before liquidity shifts. Timing this transition is critical—because the risk of not owning equities during a credit cycle is as significant as holding cash or unhedged positions during a bear market.
(I currently hold long positions in equities, gold, and silver, as liquidity drivers still have room to rise.
I’ve detailed this for paid subscribers:
https://www.capitalflowsresearch.com/p/equity-strategy-opening-new-macro)
The Macro End Game
The core message is simple: global markets are ignoring the single most important risk of this cycle. A deliberate dollar depreciation colliding with extreme cross-border imbalances and stretched valuations is brewing a volatility event—mirroring the complacency we saw before 2008. You can’t predict the future, but you can correctly analyze the present. And current signals show pressure building beneath the surface.
Understanding these mechanisms is crucial—they tell you what signals to watch, which grow louder as risk approaches. Awareness itself is an edge. Most investors still assume dollar weakness automatically benefits markets. That assumption is dangerously wrong today—just as believing mortgages were “too safe” in 2007. This is the silent beginning of the macro end game, where global liquidity structure and currency dynamics become the decisive drivers of every major asset class.
For now, I remain bullish on equities, gold, and silver. But the storm is brewing. When my models begin signaling rising risk, I will turn bearish on equities and immediately notify subscribers of this shift.
If 2008 taught us anything, it’s that warning signs are always detectable—if you know where to look. Monitor the right signals, understand the underlying dynamics, and when the tide turns, you’ll be ready.
Join TechFlow official community to stay tuned
Telegram:https://t.me/TechFlowDaily
X (Twitter):https://x.com/TechFlowPost
X (Twitter) EN:https://x.com/BlockFlow_News