
Has the crypto market already digested the negative impact of the Israel-Iran conflict?
TechFlow Selected TechFlow Selected
Has the crypto market already digested the negative impact of the Israel-Iran conflict?
The increasing proportion of long-term holders and the participation of institutional investors have transformed it from a speculative asset into a liquidity hedge.
 Navigating Web3 tides with focused insights
Author: Mars Finance
Introduction: The Enigma of Digital Asset Resilience in Turbulent Times
Global financial markets in June 2025 are undergoing an epic stress test: Ukrainian drones destroying 41 nuclear bombers triggering nuclear proliferation fears, renewed U.S.-China tariff tensions, and Middle Eastern missiles piercing the night sky. While traditional safe-haven gold breaks through $3,450 per ounce approaching new highs, Bitcoin displays astonishing stability near the $105,000 mark. This apparent "desensitization" to geopolitical crises reflects a profound shift in the underlying logic of the crypto market. This article decodes Bitcoin's survival rules during macroeconomic turmoil across three dimensions—market structure, macro cycles, and monetary order restructuring.
I. Breakdown of Geopolitical Shock Transmission: From Panic Amplifier to Risk Isolator
1. The "Blunting Effect" of Conflict Shocks
During Israel’s June 13 airstrike on Iranian nuclear facilities, Bitcoin briefly dropped 2% within two hours before quickly stabilizing—a stark contrast to its 10% single-day plunge during the 2022 Russia-Ukraine conflict. This enhanced resilience stems from structural changes in the market: Glassnode data shows long-term holders (LTH) now account for over 70% in 2025, with speculative holdings at their lowest level in five years. Institutional investors' hedging systems built via derivatives markets have effectively buffered immediate impacts from sudden events.
2. Paradigm Shift in Safe-Haven Logic
The conventional notion of Bitcoin as “digital gold” is being redefined. Amid growing expectations of a Fed rate-cutting cycle, Bitcoin’s negative correlation (-0.72) with real yields on 10-year Treasuries has strengthened significantly, positioning it more as a "liquidity hedge" rather than a pure safe-haven asset. When actual rates spiked due to weak demand in the June 1 Treasury auction, Bitcoin’s counter-trend rally confirmed this emerging characteristic.
3. Directional Absorption of Geopolitical Premium
Energy supply chain disruptions caused by Middle East conflicts are objectively accelerating de-dollarization. Over 15% of Iran’s oil exports are now settled using Bitcoin, and such real-economy penetration transforms certain geopolitical risks into rigid demand for Bitcoin. Blockchain analytics firm Chainalysis reports that on-chain transaction volumes from wallet addresses in conflict zones surged 300% following these incidents.
II. Nested Macroeconomic Cycles: Dual Support from Rate Cut Expectations and Easing Inflation
1. Certainty Dividend from Monetary Policy Pivot
CME FedWatch tools indicate a 68% probability of rate cuts in Q3, directly reflected in steepening Bitcoin futures curves: annualized premium on June 15 contracts rose to 23%, the highest since the 2024 halving. Historical data shows that in the three months preceding the start of a rate-cut cycle, Bitcoin has averaged a 37% gain—far exceeding gold’s 12%.
2. Structural Resolution of Sticky Inflation
The May core PCE price index slowed to 2.8% year-on-year, while the Global Supply Chain Pressure Index (GSCPI) returned to pre-pandemic levels. This weakens Bitcoin’s inflation-hedging narrative but unexpectedly highlights its “growth-sensitive asset” attributes. MicroStrategy’s latest financial report reveals corporate accounting treatment of Bitcoin has shifted from “intangible asset” to “strategic reserve,” signaling institutional adoption into growth stock valuation frameworks.
3. Arbitrage Opportunities from Sino-U.S. Policy Divergence
The People’s Bank of China has consecutively increased gold reserves for six months, reaching 30,000 ounces, while the U.S. Treasury drives the dollar index down 12% year-to-date via a “controlled depreciation” strategy. This policy divergence fosters gray-market arbitrage through Bitcoin for cross-border capital flows. Chainalysis detected a 470% surge in Bitcoin OTC trading volume along China-U.S. trade corridors during tariff disputes.
III. Deep Market Structure Transformation: From Retail Frenzy to Institutional Pricing
1. Deleveraging in Holding Structure
In 2025, hedging positions accounted for over 60% of futures open interest—the first time ever—while perpetual contract funding rates remain consistently below 0.01% daily. This reduces reliance on leveraged capital; the “long-short liquidation spiral” common in 2021 has largely disappeared. BlackRock’s Bitcoin ETF assets surpassed $130 billion, with its net daily inflows showing a significant negative correlation with the S&P 500 Volatility Index (VIX).
2. Layered Strengthening of Liquidity Structure
Coinbase institutional custody balances exceeded 4 million BTC, approximately 21% of circulating supply. These “cold storage” holdings act as natural price stabilizers, making it difficult for short-term sell-offs to breach key support levels. During panic selling triggered by Iran’s missile attack on June 14, over $3 billion in bids emerged at the $100,000 level, with 90% originating from institutional OTC desks.
3. Convergence with Traditional Valuation Frameworks
The 90-day correlation between Bitcoin and the Nasdaq 100 Index has declined from 0.85 in 2021 to 0.32, while its correlation with Russell 2000 small-cap stocks has risen to 0.61. This shift indicates the market is rebuilding Bitcoin’s valuation logic using traditional asset pricing models: Bitcoin’s annualized volatility (45%) now resembles that of tech growth stocks, far below the 128% seen in 2021.
IV. Short-Term Price Analysis
On Friday, Bitcoin found support at the 50-day simple moving average (SMA) of $103,604, but bulls failed to push prices above the 20-day exponential moving average (EMA) of $106,028, indicating lack of buying momentum at higher levels.
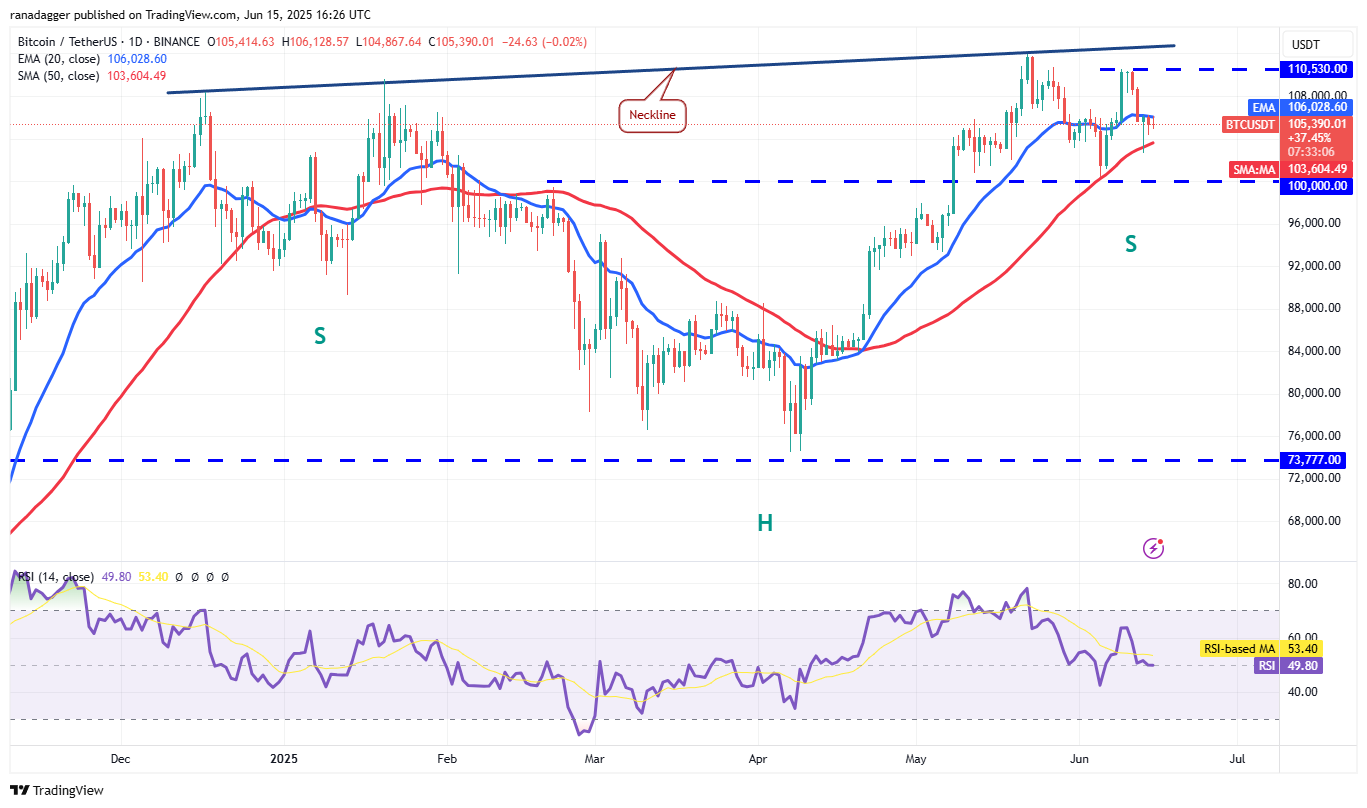
BTC/USDT Daily Chart. Source: TradingView
According to the BTC/USDT daily chart, the 20-day EMA is flattening, and the Relative Strength Index (RSI) hovers around the midpoint, offering no clear advantage to either bulls or bears. If buyers can push price above the 20-day EMA, the BTC/USDT pair may rise toward the $110,530–$111,980 range. Sellers are expected to fiercely defend this upper zone, but if bulls prevail, the pair could surge toward $130,000.
To the downside, a break below the 50-day SMA could challenge the critical psychological level of $100,000. A further breakdown may send the pair down to $93,000.
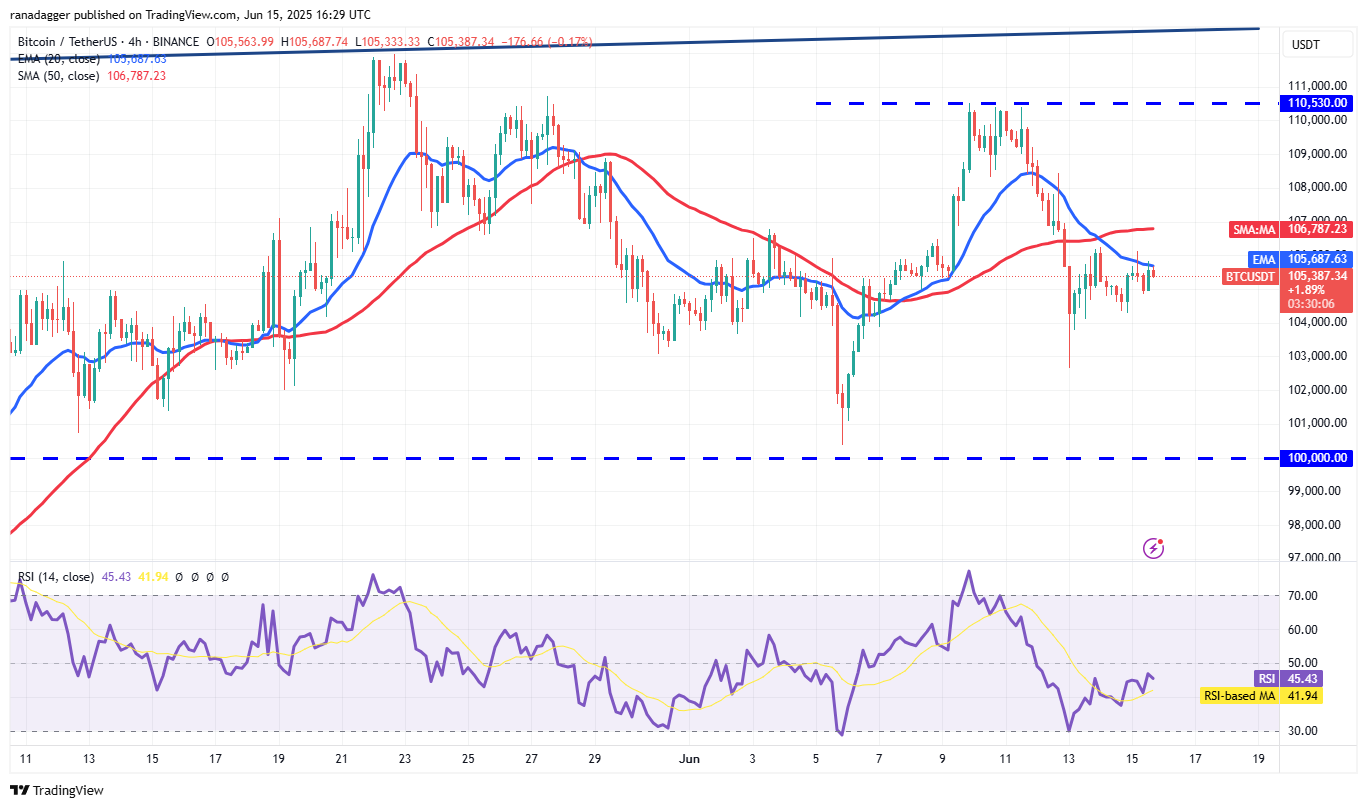
BTC/USDT 4-Hour Chart. Source: TradingView
Sellers are attempting to block a rebound at the 20-day EMA on the 4-hour chart. If price drops sharply below $104,000, short-term momentum will shift in favor of bears. The pair might fall to $102,664, then to $100,000. Buyers are expected to strongly defend the $100,000 level.
Bulls must push price above the 50-day SMA to regain control. Then, the pair could surge toward $110,530.
V. Future Path Scenarios: Summer Dormancy and Autumn Surge
1. June–August: Consolidation Phase
A Federal Reserve policy vacuum may confine Bitcoin to a range between $98,000 and $112,000. The key watchpoint is whether the July FOMC meeting delivers clear signals of rate cuts. Technically, the 200-day SMA (currently at $96,500) will serve as strong support. Pulse-like impacts from geopolitical tensions persist, but market depth indicators show that capital required per 1% price move has tripled compared to 2022 levels.
2. September–November: Main Uptrend Begins
Historical seasonality suggests October averages a 21.89% gain. Combined with potential first-rate cuts by the Fed, Bitcoin may begin its push toward $150,000. At that time, a peak in U.S. Treasury maturities ($6.5 trillion) could force the Fed to expand its balance sheet again, with secondary liquidity release acting as a powerful catalyst. Options markets already show heavy concentration in bullish calls expiring in December with strike prices at $140,000.
3. Risk Warning: Regulatory Gray Rhino
SEC enforcement actions against stablecoin issuer Paxos could trigger short-term volatility. However, in the long run, routine approvals of spot ETFs are expected to attract over $200 billion in traditional asset management funds. Investors should beware of a “Christmas correction” after a November rally; historical data shows average pullbacks of 18% during such phases in bull markets.
Conclusion: Bitcoin’s Role in the New Monetary Order
As gold nears $3,500, the U.S. yield curve remains inverted, and RMB cross-border settlement share surpasses the dollar, we are witnessing the most profound monetary revolution since the collapse of the Bretton Woods system. Within this transformation, Bitcoin plays a dual role: both beneficiary of eroding trust in the old system and builder of infrastructure for the new order. Its price stability no longer comes from reduced volatility, but from a reconstructed foundation of intrinsic value—evolving from a speculative symbol into a liquidity bridge connecting the real economy. Perhaps, as Ray Dalio of Bridgewater Associates put it: “In the long winter of fiat monetary restructuring, Bitcoin is proving itself the hardiest seedling.”
Join TechFlow official community to stay tuned
Telegram:https://t.me/TechFlowDaily
X (Twitter):https://x.com/TechFlowPost
X (Twitter) EN:https://x.com/BlockFlow_News