Six indicators explained: What will be the price of Bitcoin by the end of this year?
TechFlow Selected TechFlow Selected
Six indicators explained: What will be the price of Bitcoin by the end of this year?
Most indicators show strong growth, but still remain below the peak levels seen in previous cycles.
Author: ElonMoney Research
Translation: Felix, PANews
This analysis uses indicators such as MVRV Z-Score, Energy Value Oscillator, Bitcoin Heater, and historical data. Although historical data is a useful reference, its accuracy may be reduced in the current environment, as participants like Strategy, Metaplanet, and ETFs were not present during the 2021 cycle.
MVRV Z-Score
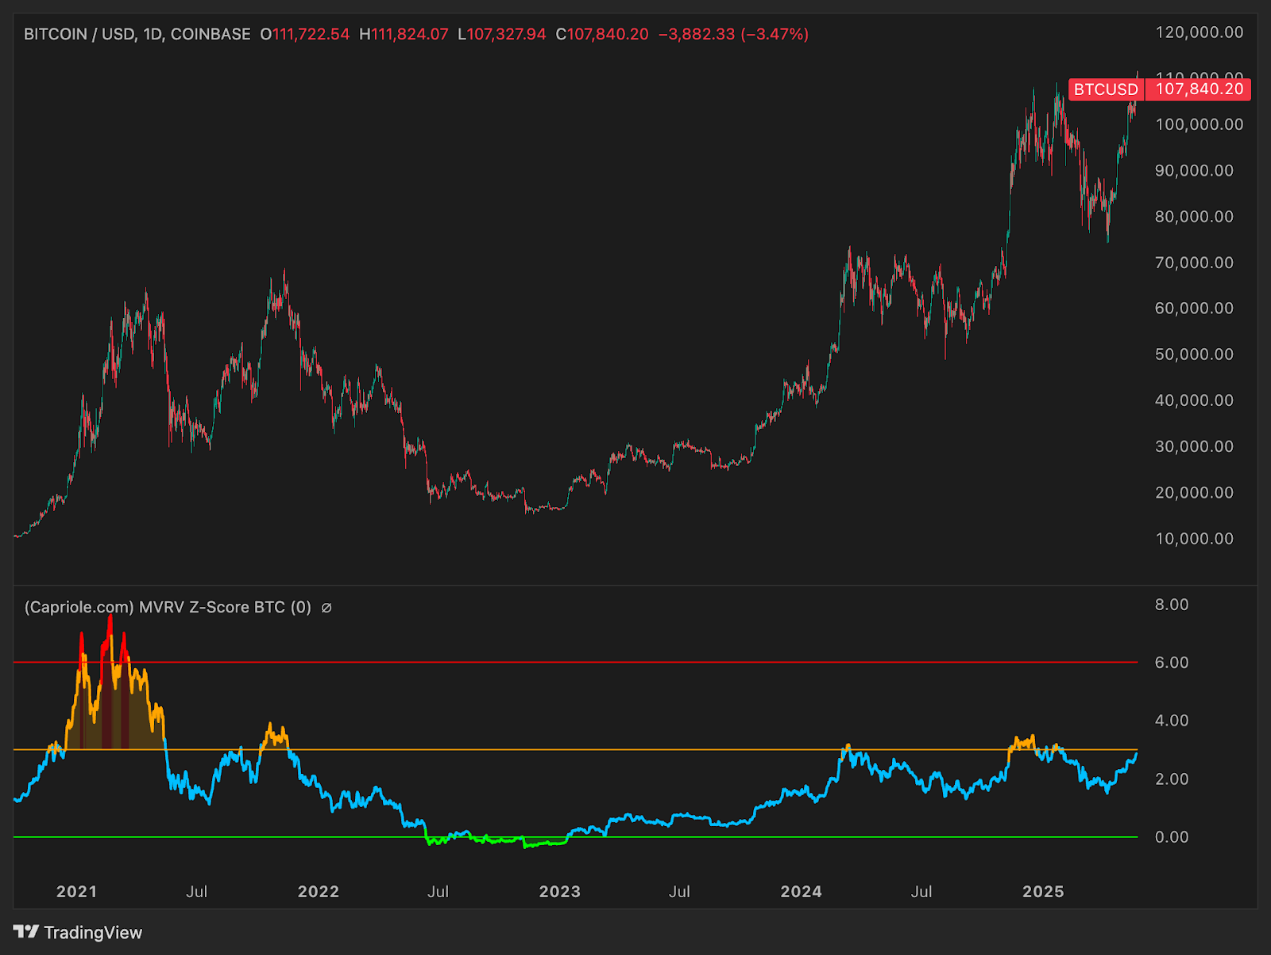
The MVRV Z-Score is a market valuation metric that identifies cyclical tops and bottoms by measuring how far an asset's price deviates from fair value when undervalued or overvalued. The chart shows the current MVRV Z-Score at approximately 2 to 3, within a neutral range and far from overheated levels typically seen at market peaks. Historically, Bitcoin cycle tops have pushed this indicator into the red zone (around 7 to 9), indicating a significant disconnect between market cap and realized cap. Currently, the indicator stands slightly above 2, in the blue/yellow zone, suggesting Bitcoin is not overvalued.
For context: In early 2021, the indicator exceeded 7 before Bitcoin reached about $60,000 to $65,000. During the 2022 bear market, it dropped below 0 (green zone), indicating oversold conditions.
From a technical standpoint, there remains substantial room for upside before the end of this cycle. Even if Bitcoin reaches around $100,000 to $110,000, it would still not be considered "expensive" by MVRV standards. If Bitcoin repeats past structural patterns at cycle peaks, the MVRV Z-Score could rise to 5–7 or higher.
This implies significant future upside potential. The baseline inference is that MVRV-based tops typically occur when BTC trades well above $100,000—possibly exceeding $200,000—depending on changes in realized cap over the coming months.
Energy Value Oscillator
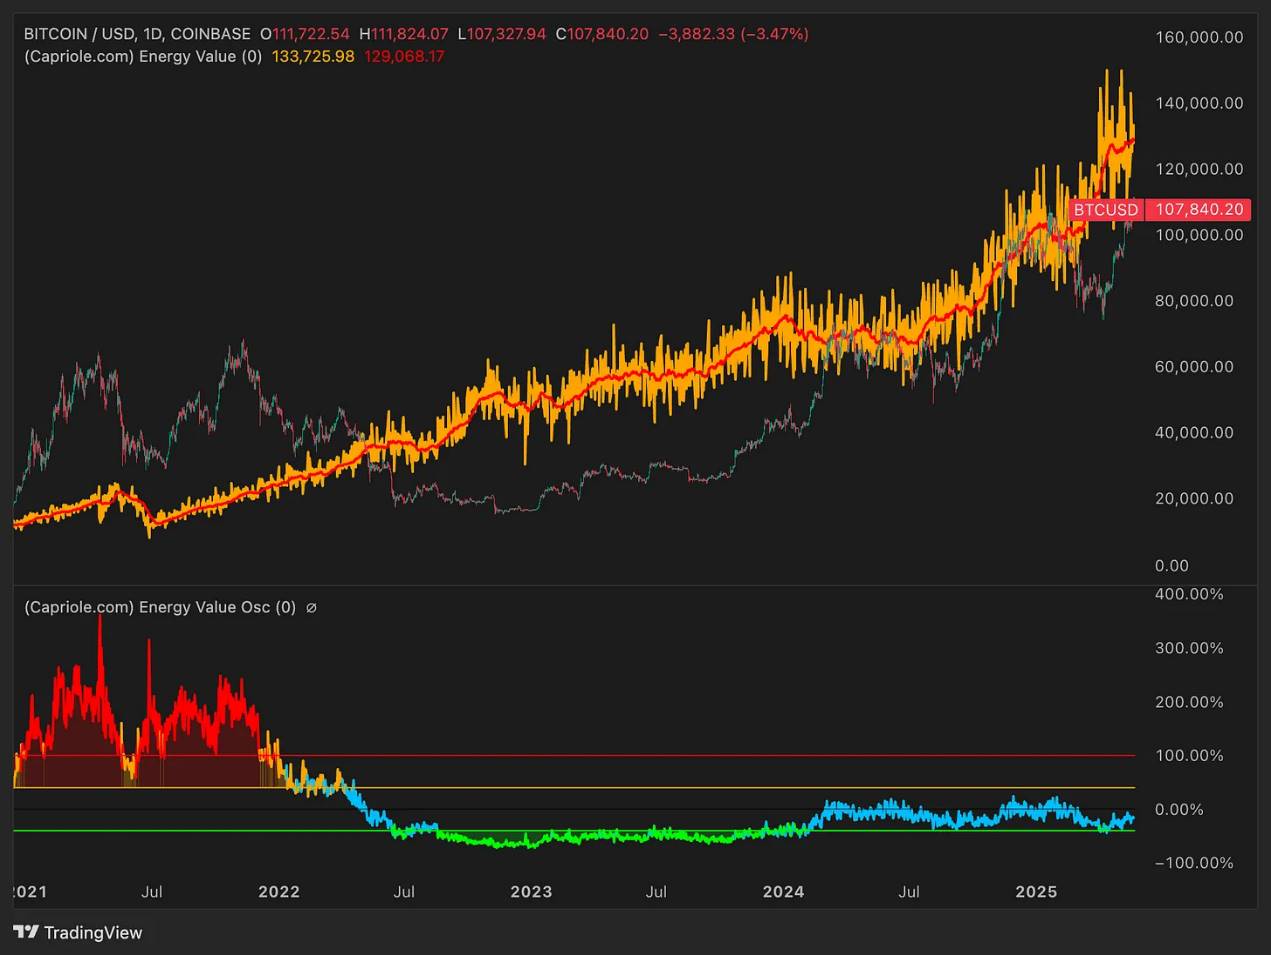
This indicator measures Bitcoin’s “fair value” based on total energy input (energy value = hash rate × energy efficiency). The orange-red line in the chart marks the energy-based fair value—at around $130,000 as of mid-2025. The blue oscillator below tracks the deviation of the current price from this benchmark.
Historically, when Bitcoin traded significantly above its energy value, the oscillator entered the red zone (over 100% overvaluation). In early 2021, with Bitcoin near $60,000, the price was more than 100% above its energy value. Conversely, in 2022, Bitcoin traded below its energy value, placing the oscillator in the green (undervalued) zone.
Currently, the oscillator hovers near zero, with Bitcoin trading at $107,000–$110,000—about 10%–20% below the model’s calculated fair value. This suggests Bitcoin is not overheated. If energy value reaches approximately $150,000 by late 2025 and prices trade at a 50%–100% premium (common near cycle peaks), this would imply a price range of $225,000–$300,000.
In other words: The Energy Value Oscillator confirms ample room for further upside. By this metric, the market is unlikely to be in an “extremely overvalued” state until the oscillator exceeds +100%.
Bitcoin Heater (Derivatives Overheating Indicator)
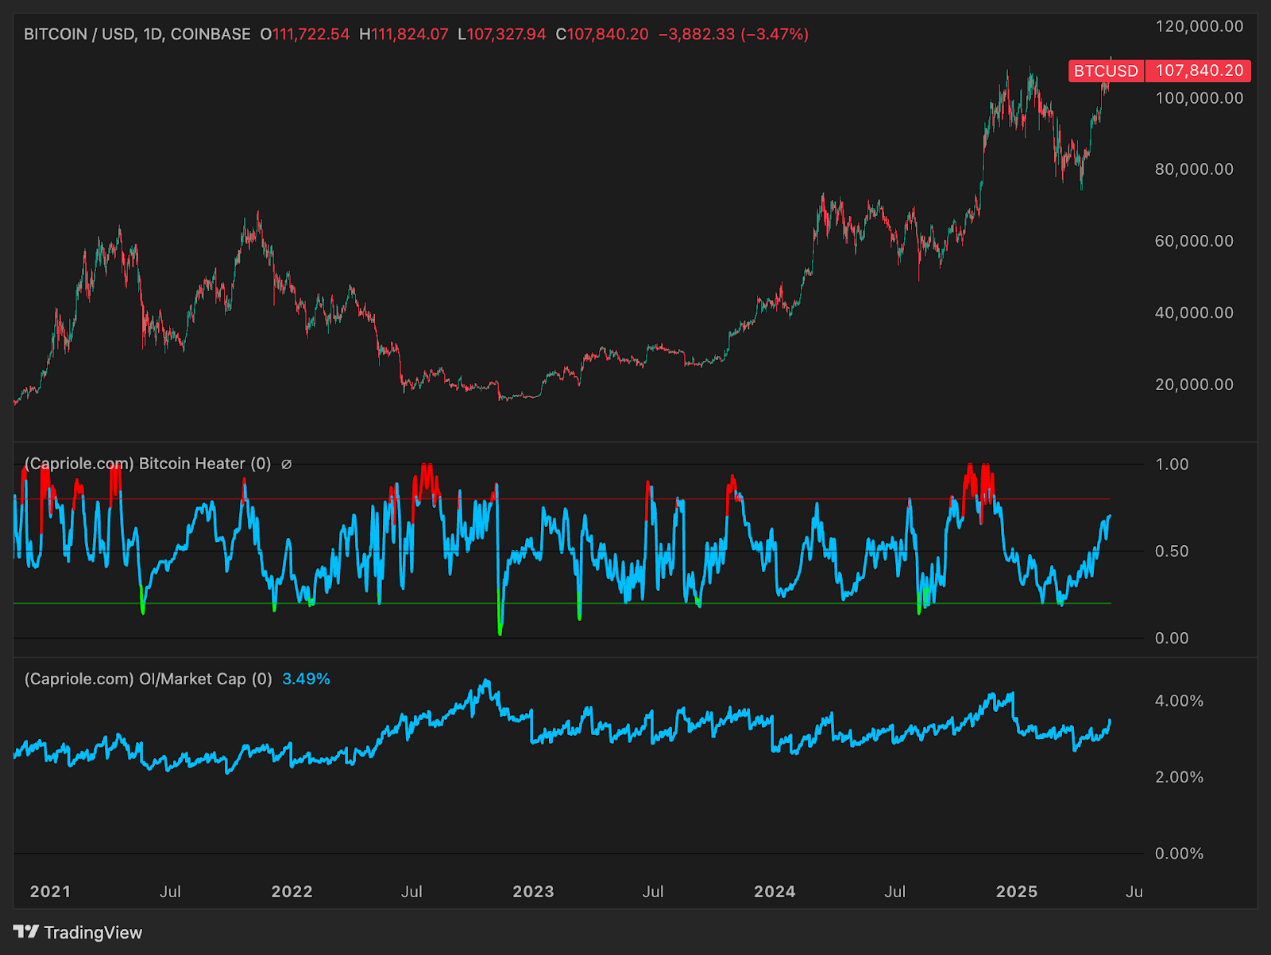
The Bitcoin Heater integrates derivatives sentiment (funding rates, basis, options skew) into a single index ranging from 0 to 1. Readings near 1.0 indicate bubbles, aggressive long positions, and high leverage. Values between 0.0 and 0.3 suggest cooling markets or risk-off sentiment.
In previous cycles—especially 2021—the indicator frequently broke above 0.8 ahead of local corrections. However, during strong bull phases (Q4 2020 to Q1 2021), it remained elevated without immediate reversal. As of mid-2025, the indicator stands at 0.6–0.7—warm but not yet overheated.
This indicates the euphoric final phase has not yet begun. In the last upward leg, the indicator may reach 0.8–1.0. Until then, room for growth remains. Periodic readings above 0.8 before topping are reasonable, but the ultimate peak will likely coincide with sustained red-zone readings.
Macro Index Oscillator
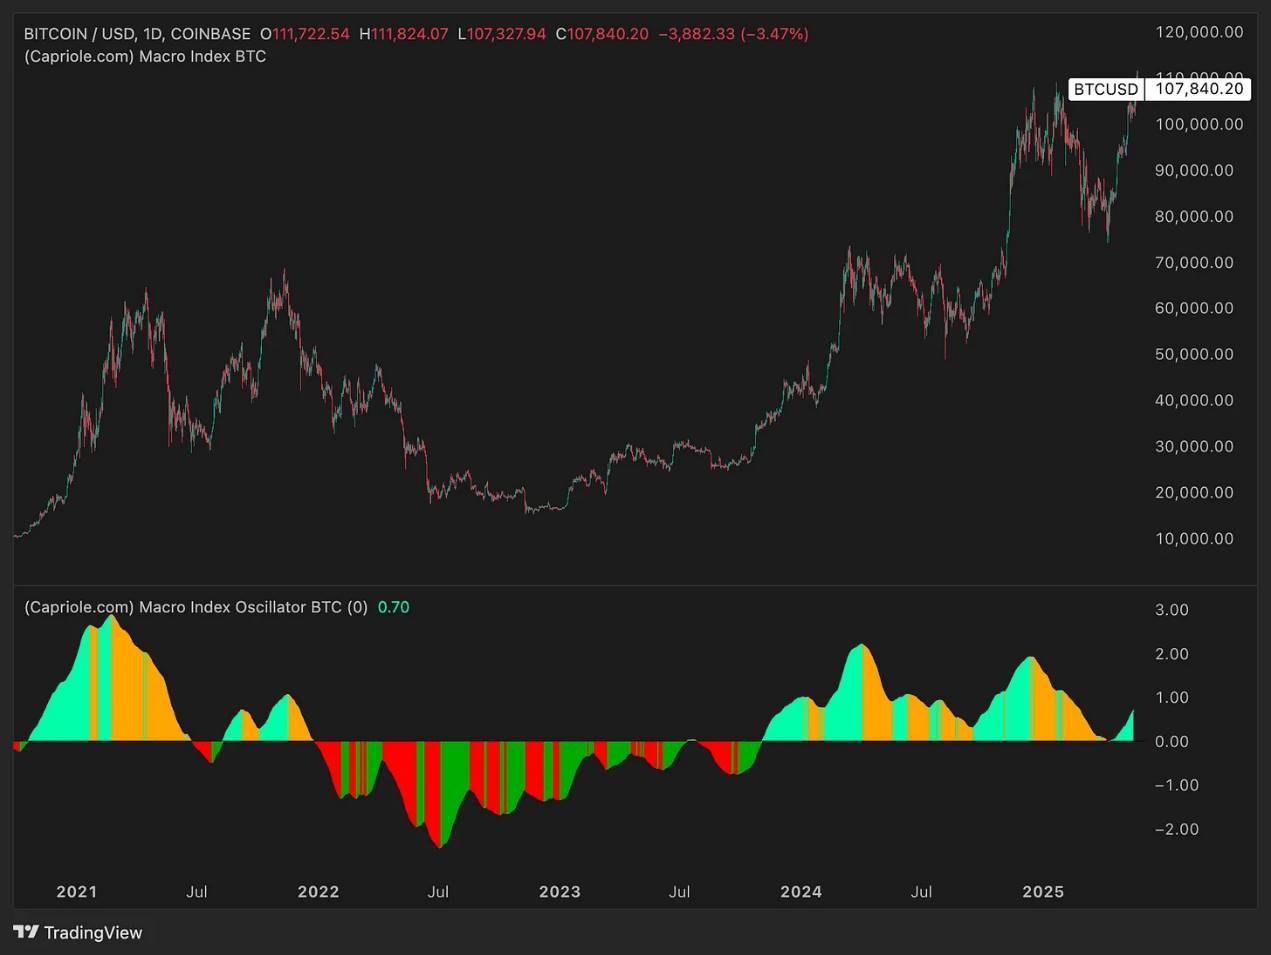
This composite index uses over 40 fundamental, on-chain, and market metrics to assess Bitcoin’s macro phase. Readings above 0 indicate expansion; below 0 indicate contraction or recovery.
In prior bull cycles, the index transitioned from negative to strongly positive territory—peaking near 2–3 in 2021. It fell below -1 at the 2022 bottom. As of now, the Macro Index stands at approximately +0.7—clearly in expansion mode but far from extreme euphoria.
This suggests the cycle may be in mid-expansion. The index is expected to climb above 2.0 by late 2025. Upside remains as long as core network activity shows no stagnation or reversal. No signs of weakness are evident yet.
Volume Summer (Liquidity / Participation)
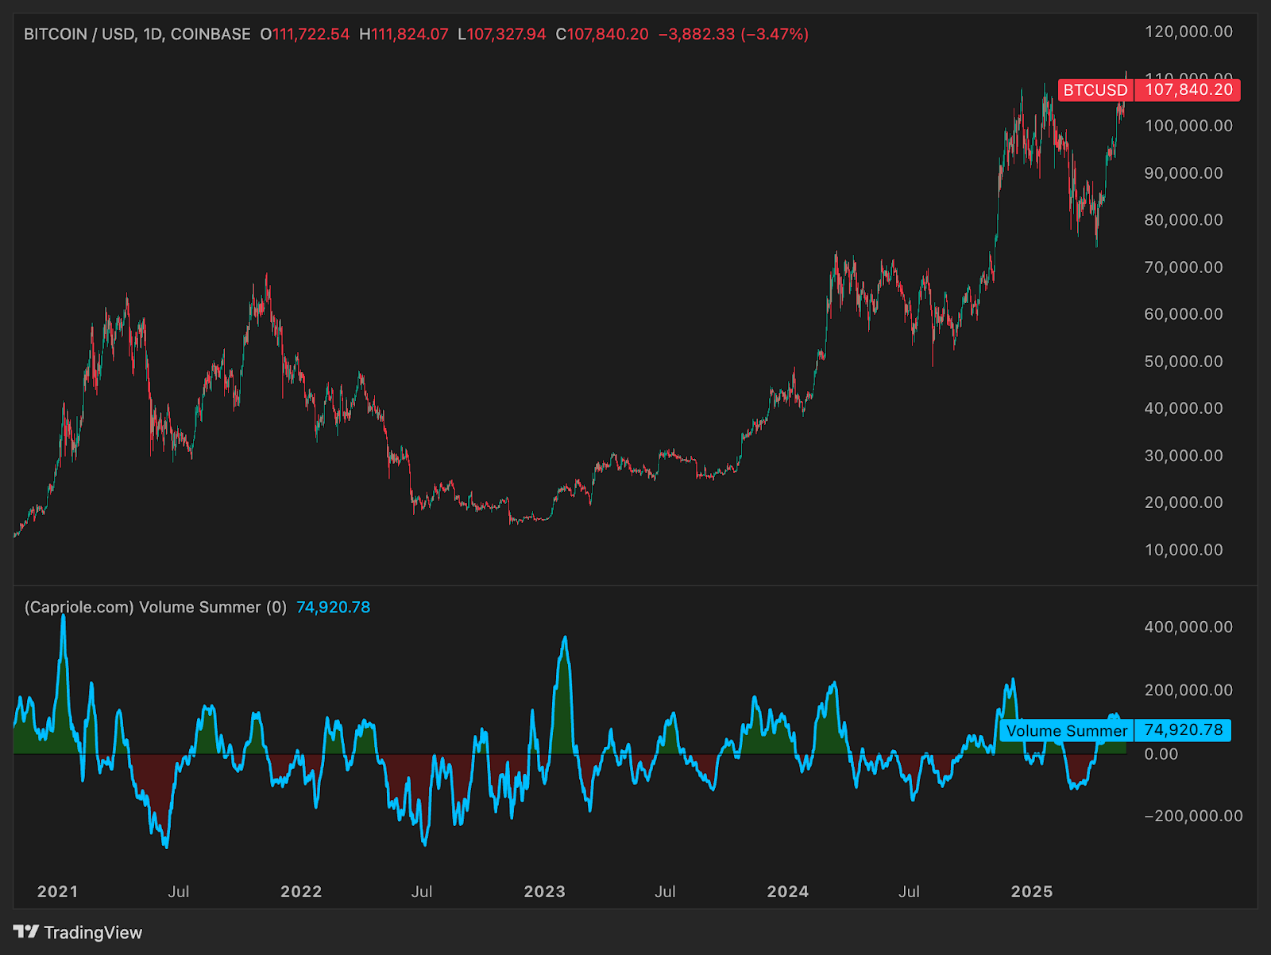
Volume Summer aggregates net buyer volume across spot and derivatives markets. Readings above zero indicate net inflows; below zero indicate net outflows or reduced trading activity.
In early 2021, the indicator surged into bright green—signaling retail FOMO and frenzied participation. In 2022, it plunged deep into red, confirming massive capital withdrawal.
Currently, Volume Summer is moderately positive (around +75,000)—bullish, but far from euphoric. This means capital is returning, but the liquidity peak may still lie ahead (Q4 2025?). A sharp surge into dark green would likely precede explosive price moves.
At current levels, liquidity provides support—but is far from peaking. More momentum remains for further gains.
Open Interest / Market Cap Ratio (OI/Mcap)
This indicator measures leverage relative to market cap. In 2021, it hovered around 2%–3%. In 2023, it spiked to ~4%, setting the stage for a mid-2024 correction. After the market crash, it reset to 2%, clearing excess leverage.
As of mid-2025, it has rebounded to ~3.5%, indicating rising leverage. While supportive of short-term price gains (adding fuel to the rally), it also increases risk. If the ratio climbs to 4%–5%+ by year-end, it could signal a crowded, unstable market prone to sell-offs.
The final phase of this cycle may feature record leverage—with the indicator hitting new highs as prices top. For now, however, there remains room for further increase.
Potential BTC Price Movement by December This Year
Combining all indicators, BTC appears to be in the core phase of a bull cycle, but far from its end.
There are currently no extreme overvaluation signals. Most metrics show strong growth but remain below historical peak-cycle levels.
Therefore, the base-case forecast is for BTC to reach $210,000–$230,000 by the end of 2025—more than double current levels.
Based on these valuations, we expect:
-
MVRV Z-Score > 7
-
Energy Value Oscillator > +100%
-
Bitcoin Heater approaching 1.0
-
Volume Summer in the euphoric range
-
OI/Mcap at historical extremes
Only then might the market transition from expansion to distribution.
Join TechFlow official community to stay tuned
Telegram:https://t.me/TechFlowDaily
X (Twitter):https://x.com/TechFlowPost
X (Twitter) EN:https://x.com/BlockFlow_News