Bitcoin hits new all-time high again, will the bull cycle repeat?
TechFlow Selected TechFlow Selected
Bitcoin hits new all-time high again, will the bull cycle repeat?
Perhaps the answer lies within the veins of data.
By ChandlerZ, Foresight News
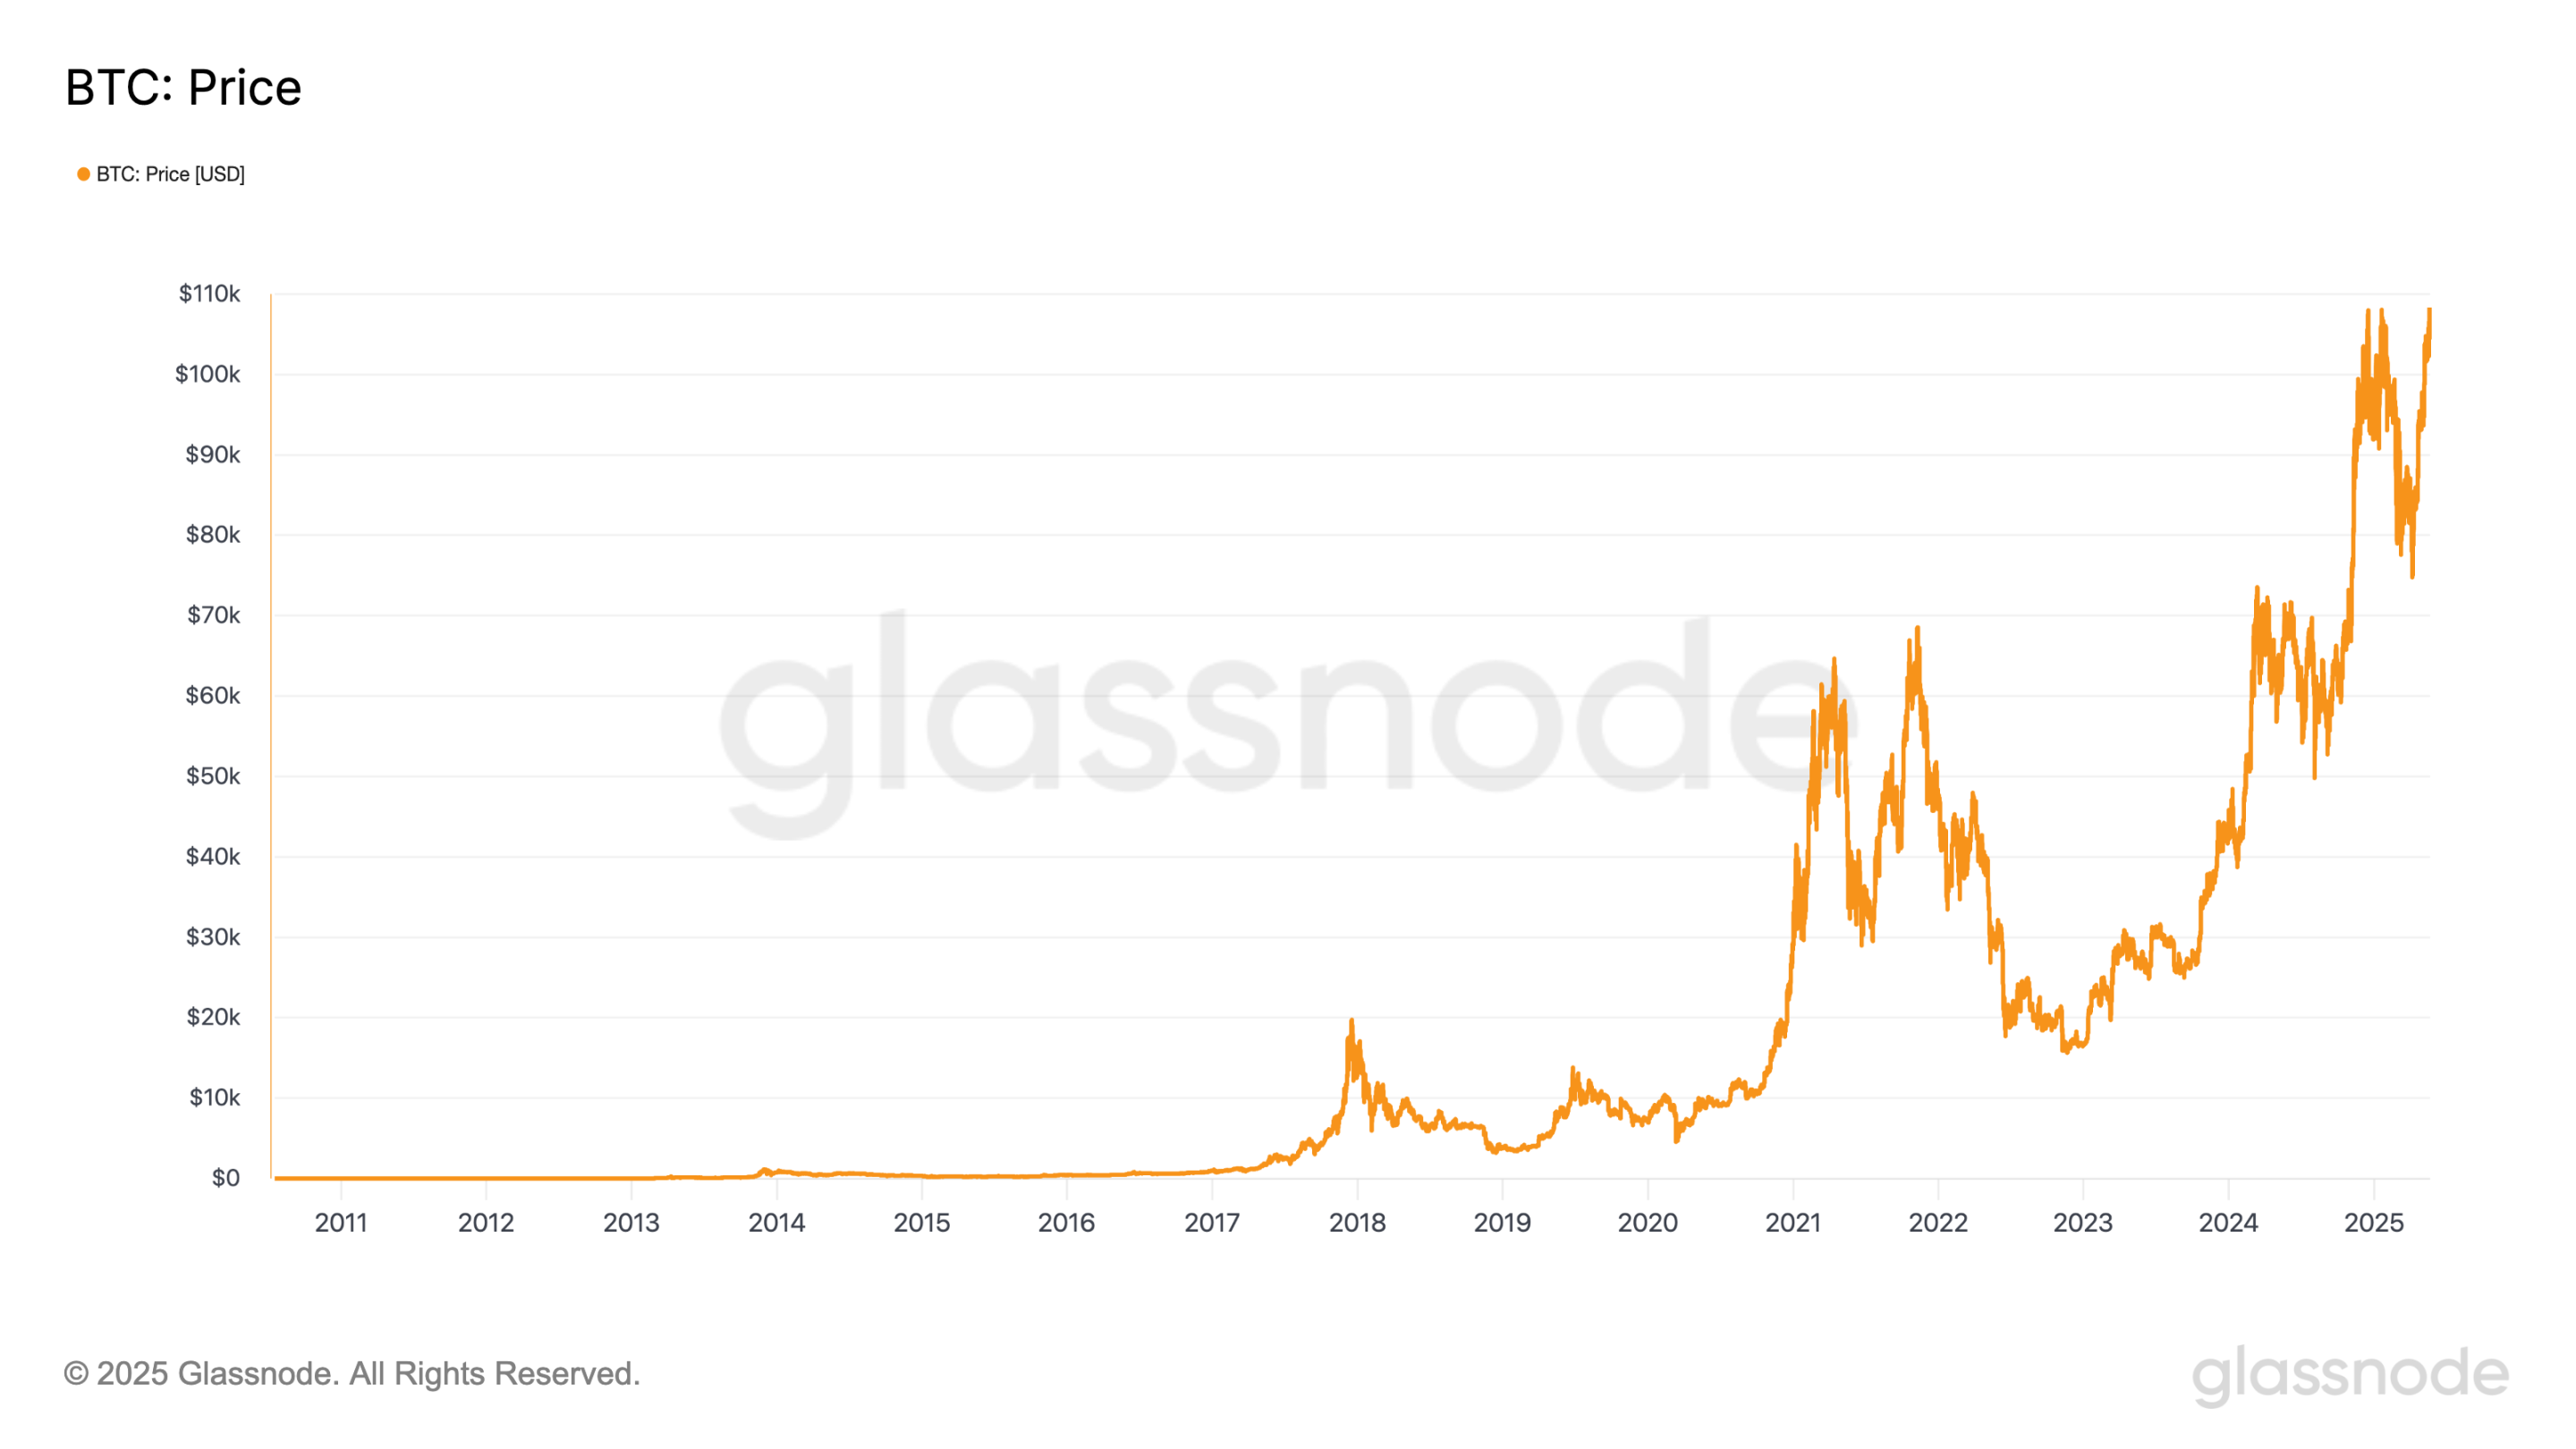
On May 22, 2025, Bitcoin's price surged past 110,000 USDT, surpassing its previous all-time high of 109,599 USDT set on January 20. This moment feels eerily reminiscent of November 2021, when Bitcoin briefly exceeded its yearly peak before rapidly retreating, ushering in a long and severe bear market. Now, the market appears to stand once again at a pivotal crossroads: will it break through decisively and open a new upward trajectory, or repeat history by forming a double top after a "false breakout," ultimately leading to a deep correction?
This is a question that inevitably arises every time Bitcoin approaches its historical highs. Across previous bull cycles, we've repeatedly seen similar patterns: euphoria builds, sentiment runs hot, and debates intensify over whether the cycle’s peak has already arrived. While this current rally shares a familiar rhythm and momentum, deeper structural changes in the market are now evident.
The price may be repeating history, but the market is no longer the same. In this context, should we continue to believe that the "halving-driven cycle" still governs Bitcoin's fate? Or must we acknowledge that a new rhythm is quietly emerging—one shaped by ETF flows, on-chain dynamics, and evolving macro narratives?
Returning to fundamental analytical methods, perhaps on-chain data, historical parallels, and behavioral traces can still offer cyclical insights. Is this current surge merely the final sprint of cyclical inertia, or does it mark a new starting point following a restructured cycle? The answer may lie within the data itself.
Is the Market Repeating Its Past Path?
Bitcoin’s historical price movements, though highly volatile, generally follow a recurring pattern of "halving-driven bull-bear cycles."

Since 2011, Bitcoin’s price evolution has consistently followed the logic of "halving → supply-demand imbalance → bull market explosion → top formation and pullback." Each cycle ends with a higher peak than the last. Notably, the 2021 double-top structure stands out as a cautionary tale.
In April 2021, Bitcoin reached its first significant peak, fueled by Coinbase’s public listing, continued loose monetary policy, and sustained accumulation by Grayscale’s GBTC. Sentiment soared as prices broke above $60,000 for the first time. However, this high didn’t last. By May, as the Federal Reserve signaled tapering and rate hikes, coupled with China’s sweeping crackdown on domestic mining operations, Bitcoin quickly entered a correction phase, plunging to around $30,000 within three months—completing a deep mid-cycle drawdown.
Several months later, during the summer, negative sentiment gradually dissipated, and the market bottomed out and rebounded. Positive narratives such as El Salvador adopting Bitcoin as legal tender, growing inflation concerns prompting some investors to view Bitcoin as a potential hedge, and strong optimism surrounding the approval of the first U.S. Bitcoin futures ETF—all contributed to renewed capital inflows and bullish momentum. On November 10, Bitcoin briefly spiked above $69,000, its then-all-time high, before rapidly reversing. Together with the April peak, this formed a clear, months-spanning "double top" pattern.
Ultimately, the confluence of price making a new high, intense on-chain profit-taking activity, and weakening demand created a classic "false breakout" scenario. After a brief overshoot, Bitcoin swiftly reversed course, initiating a prolonged downtrend. Technically, this pattern exhibited a "local new high + volume divergence + sharp reversal"—a textbook double-top signal—and serves as a critical reference point today, as Bitcoin once again nears its historical highs.
Will History Converge Again?
The current price trajectory bears a striking resemblance to the period just before November 2021. More importantly, multiple on-chain indicators are now showing signs of structural convergence.
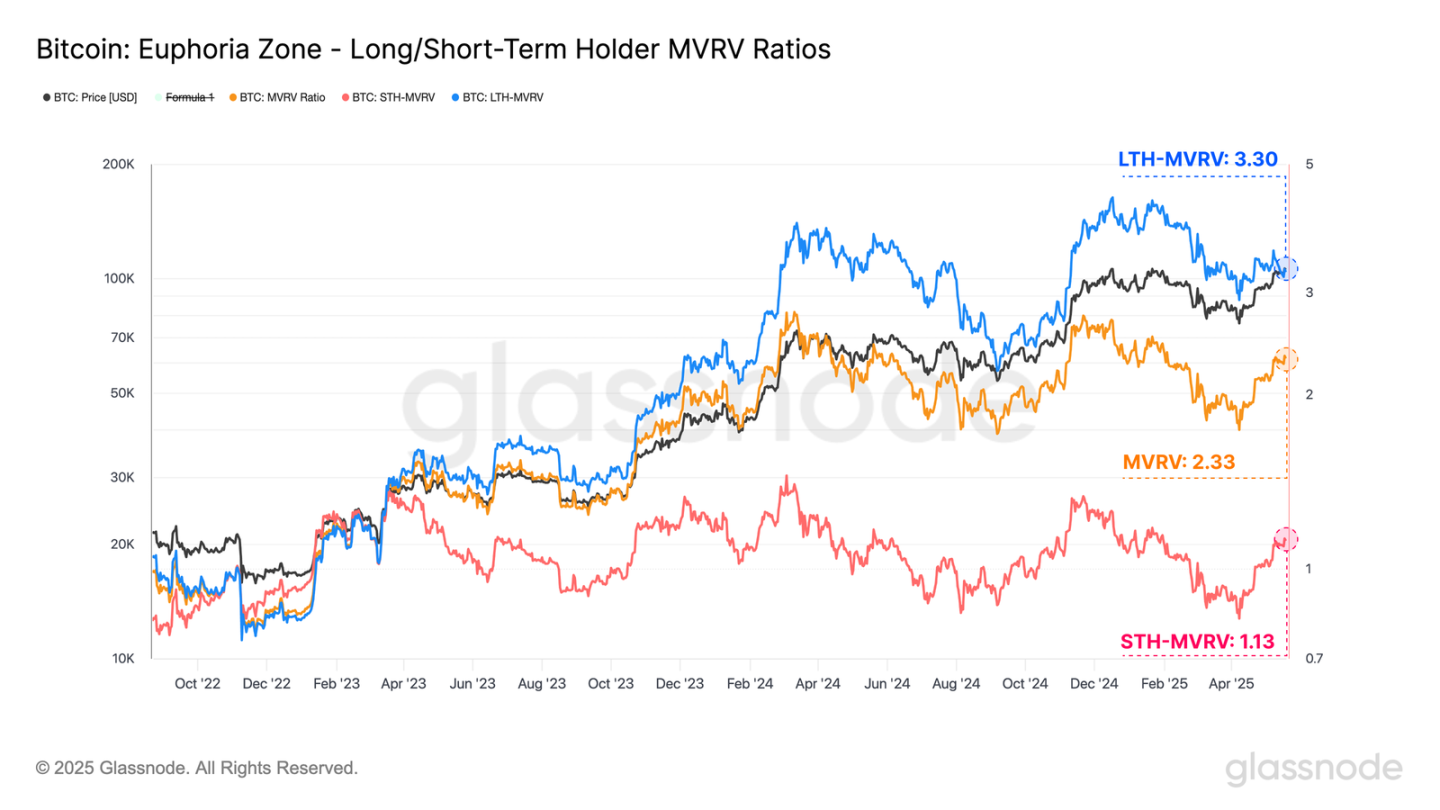
Recent data shows that the MVRV ratio for long-term holders has risen to 3.3, approaching Glassnode’s defined "greed red zone" (above 3.5). Meanwhile, the short-term holder MVRV has climbed significantly from its low of 0.82 to 1.13, indicating that most short-term positions have returned to profitability. From a behavioral finance perspective, this shift creates the necessary conditions for topping pressure: when the majority of investors are back in profit, the desire to take profits tends to rise in tandem.
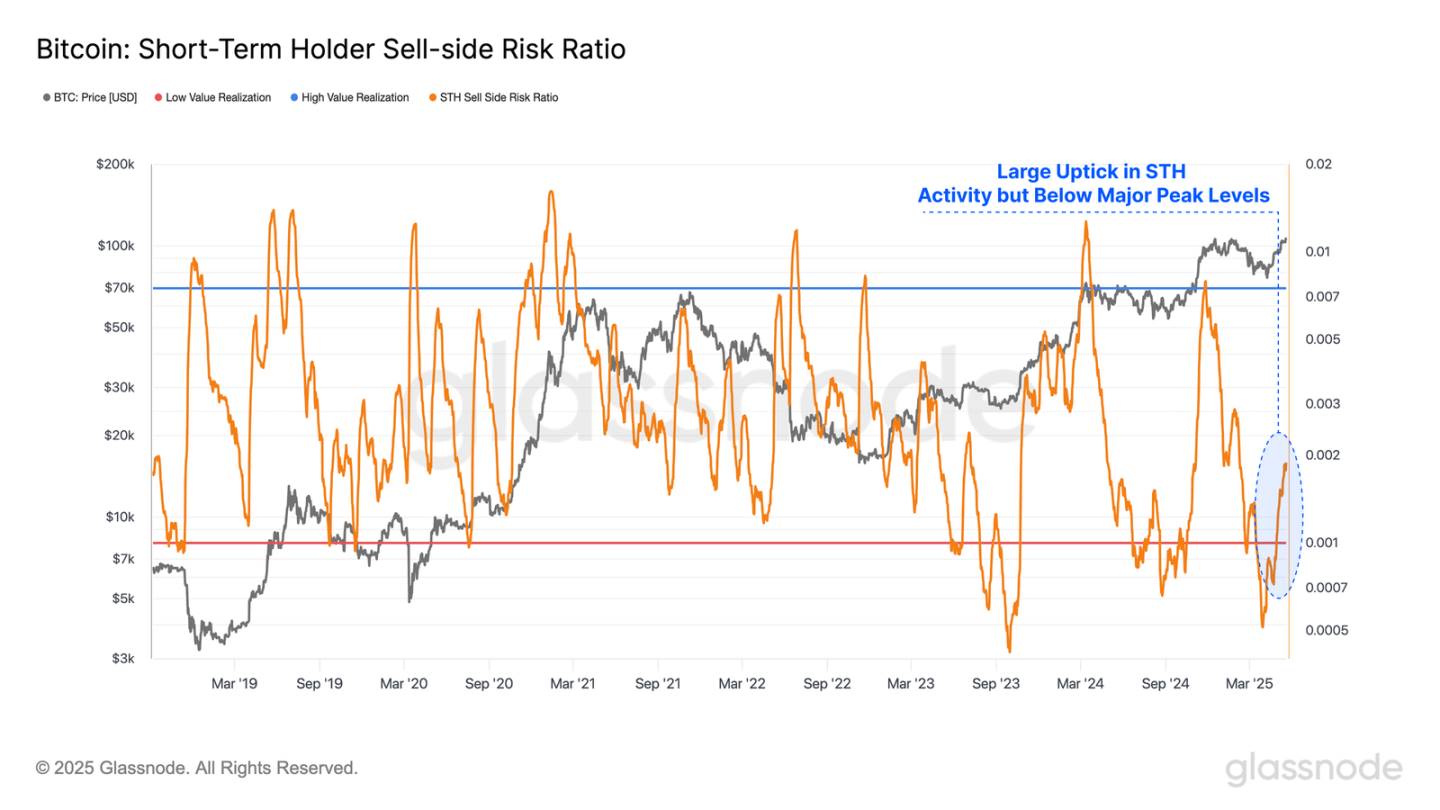
However, analyzing from the lens of "seller-side pressure" on-chain, while the sell-side risk ratio for short-term investors has notably increased—indicating some profit realization—the overall level remains historically moderate to low. This suggests that although investor sentiment has warmed and some traders are locking in gains during profitable phases, the broader market has not yet entered an imbalance dominated by widespread, coordinated profit-taking.
This implies that while upside momentum faces initial resistance, the market remains under control. As long as liquidity remains stable, the structural conditions for continued upward movement still exist—meaning the market hasn't necessarily reached its ultimate peak.
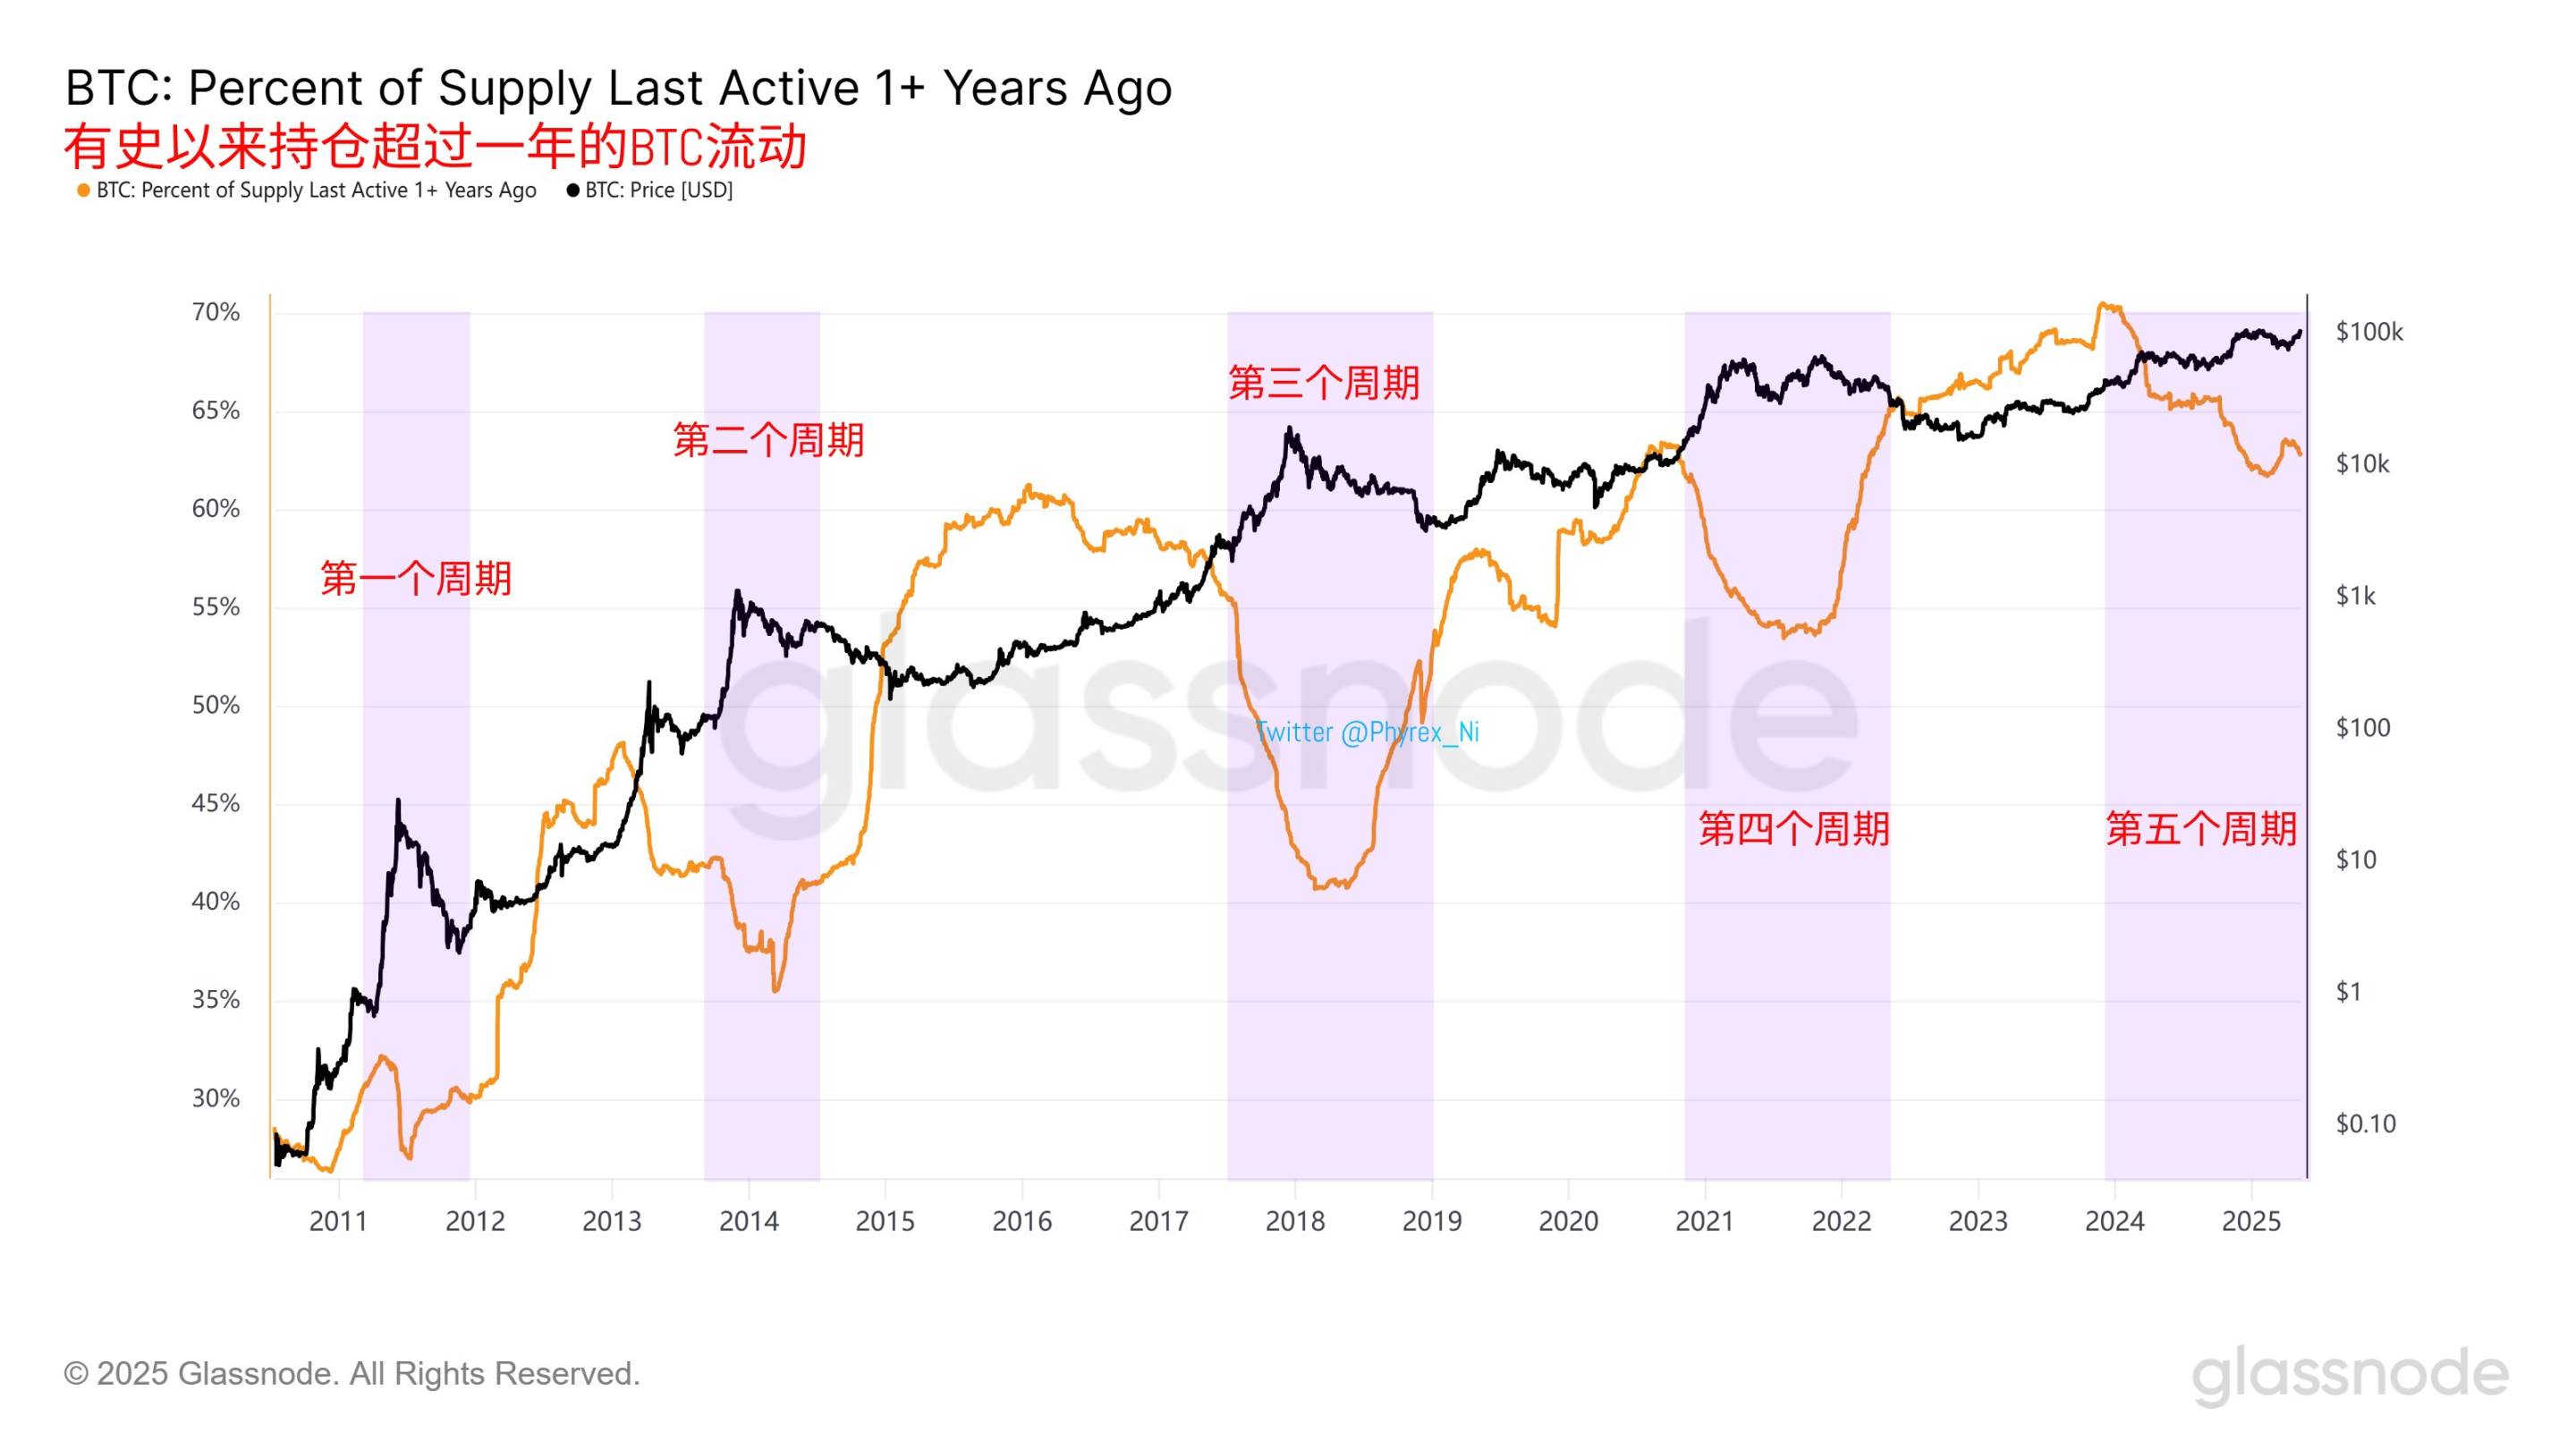
Overall, long-term holder behavior has historically been the most reliable slow-variable signal for identifying Bitcoin cycle turns. Whether in 2013, 2017, or 2021, the end of every major bull market coincided almost exactly with concentrated distribution by these holders, while new bull cycles typically began with their renewed accumulation.
We are now in Bitcoin’s fifth major cycle. If long-term holders have not yet begun a new phase of position rebuilding, this could indicate that the market is still within a top-formation zone—or possibly constructing another double-top pattern at elevated levels.
What Lies Ahead?
According to the calculation method proposed by on-chain analyst @Murphychen, using Bitcoin’s MVRV ratio to assess market conditions is effective because MVRV fundamentally reflects the relationship between capital and cost.
Over the past decade, Bitcoin has consistently followed a principle of large-scale divergence between MVRV and spot price: whenever price reaches a new high while MVRV registers lower than before, the indicator fails to surpass its prior peak, and subsequent price expansion becomes constrained.
The underlying logic is that as turnover costs rise, pushing prices higher requires exponentially greater capital inflows.
In this cycle, the highest MVRV peak occurred on March 11, 2024, when Bitcoin was priced at $72,000 with an MVRV of 2.78. Since then, despite new price highs on December 17 and January 21, the MVRV ratio has failed to exceed 2.78.
Therefore, for Bitcoin to truly embark on a journey toward unprecedented highs, the first and most crucial step is to break this large-scale MVRV divergence. Based on current dynamic RP values, this would require Bitcoin’s price to surpass $125,500.
Join TechFlow official community to stay tuned
Telegram:https://t.me/TechFlowDaily
X (Twitter):https://x.com/TechFlowPost
X (Twitter) EN:https://x.com/BlockFlow_News