
On the Eve of a Storm? Bitcoin Shows a "Doji," with Bulls and Bears in a Deadlock
TechFlow Selected TechFlow Selected
On the Eve of a Storm? Bitcoin Shows a "Doji," with Bulls and Bears in a Deadlock
The market is extremely hesitant and may experience significant volatility.
Author: BitpushNews
Recently, the market has been locked in a tug-of-war, with BTC bulls and bears battling between $100,000 and $96,000. Over the past week, there has been a sharp pullback, briefly breaking below the $91,000 support level. The volatility indicates rising investor anxiety over short-term price movements.
Long-Term Holder Activity and Market Signals
On February 9, renowned analyst Maartunn shared a set of on-chain data showing that 14,000 bitcoins with a history of 7 to 10 years had moved on-chain.
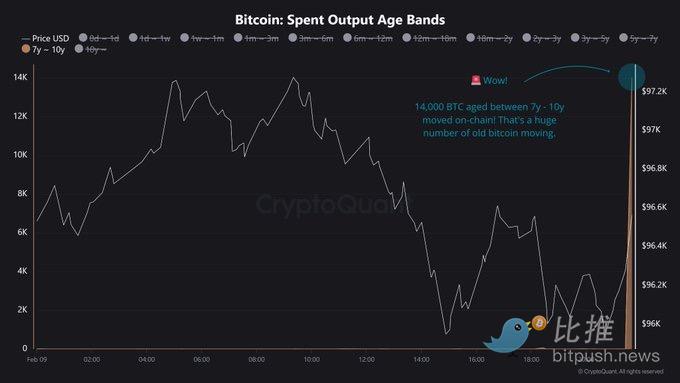
The re-entry of such long-dormant bitcoins into circulation is typically seen as a significant signal. These movements may indicate various motivations—long-term holders preparing for a potential rally, institutions rebalancing positions, or market participants concerned about sustained selling pressure. Regardless, the activation of such a large volume of old bitcoins usually signals an impending period of intense price volatility. While such activity is not uncommon during market consolidation, it adds further uncertainty to current market sentiment.
In addition, analyst DOM identified an unprecedented "Doji" pattern on Bitcoin’s daily chart. This formation often signifies market indecision, similar to the trend following the FTX collapse in November 2022.
DOM stated: "In Bitcoin’s 15-year history, this is the first time we’ve seen three consecutive 'extreme Doji' candles, each with a body representing less than 0.05% of the candle’s total range. This reflects extreme market hesitation and suggests a major price move is imminent."
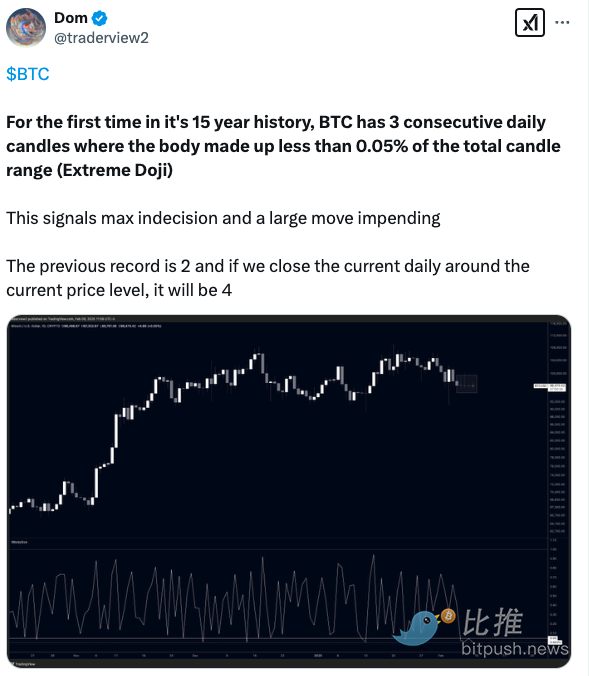
Notably, in November 2022, Bitcoin saw two consecutive "extreme Doji" candles, followed by a 620% price surge. If history repeats, Bitcoin may be on the verge of another explosive price movement.
Key Price Levels and Technical Analysis
TradingView data shows Bitcoin currently hovering around $97,600. Analyst Sebastian believes that to reignite bullish momentum, Bitcoin must first stabilize above the critical $98,000 level, which would lay the foundation for breaking the psychological $100,000 barrier. A successful breakout and hold above $100,000 would confirm a strong return of bullish momentum and could open the door to higher supply zones, triggering a new upward leg.
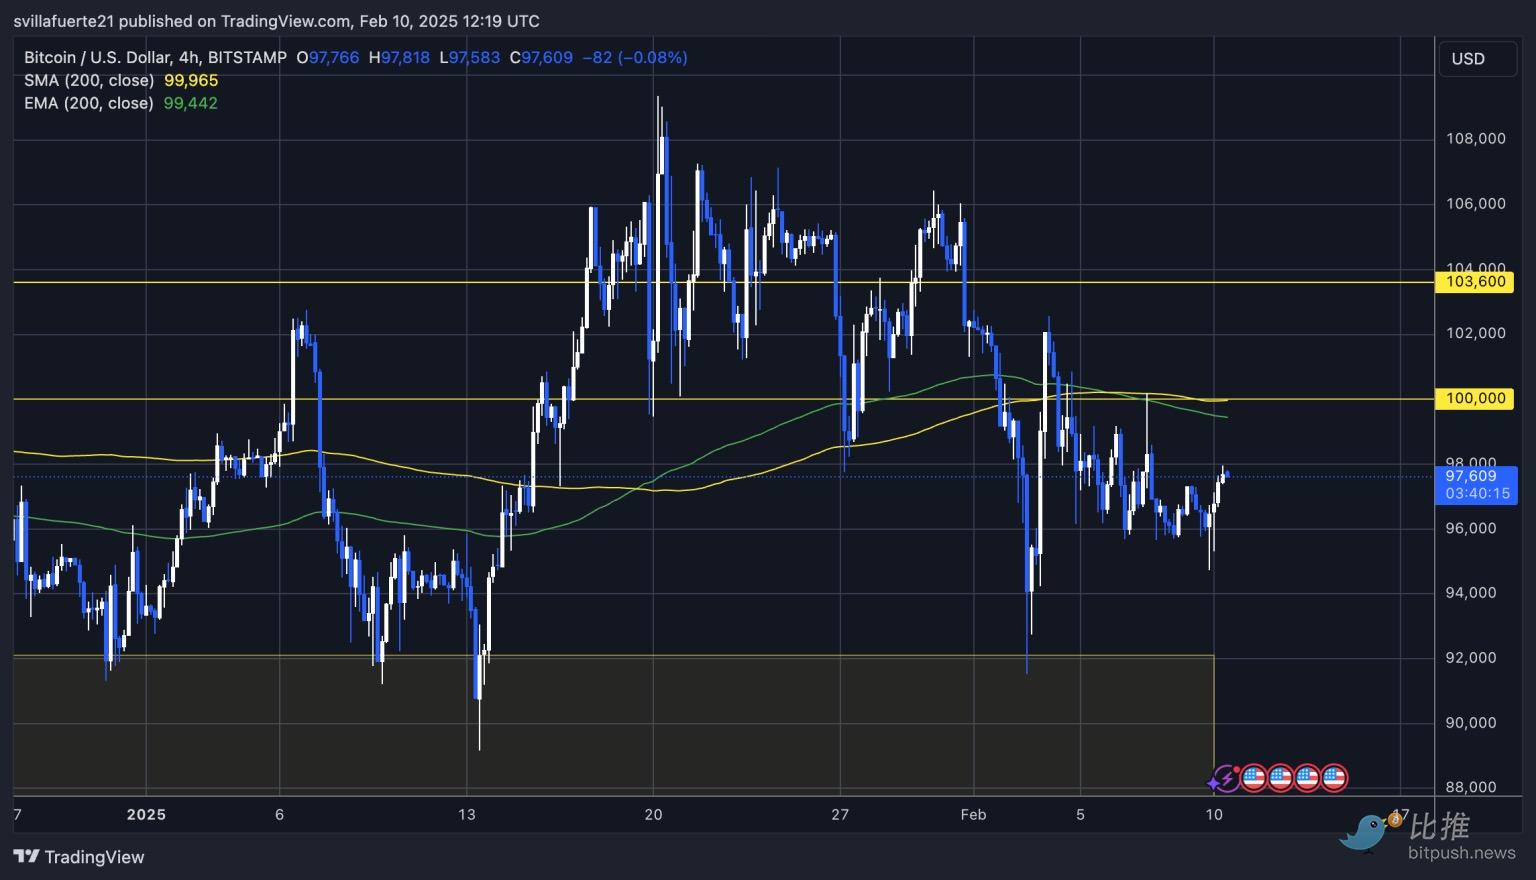
However, the current demand zone between $96,000 and $97,000 must hold to provide support for a potential rally. If this range is lost, it could trigger additional selling pressure. In such a scenario, Bitcoin might fall below $95,000 and test the demand zone near $90,000. Such a move would severely damage market sentiment and reinforce bearish expectations.
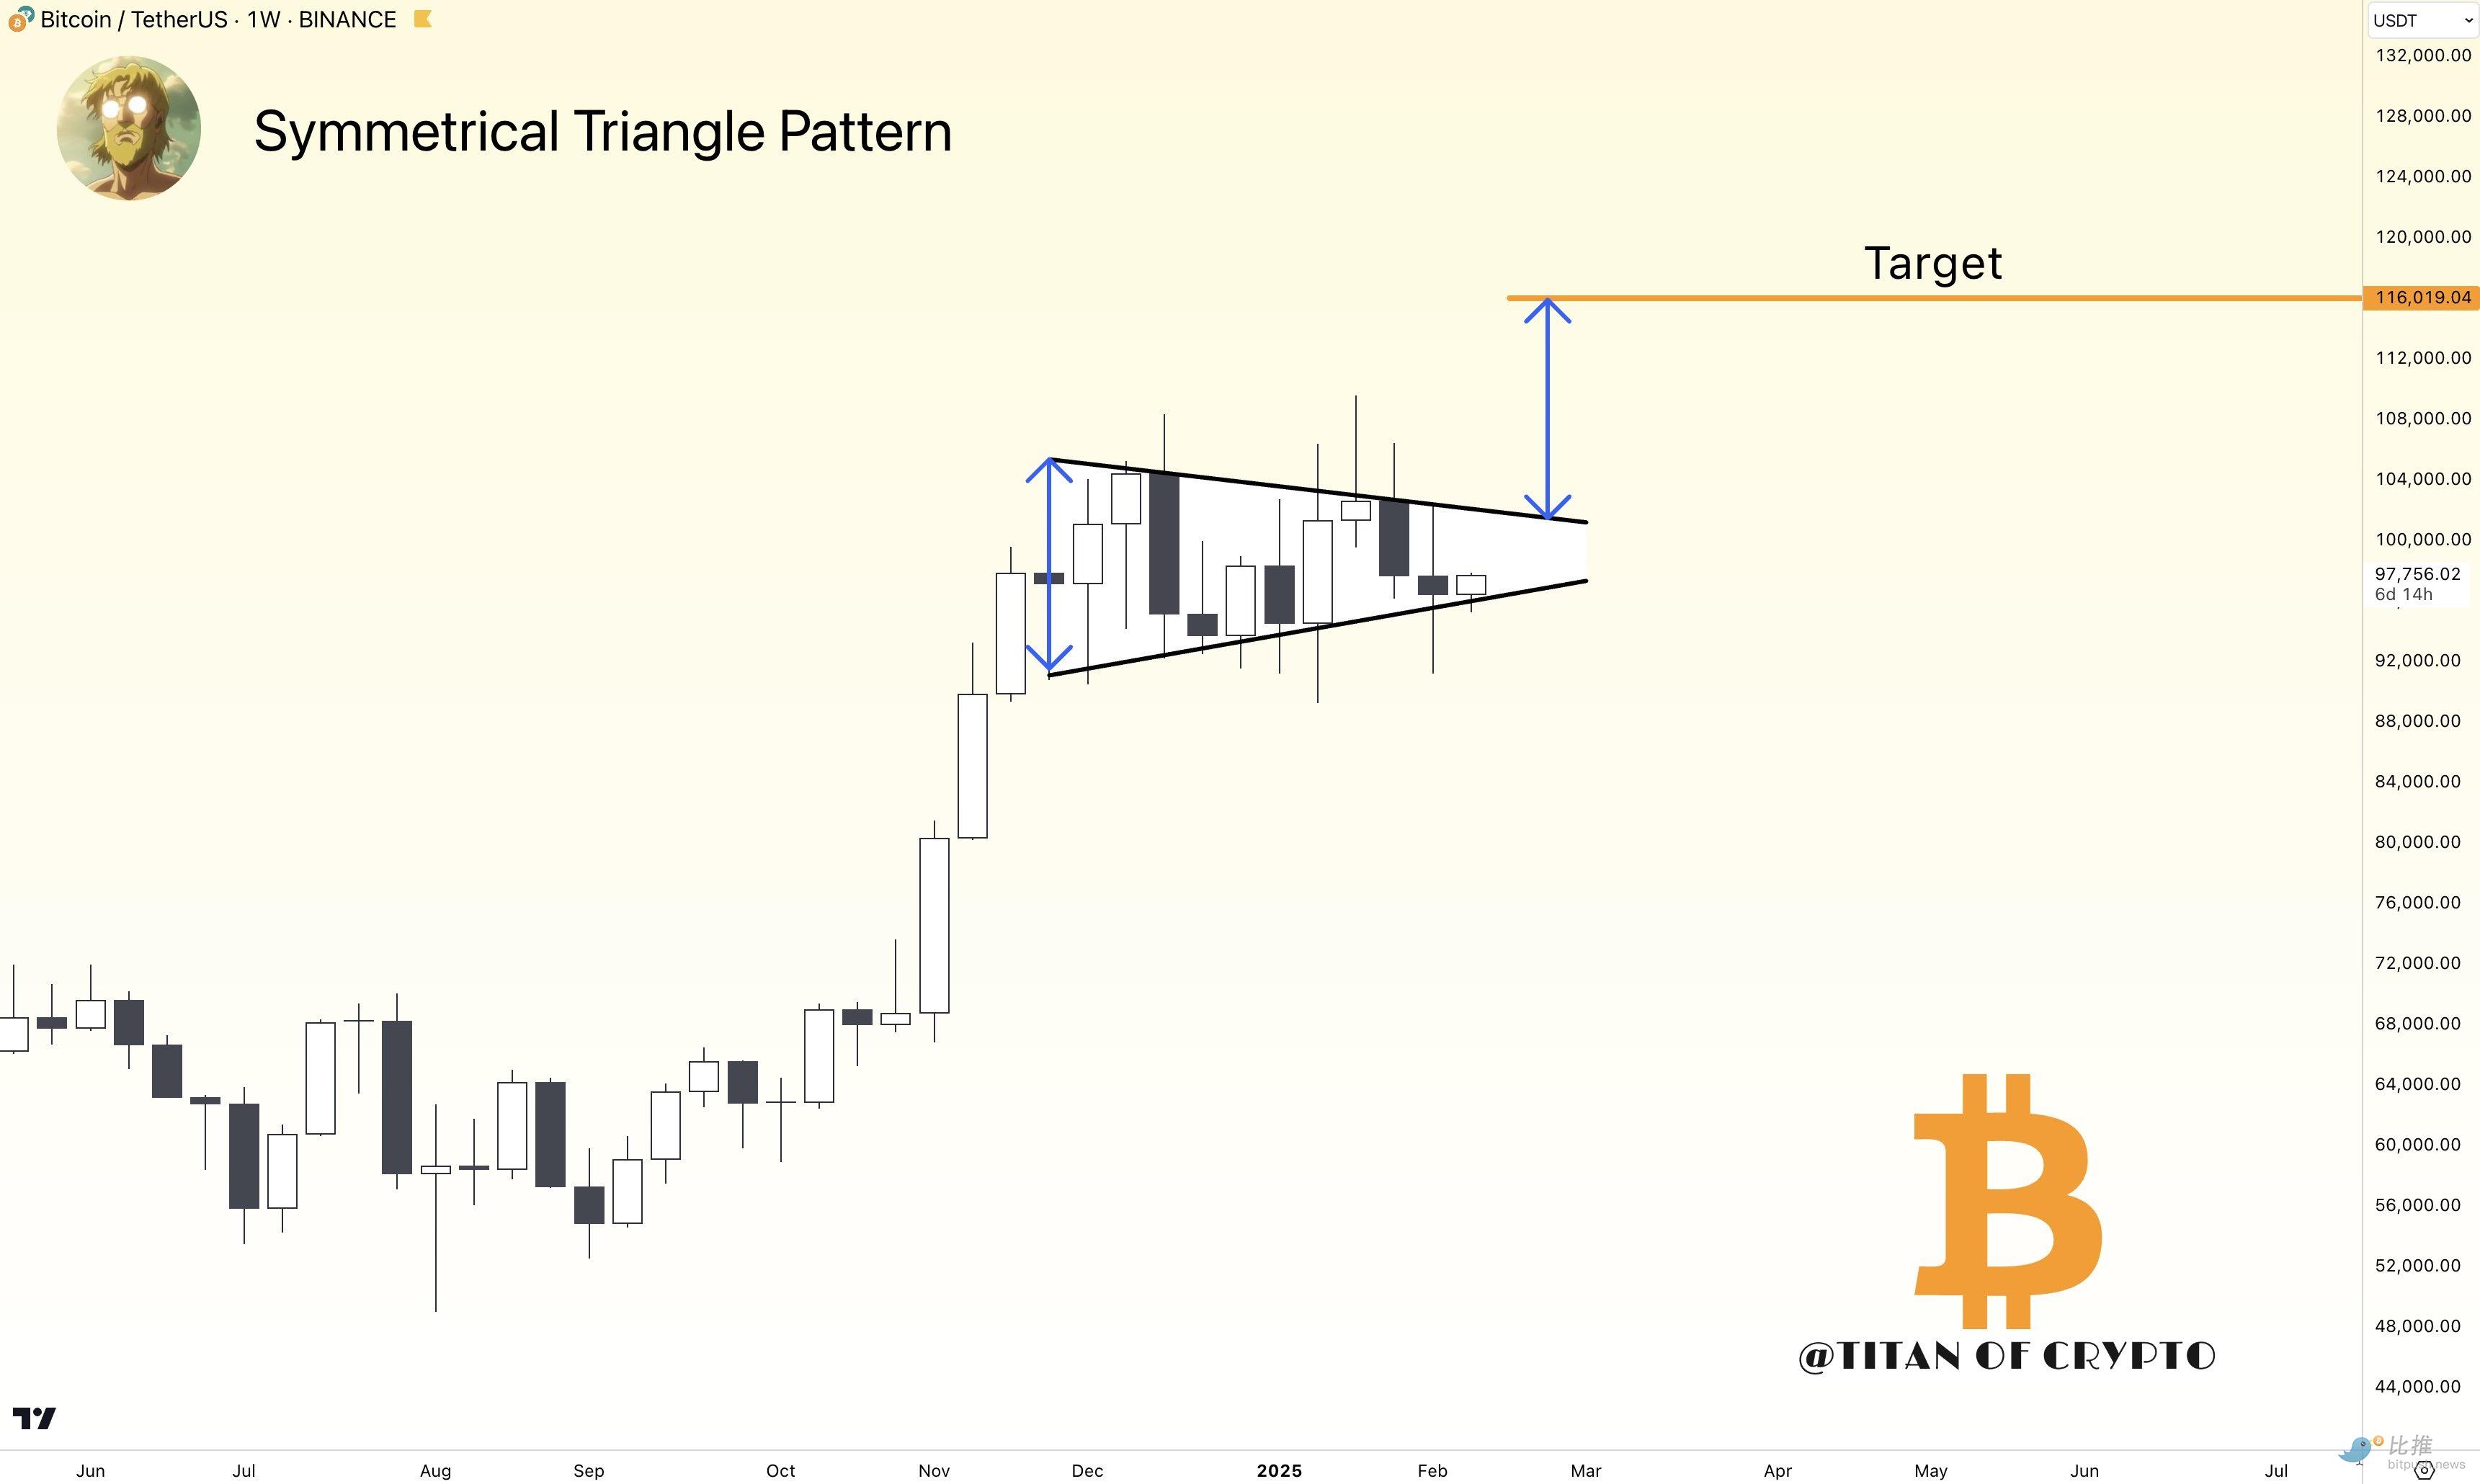
Bitcoin has recently formed a symmetrical triangle pattern, a technical formation that typically precedes a significant price breakout.
Market analyst Titan of Crypto noted that Bitcoin could break above the upper trendline of the triangle and eventually reach a target of $116,000. According to technical analysis principles, the upside target is calculated by adding the maximum vertical distance between the triangle's upper and lower trendlines to the breakout point. This method provides a theoretical basis for Bitcoin’s projected price target.
Price Outlook
Zach Pandl, Research Head at Grayscale, predicts that with favorable policy tailwinds under Trump, Bitcoin could reach a new all-time high in Q1 2025. Nevertheless, in the short term, $80,000 remains a popular target among many analysts. Investment research firm Bravo Research指出 that if prices retreat to this level, it would present traders with a "buy the dip" opportunity.
In summary, Bitcoin is currently at a crucial technical juncture, where the balance between bulls and bears will determine the near-term market direction. Investors should closely monitor the performance at the key levels of $98,000 and $96,000, as a decisive break in either direction could trigger significant market volatility.
Join TechFlow official community to stay tuned
Telegram:https://t.me/TechFlowDaily
X (Twitter):https://x.com/TechFlowPost
X (Twitter) EN:https://x.com/BlockFlow_News