
Bitcoin enters its main upward wave—how to seize the timing to exit at the top from cycle data?
TechFlow Selected TechFlow Selected
Bitcoin enters its main upward wave—how to seize the timing to exit at the top from cycle data?
When others are filled with greed, remain respectful toward the market.
 Navigating Web3 tides with focused insights
Author: Chandler, Foresight News
In August, we analyzed the market conditions at that time using on-chain macro-cycle data in our article "Bitcoin Amid Wide Volatility: A Macro-Cycle Data Perspective," concluding that the market was undergoing a phase of intense wide-range volatility.
However, multiple key on-chain indicators suggest that the market has not yet entered the typical bull market "main uptrend." Both the MVRV Z-Score and Puell Multiple show that while prices have risen, they have not reached historical highs. Meanwhile, the 200-week moving average continues to provide strong price support, suggesting that market corrections may be nearing an end.
We appear to be entering a new bull cycle that cannot be fully understood through past analogies. The introduction of spot ETFs has brought increased institutional capital, enhanced market participation and liquidity, but also added new layers of complexity.
In addition, political shifts tied to the U.S. election—particularly expectations of crypto-friendly policies following Trump’s victory—have introduced fresh volatility into the crypto markets.
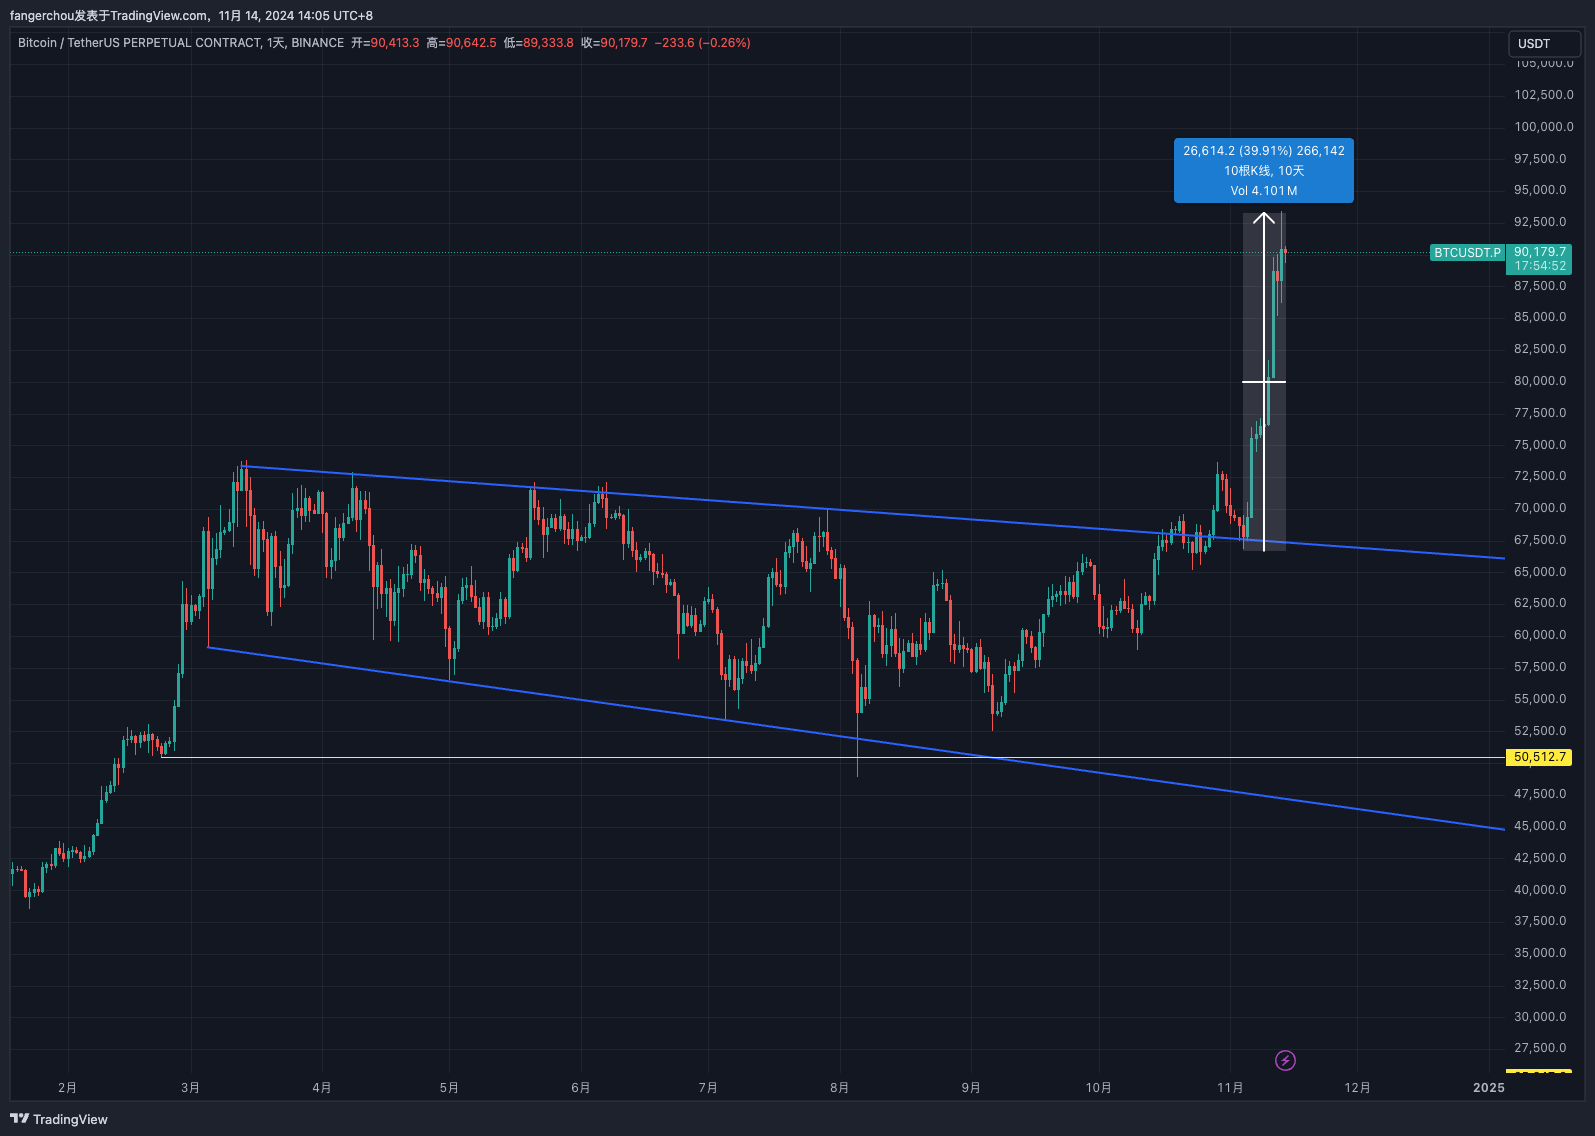
Currently, Bitcoin has broken out of its long-term consolidation range, surging approximately 40% in just ten days, rising from $66,800 to nearly $93,200 at its peak. Market sentiment is exceptionally bullish, with investors of all types rushing into the market and optimism spreading widely.
Yet, “when others are greedy, we should maintain a sense of caution.”
Under these circumstances, it's worthwhile to return to on-chain data to reassess Bitcoin’s current market state and evaluate how far this bull run has progressed. By examining key on-chain metrics, we can more calmly analyze whether there remains further upside potential or if the market is gradually approaching a阶段性 top. This rational perspective helps us stay clear-headed amid market euphoria and avoid being swept away by blind optimism during sustained bullish momentum.
Bitcoin MVRV Z-Score: Still Optimistic
The MVRV ratio is one of the most popular and widely used on-chain indicators. MVRV (Market Value to Realized Value) measures the relationship between Bitcoin’s market price and its realized price, assessing "unrealized profit" or "unrealized loss" in the market. First introduced by Murad Mahmudov and David Puell in 2018, this metric has become a key tool in analyzing Bitcoin market cycles, helping identify market tops and bottoms as well as turning points.
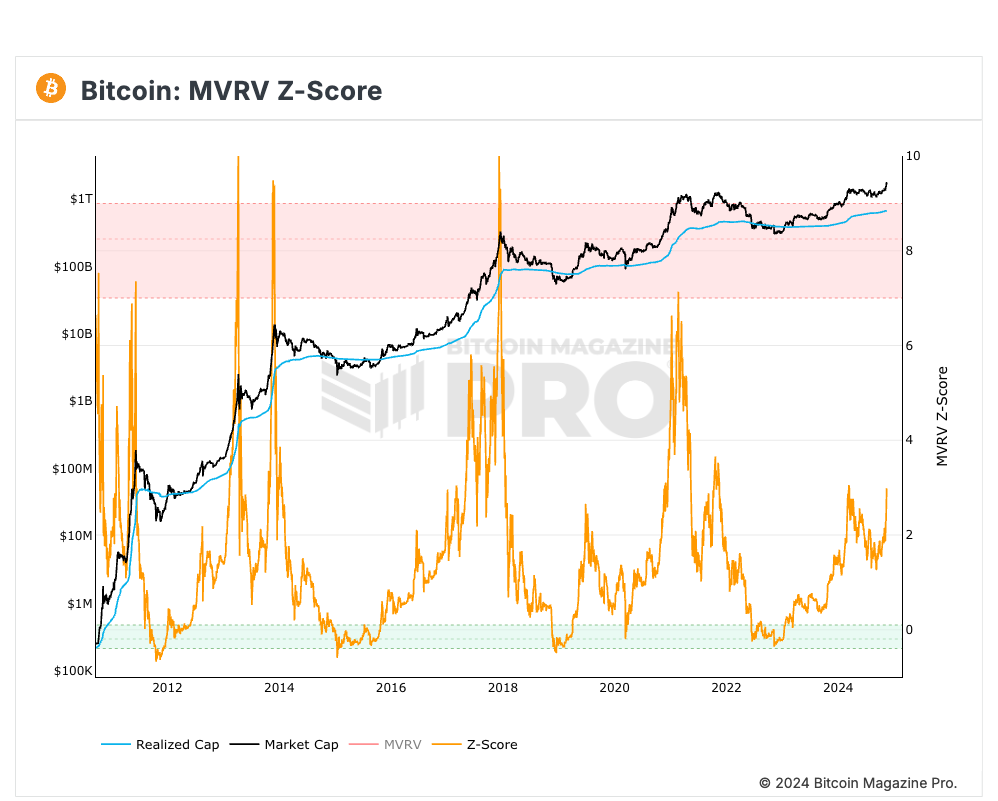
The MVRV Z-Score extends the MVRV ratio by applying the statistical concept of standard deviation to more precisely measure extreme market conditions. By calculating the degree of deviation between market value and realized value, the MVRV Z-Score identifies instances where the market price is significantly overvalued or undervalued relative to realized value. Typically represented by an orange line, when the Z-Score enters the pink zone above, it signals market overvaluation—commonly seen at the peak of bull cycles. Conversely, entry into the green zone below indicates severe undervaluation, often occurring at bear market lows.
Currently, after a period of pullback and recovery, the MVRV Z-Score has not yet reached the extreme highs observed in previous bull runs. This suggests that Bitcoin’s market price remains in a relatively optimistic upward phase, potentially still having room before reaching overheated or cyclical peak levels.
Puell Multiple: Has Not Yet Peaked
The Puell Multiple is another indicator closely aligned with cycle peaks. It calculates the ratio of “current miner revenue to the 365-day moving average revenue,” where miner revenue primarily consists of the market value of newly issued Bitcoin (which miners receive as block rewards) and associated transaction fees. This metric provides insight into miners’ earnings conditions.
Formula: Puell Multiple = Miner Revenue (market cap of newly issued BTC) / 365-day moving average of miner revenue
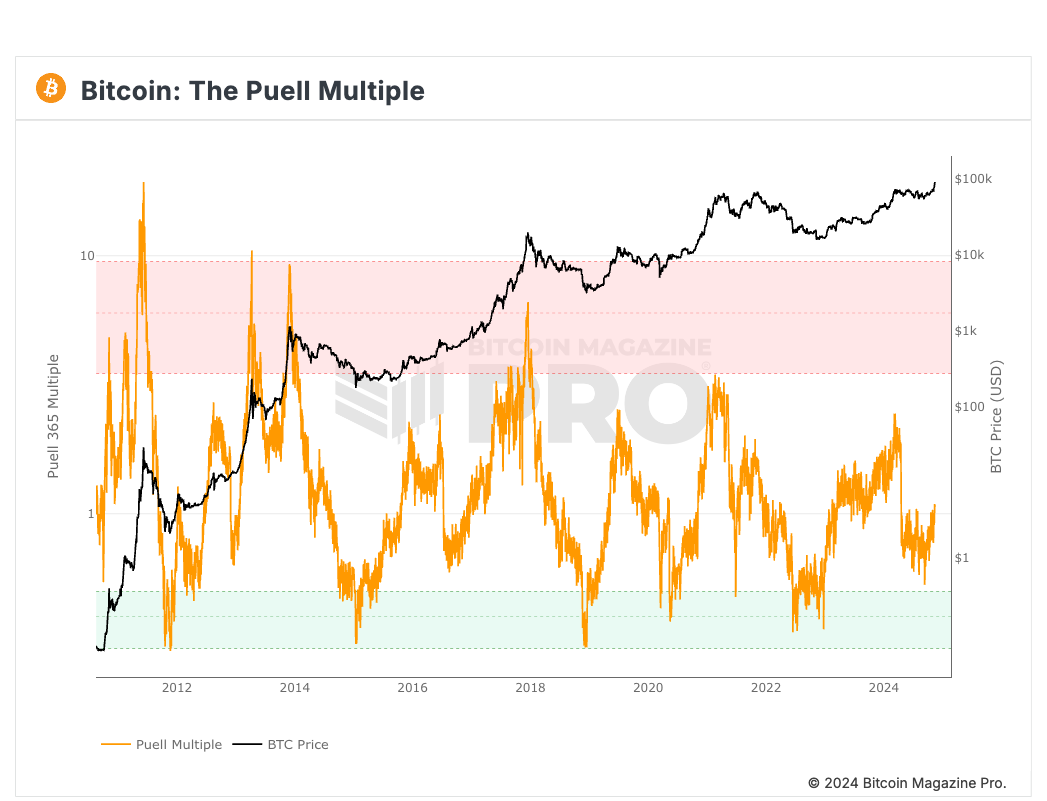
The Puell Multiple is primarily used to gauge selling pressure from Bitcoin miners. Initially, it only accounted for block rewards, but as transaction fees became a larger portion of miner income, the formula was updated to include them, offering a more comprehensive view of miner revenues.
This indicator helps traders understand the level of miner selling pressure: when the Puell Multiple dips into the green zone, it means the daily issuance value of Bitcoin is unusually low—historically a good buying opportunity, with investors who bought during such periods often achieving outsized returns. In contrast, when the Puell Multiple rises into the red zone, it indicates miner revenues are significantly above historical norms, typically coinciding with price peaks—a favorable time to take profits.
Previously, Bitcoin approached the green zone, but currently, the indicator is slowly climbing and still far from the red zone highs.
2-Year MA Multiplier & 200-Week Moving Average Heatmap:
The 2-year MA multiplier and the 200-week moving average heatmap are both tools for analyzing Bitcoin’s long-term price trends. The 2-year MA multiplier refers to the ratio between Bitcoin’s current price and its 2-year (approximately 24-month) simple moving average (SMA), measuring whether Bitcoin’s market price deviates from its long-term average. It helps determine whether Bitcoin is relatively overvalued or undervalued.
Bitcoin’s 200-week moving average (200WMA) is a crucial long-term trend indicator, commonly used to assess the overall health of Bitcoin’s price trajectory. It reflects the average price over the past 200 weeks (about four years), capturing long-term cycles and price fluctuations.
The 200-week moving average heatmap visualizes the ratio of Bitcoin’s current price to its 200WMA, illustrating whether the market is in a “hot” or “cold” state.
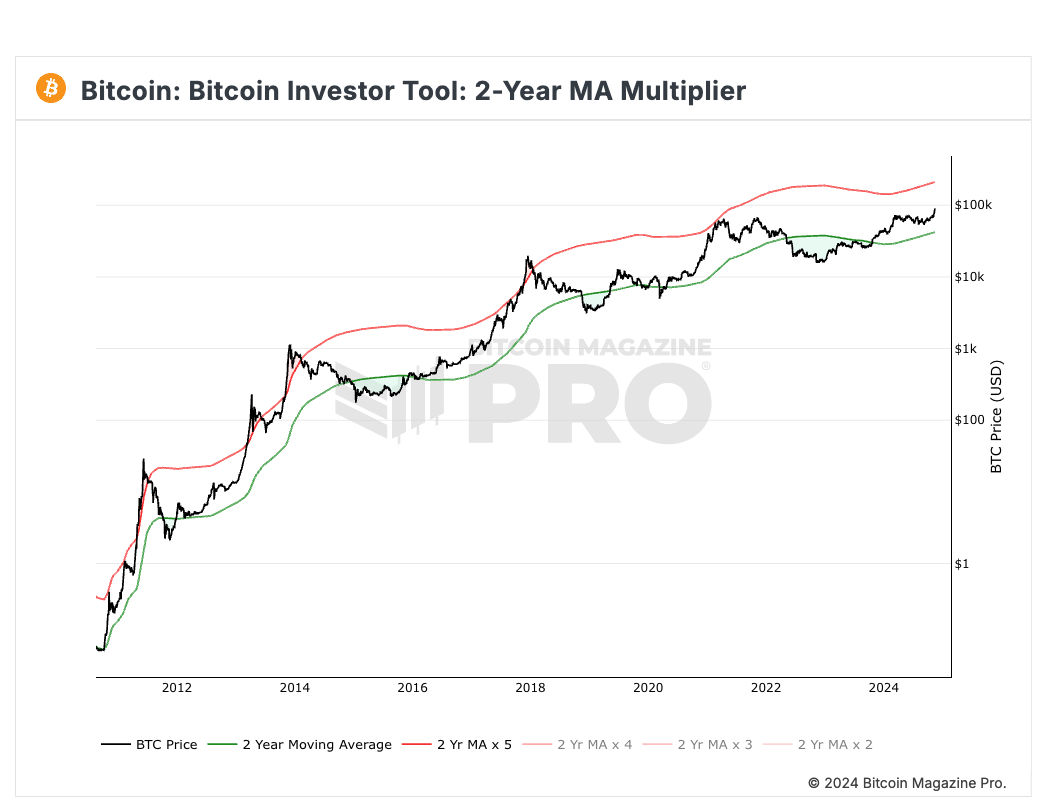
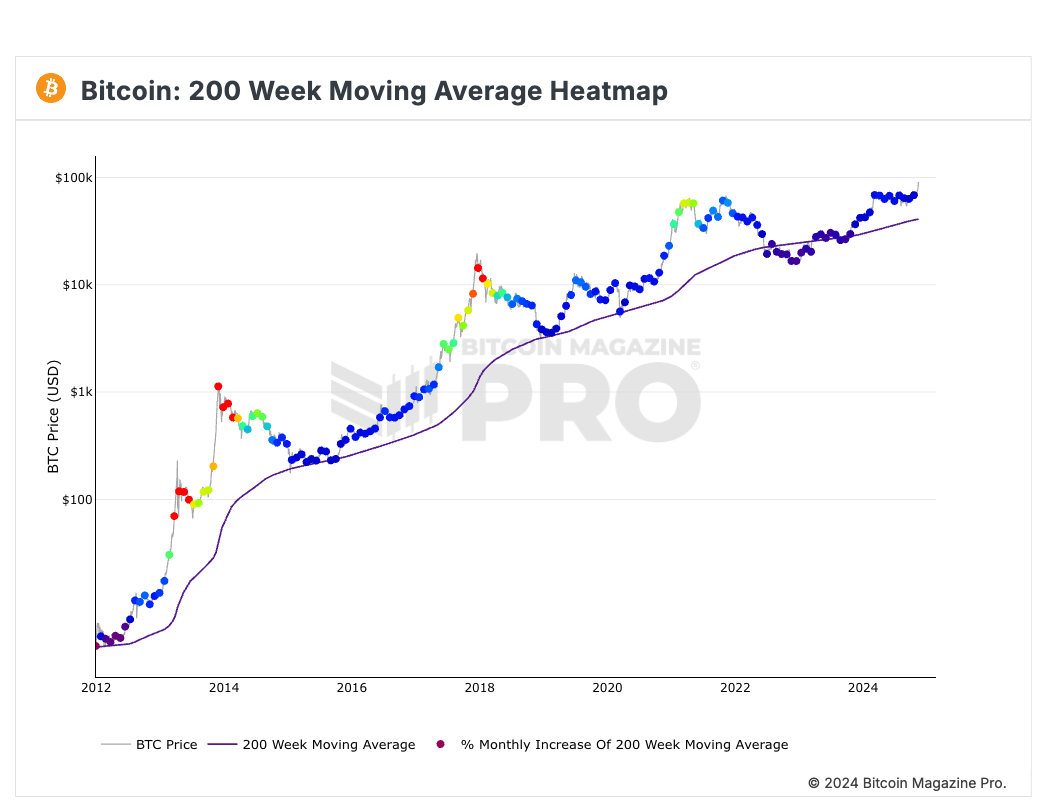
The heatmap clearly reveals Bitcoin’s cyclical volatility. When prices remain in the blue zone for extended periods, market热度 is relatively balanced. As the heatmap shifts toward green, orange, or even red, it signals a potentially overheated market—where prices are far above the long-term average and correction risks increase.
Clearly, the current market remains in a relatively healthy state, without widespread signs of FOMO yet emerging.
Strong Demand vs. Intense Supply
According to granular data compiled by on-chain analyst @Murphychen, the current Bitcoin market is experiencing an extreme divergence between demand and supply, reflecting highly volatile market sentiment.
Driven by heightened investor enthusiasm in the United States, strong demand has pushed Bitcoin prices to new highs. At the same time, supply pressure in the market is rapidly increasing. Continuous distribution by miners and long-term holders (LTHs) has led to a surge of "hot supply"—a phenomenon typically seen only during periods of extreme market emotion, such as FOMO or panic.
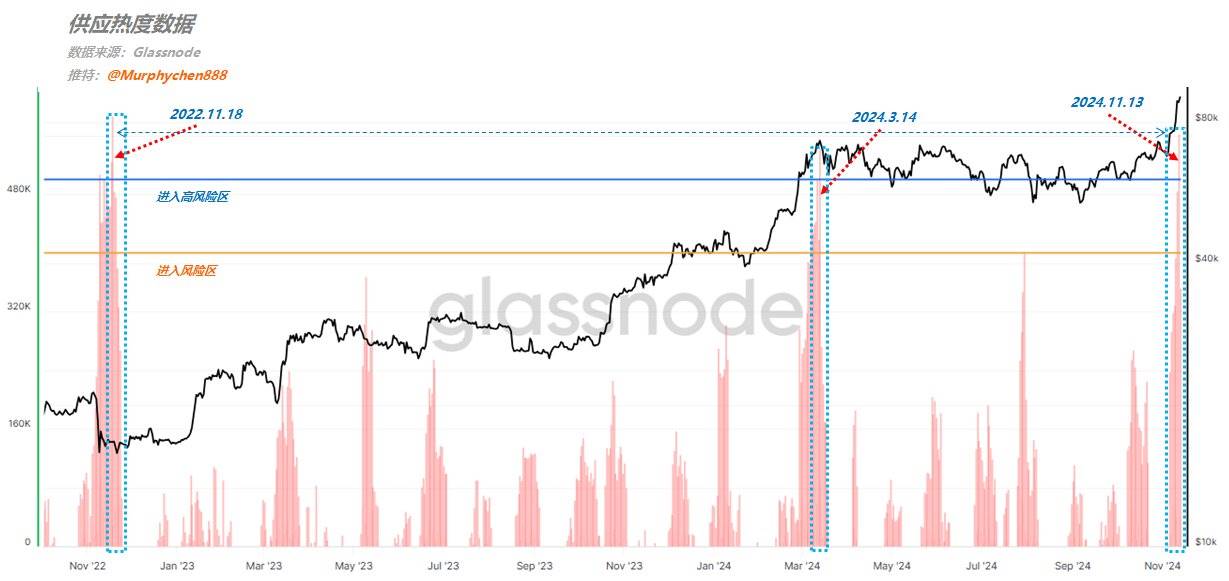
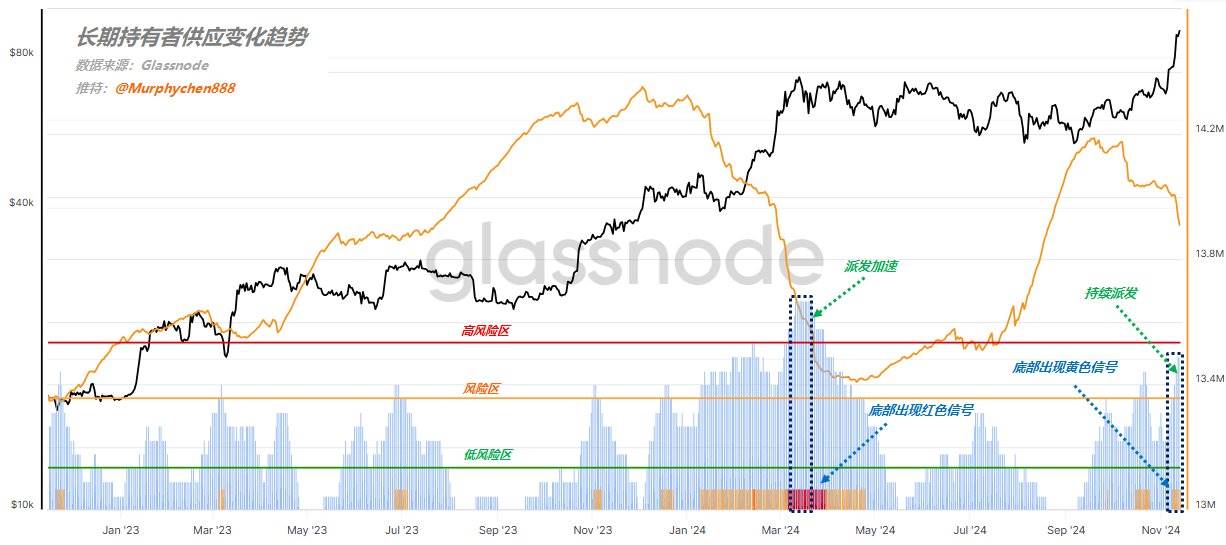
Notably, on November 13, supply surged beyond the high point seen in March of this year—a period when Grayscale ETF fund distributions were still ongoing. Today, however, no similar catalyst exists to explain this spike. This surge in supply resembles the market panic seen in November 2022 when Bitcoin dropped to $16,000, highlighting a stark contrast in current market sentiment. Behavioral patterns of long-term holders further confirm growing selling pressure. While no clear topping signal has emerged yet, continued LTH distribution has pushed the market into a "medium-risk" zone, approaching the threshold for accelerated selling.
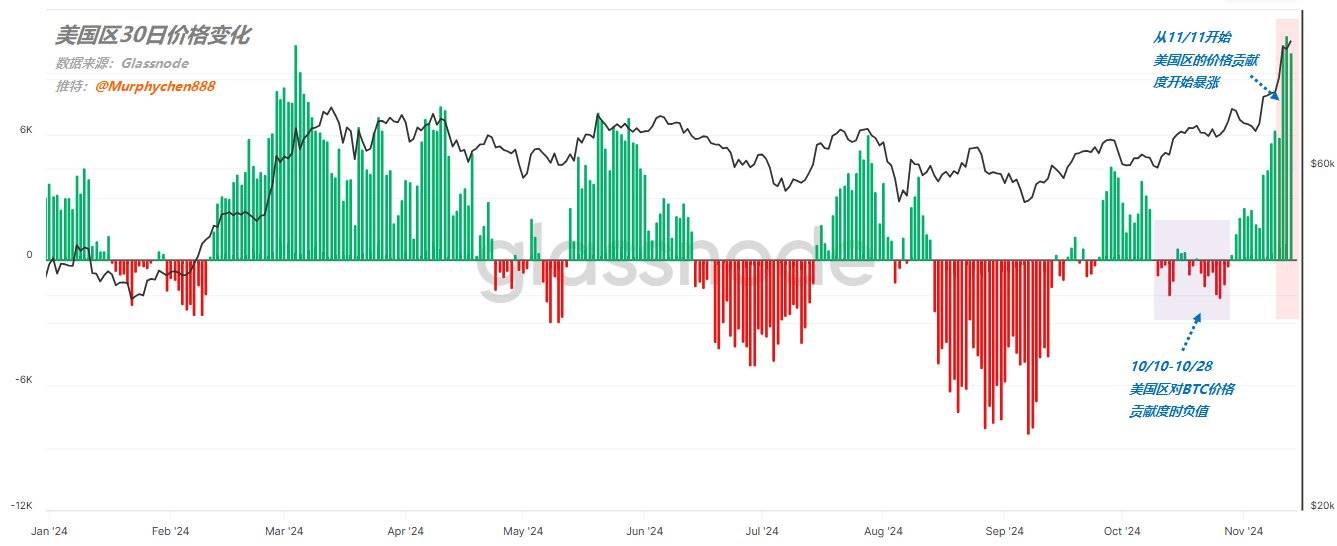
Despite rising supply pressure, strong demand continues to support Bitcoin’s price ascent. Particularly since November 11, surging investor sentiment in the U.S. has become a major driver of price increases. Data shows that from October to November, market leadership shifted from Asia and Europe to the U.S., making the driving forces behind the rally increasingly evident. Alongside rising demand, the market’s profit-generating capacity has grown rapidly, indicating that this demand is not merely short-term but represents sustained, robust momentum.
Nevertheless, the market’s "frenzied" mood serves as a warning: although no definitive topping signal is present, the combination of excessive supply and ever-growing demand may be nurturing bubble risks. When demand and supply reach a critical inflection point, a bubble burst could occur at any moment. Investors should remain rational and vigilant, recognizing the inherent unpredictability of markets and avoiding getting lost in emotional hype. Therefore, while short-term upside potential may still exist, the current imbalance between supply and demand could foreshadow future risks.
Join TechFlow official community to stay tuned
Telegram:https://t.me/TechFlowDaily
X (Twitter):https://x.com/TechFlowPost
X (Twitter) EN:https://x.com/BlockFlow_News
 Foresight News