Decoding Bitcoin's 2024 Price Performance: From the Trump Effect and MicroStrategy Premium to Liquidity Cycles
TechFlow Selected TechFlow Selected
Decoding Bitcoin's 2024 Price Performance: From the Trump Effect and MicroStrategy Premium to Liquidity Cycles
If Trump wins, the market will reach a higher level.
 Navigating Web3 tides with focused insights
Author: The Giver
Translation: TechFlow
This is a very long thread aimed at documenting the rise in Bitcoin's price since October 15. I will reiterate my original views from when I guested on @1000xPod.
Before we begin, I want to be clear—this is not advice to go long or short any coin, especially given that open interest and positioning are extremely crowded over the next week. The likelihood of challenging all-time highs (ATHs) is very high, even probable. This could lead to significant right-tail effects. Specifically, I believe managing a new short position here could be very difficult. That said, moving forward—
Today, I aim to define the nature and intensity of capital flows into Bitcoin since mid-October. I'll discuss how BTC has added $250 billion since its low of $59,000, how total crypto market cap has increased by $400 billion, and describe what I see as constrained capacity in Q4 2024—one that I believe won't be meaningfully breached.
I have two core views: 1) New capital remains limited—this is a necessary premise; the strong inflows we’ve seen over the past two weeks are primarily speculative in nature; 2) The excess liquidity required to generate a blow-off top like we saw in 2021 simply does not exist.
However, I believe the following principles are severely underappreciated and rarely discussed, largely because analysis around price rises tends to be superficial, only gaining attention when prices fall.
You need to believe:
1) Election outcomes do not drive price-dependent results; instead, Bitcoin is currently being used as a liquid hedge against a Trump victory.
2) The “easing conditions” needed to make new all-time highs today are insufficient. Interest rates and other popular heuristics correlate far less strongly with flow-driven liquidity than commonly suggested, and signs indicate price is ultimately being suppressed rather than undergoing genuine price discovery.
Restating Previous Views
When Bitcoin broke above ~61,000/62,000 during the Columbus Day holiday, it prompted me to revisit those events. So starting that week (later presented on @1000xPod), I forecasted the following, summarized here:
-
BTC.D increases (while BTC itself may challenge $70,000 before election results)
-
In parallel, altcoins broadly decline relative to BTC—because the speculative capital mentioned in point 1 focuses solely on BTC as leverage against a Trump win
-
Initial inflows (cost basis between 61,000 and 64,000) are sold ahead of the actual election, leaving room for new directional (and speculative) capital
-
Due to points 1–3, Bitcoin falls mid-term regardless of who wins
Thus, I recommended going long BTC and short “everything else.”
Why Are Capital Flows Mercenary in Nature?
My understanding of this positioning rests on three main pillars:
1) MicroStrategy is the preferred vehicle for large-scale investment and exposure: rapid expansion typically coincides with local tops.
2) Market consensus misunderstands the “Trump trade”; its impact isn’t causal—increased odds of Trump winning don’t linearly create upside for BTC performance. Instead, the basket of assets rising this month reflects an underpriced probability of a Trump victory.
3) A new participant has emerged in this cycle—one distinct from prior actors—that has no intention of recycling capital within the ecosystem; native crypto capital is already fully deployed, and spot follow-through is unlikely.
Case Study: MicroStrategy
I believe MicroStrategy is one of the most misunderstood investment vehicles today: it’s not merely a simple BTC holding company, but more akin to a FIG (NOL—net operating losses covered via new capital raises), whose core business revolves around generating non-dilutive net interest margin (NIM).
NIM is a concept best understood through insurers seeking returns on long-duration deposits, typically earning that return via liquidity premiums (like bonds), where ROE (return on equity) exceeds ROA (return on assets).
For MSTR or any stock, two factors determine MSTR’s valuation:
-
Expected BTC price growth (definable as BTC yield)
-
Weighted average cost of capital (WACC)
MicroStrategy can be seen as an under-leveraged firm with light liabilities—the bulk of its obligations are covered well before BTC reaches $10–15K, making its capital efficiency extremely high:
It accesses credit markets efficiently, having arranged over $3 billion in convertible bonds, typically structured with: <1% coupon and a 1.3x conversion premium cap, redeemable if the strike price exceeds the market price at some future date. However, from its secured notes due 2028, we see MSTR’s fixed debt cost is about 6% (already repaid).
Thus, we can visualize MSTR’s overall cost of capital from a credit perspective, using implied probabilities assigned to achieving a 1.3x MOIC, leveraging hybrid convertible instruments.
If you receive $1 annually for 5 years ($5 total, no redemption), then for lenders to be indifferent between offering convertibles and $6/year paying notes, the $5 annual gap must be offset by a one-time $30 payment in year 5.
This leads to the equation: 5 + 5/(1+x)^1 + 5 + 5/(1+x)^2 + 5 + 5/(1+x)^3 + 5 + 5/(1+x)^4 = 30/(1+x)^4, which equates to roughly a 9% cost of capital, while the current debt-to-market-cap ratio implies an equity cost of ~10%.
In short: If BTC yield—i.e., BTC’s expected annual growth rate—can exceed 10%, then MSTR’s premium should expand relative to net asset value (NAV).
Through this framework, we understand that the premium reflects overly eager sentiment or expectations of imminent BTC expansion—thus, the premium itself is reflexive and anticipatory, not lagging.
Hence, when we overlay the premium onto BTC price, we see two periods where the premium exceeded 1—first in early 2021 (when BTC first approached $60,000), and second during the 2024 peak, when we previously neared $70,000+.
I believe as stagnant premiums end tomorrow, equity markets take notice, anticipating proceeds will be used to buy BTC, expressing this expectation in two ways:
Buying MSTR in advance, expecting the premium to re-anchor to ~1–2x as Saylor may purchase more BTC;
Directly buying BTC—not only hedging a Trump win but also Saylor’s purchasing intent (via IBIT inflows).
This theory aligns with options markets (biased toward near-term), which have seen increasing activity pricing in $80,000 BTC by year-end—matching the implied BTC yield created by MSTR purchases (1.10x $73,000 ≈ $80,000).
Yet the question remains: What kind of buyer is this? Are they here for price discovery at $80,000+?

How Has This New Capital Influenced October’s Price Action?
Despite initial correlations via algos and perpetuals, nearly every asset besides BTC lacks sustained follow-through, suggesting current bids stem purely from MSTR and BTC ETF inflows.
We can draw several conclusions:
-
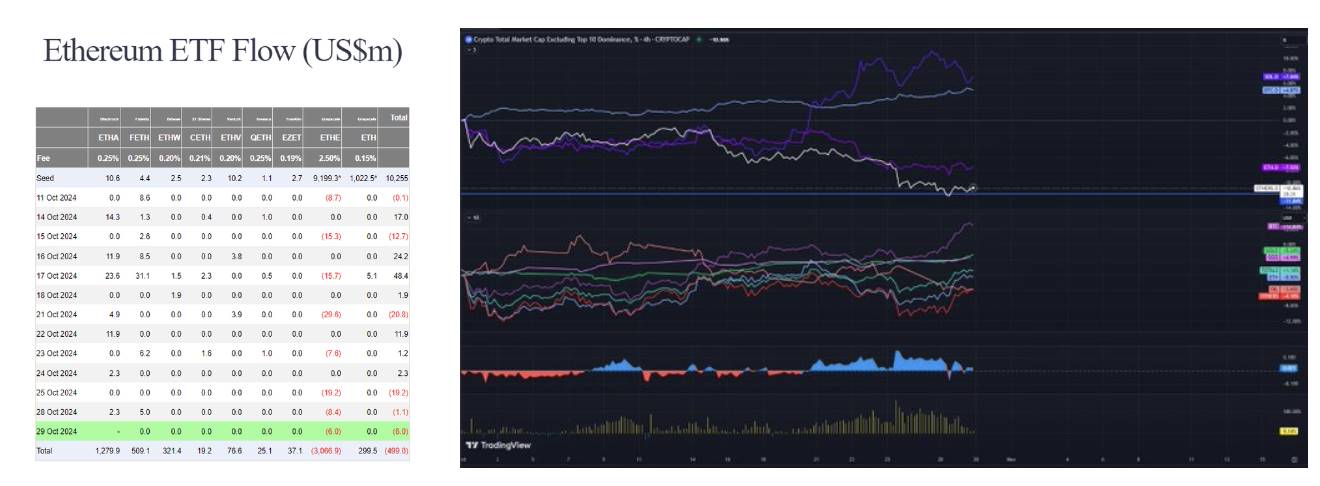
ETH ETF: Despite over $3 billion in new ETH ETF inflows since mid-October, there’s been virtually no net inflow. Likewise, ETH CME open interest (OI) appears unusually flat, leading us to conclude this buyer isn’t diversified—they’re interested only in Bitcoin.
-
BTC exchange and CME open interest are at or near all-time highs. Coin-denominated futures OI hit a yearly high of 215,000 contracts, up 30,000 from mid-October and 20,000 since last weekend. This behavior echoes the desperation for exposure we saw pre-BTC ETF launch.
-
Altcoin strength against BTC had been weakening steadily before mid-October; Solana followed ETH and other alts, performing blandly and unimpressively. In absolute terms, other alts actually declined this month—from $230B on Oct 1 to ~$220B.
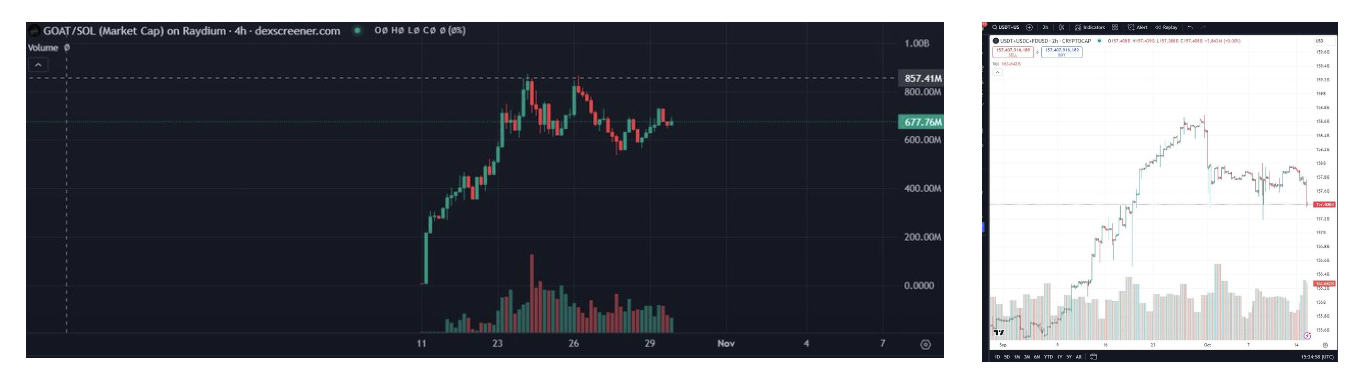
What changed for Solana on October 20? I believe SOL’s rise (+$10B) mainly reflected unexpected repricing of meme assets (observe GOAT charts and underlying AI narratives, both heavily concentrated on Solana). Users entering the ecosystem must buy Solana, and cash out profits in Solana, consistent with L1 fat-tail theory, reflecting broader trends we saw this year with APE and DEGEN. During this period, I believe ~$1B in wealth was created, passively held in SOL through the election.
-
Stablecoins decreased for the first time this year, limiting organic USD supply to fuel new demand (slowing momentum beyond today’s existing demand).
In traditional markets, we observe similar repricing—take Trump Media & Technology as a case study: trading at $50 today vs ~$12 on September 23, with no new earnings or press releases. For context, Trump Media now has a market cap comparable to Twitter—an $8B increase in one month.
Thus, two possible conclusions emerge:
-
Bitcoin’s use as a liquidity proxy merely reflects election betting flows, not sustainable long-term positioning implied by other narratives (e.g., rate cuts, policy easing, productive labor markets). If it were the latter, market behavior would be more uniform, with other risk proxies (gold when USD weakens, otherwise SPX/NDX) showing balanced strength this month.
-
The market has fully priced in a Trump win; these funds are unstable, unwilling to engage broader ecosystems despite current positioning suggesting they should/will. This fractal isn’t prepared for by crypto natives, as this type of buyer hasn’t existed before.
Who Is This New Buyer?
Historically, participants break down into several categories:
-
Speculators (short/medium-term, often creating deep capital troughs and peaks, highly sensitive to price and rates)
-
Passive bidders (via ETFs or Saylor, though he buys in bulk)—price-insensitive, happy to support pricing, forming entrenched HODL behavior in typical 60/40 portfolio construction.
-
Arbitrage bidders (rate-sensitive but price-insensitive)—mercenary capital, overall price-neutral, possibly early drivers of momentum at year-start.
-
Event-driven bidders (create OI expansion within specific windows), e.g., ETH ETF and Trump summer rallies—we believe this is what we’re seeing now.
Class 4 bidders have a summer playbook, expressible via my prior tweets on Bitcoin as partisan leverage (next tweet).
This suggests buying is indeed impulsive and jumpy, butthis buyer doesn’t care about election outcomes (interpretable as lack of linear correlation between Trump odds and BTC price). They may de-risk similarly to Grayscale bidders when ETFs went live—closed-end funds involving BTC/ETH.
Bitcoin as Leverage in a Bipartisan Game
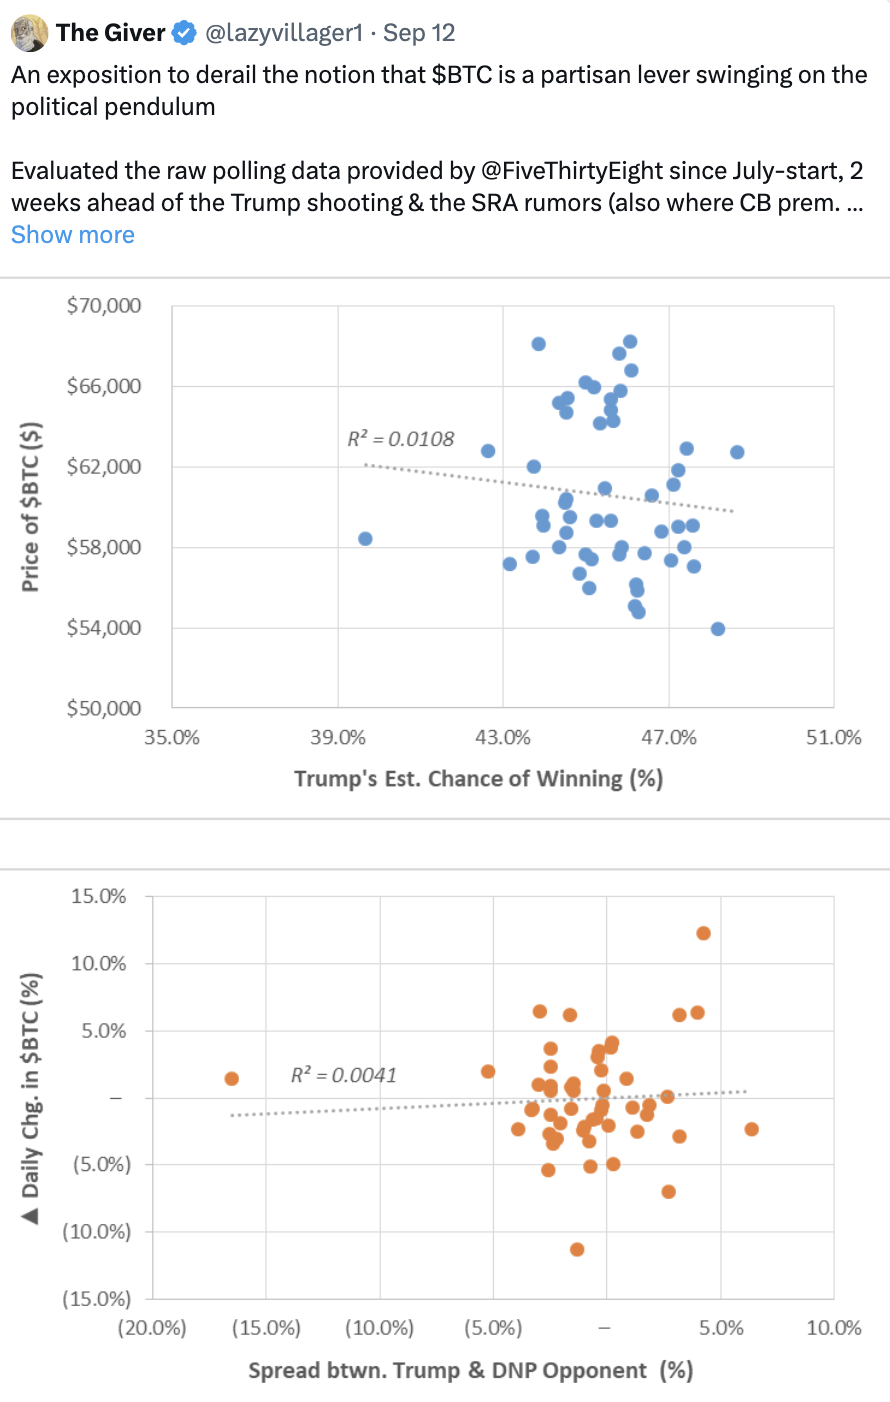
(See tweet)
How Do Interest Rates Affect Bitcoin?
In June/July (next tweet), I argued it’s hard to view rate cuts as a simple easing mechanism. In this and subsequent tweets, I debunk that idea and discuss a key missing variable I believe causes us to overestimate Bitcoin demand:excess liquidity.
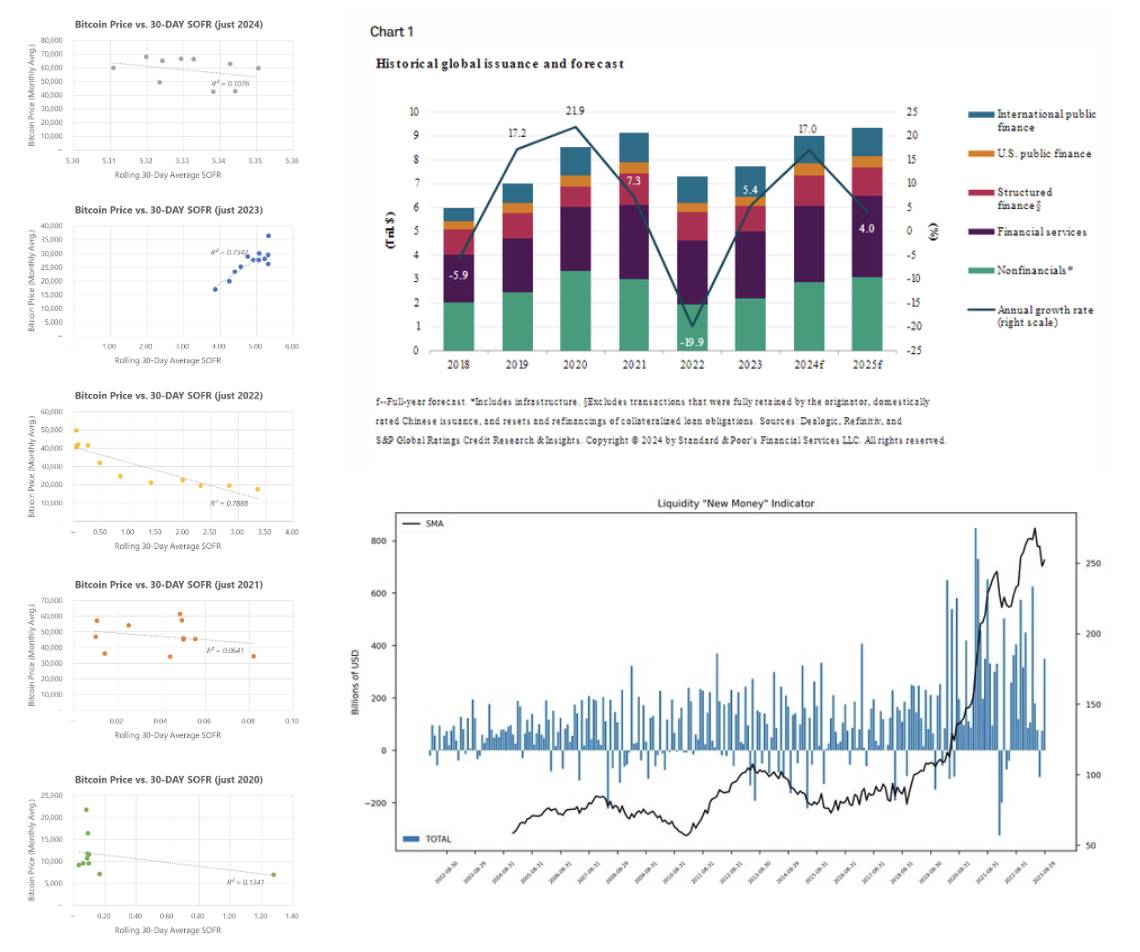
First, let’s independently compare Bitcoin’s price over the past 5 years with historical SOFR (rates). This shows strong correlation in 2022 and 2023, but divergence in 2020, 2021, and 2024. Why? Don’t lower rates make borrowing easier?
The issue is that unlike those outlier years, credit markets in 2024 are already quite strong, signaling impending rate cuts. A unique mechanism is shorter tenors on average lower-grade debt issuance (maturing 2025–2027), tracing back to several years of “higher for longer.”
You can also refer to the debt index by @countdraghula (excluding QE) to outline real debt growth.
Likewise, equities are performing exceptionally well: “S&P 500 has surpassed any consecutive rally over the past decade, totaling 117 weeks” (without a -5% return). The previous longest rally was 203 weeks, emerging from post-GFC lows.
In other words, credit and equity markets created massive recovery rallies without a recession.
My reasoning: We experienced unique mechanisms in 2021 and 2023 (COVID and SVB failure), leading to liquidity injections—leveraging the Fed balance sheet to build new facilities.
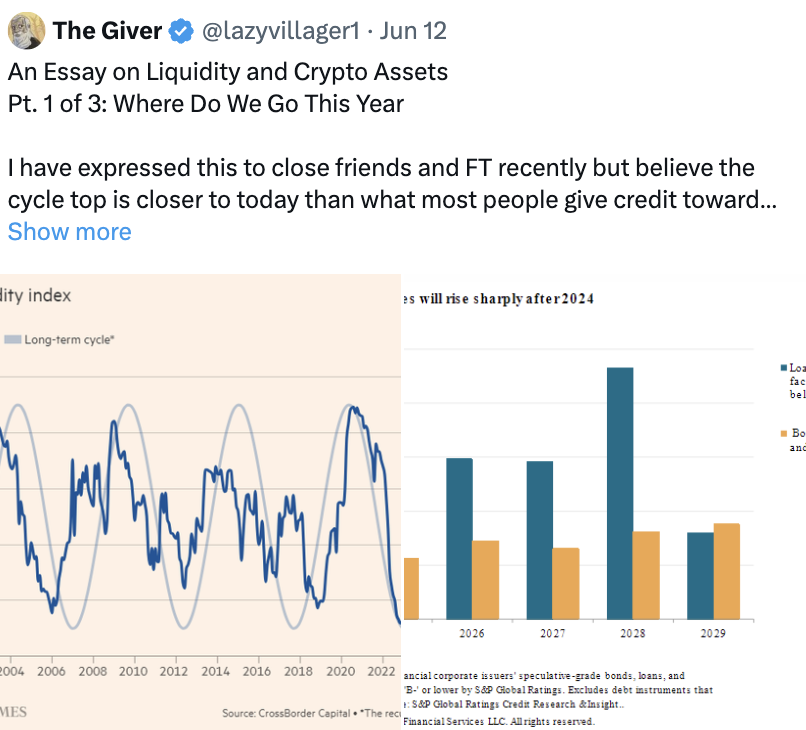
Broken Business/Liquidity Cycle
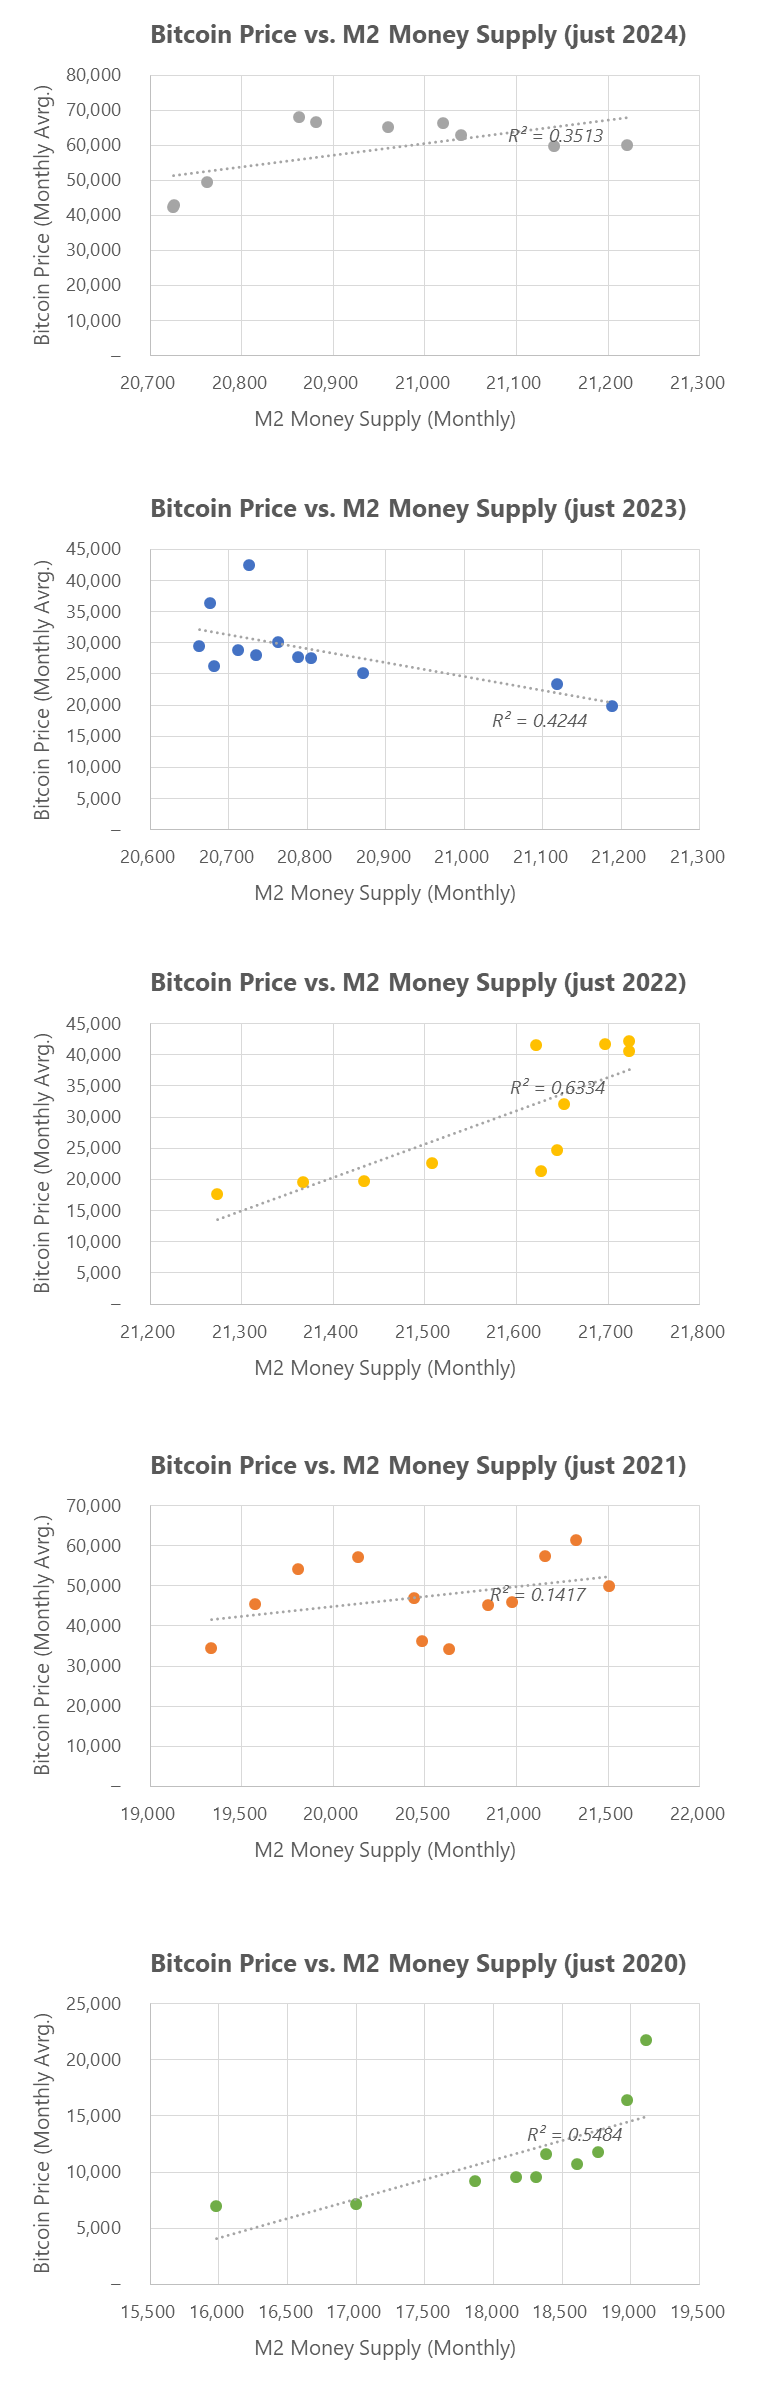
Bitcoin vs. M2 Correlation: How Emergency Measures Create Growth and Volatility
Bitcoin’s growth is often seen as the primary driver, yet since 2022, Bitcoin’s correlation with M2 has weakened (again resembling the 2021 peak pattern). I believe this closely ties to the current government’s willingness to deploy its balance sheet for financial stability—at all costs.
So the key question—what exactly is Bitcoin? A leveraged equity? An asset of chaos? With the base market (~$2T) now so large, nearly matching the TOTAL1 ATH we saw in 2021, what conditions must occur for true price discovery?
I believe these questions are unlikely to be answered during this year’s office transition.
How Emergency Measures Support Bitcoin: 2021 COVID-Driven QE
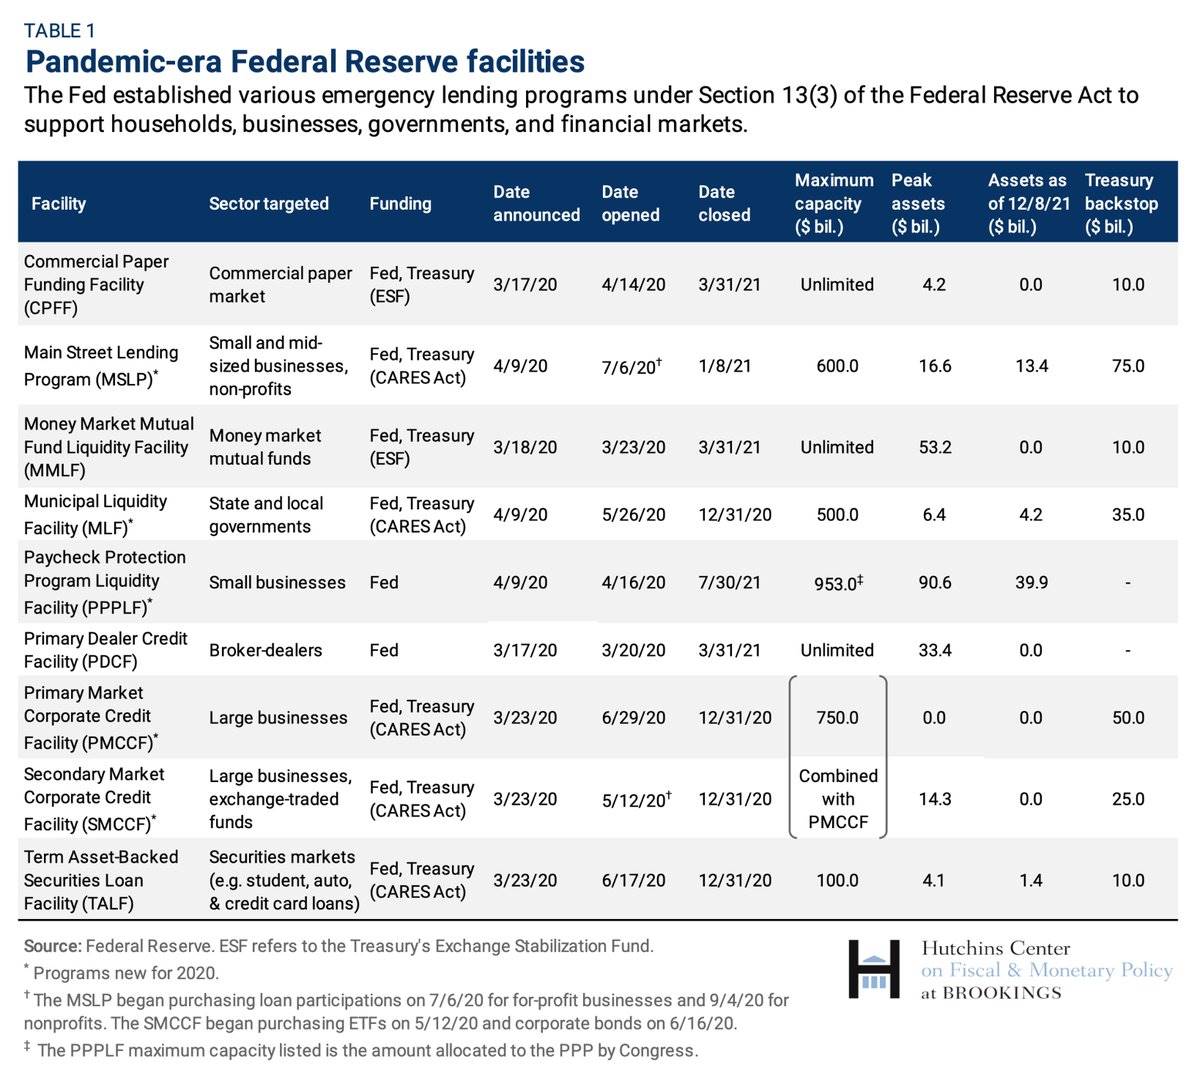
I believe using the 2021 fractal to project future price action is flawed. In 2021, approximately $2 trillion was injected via various programs. Their maturity timelines coincided interestingly with Bitcoin’s price action (PA).
On March 15, 2020, the Fed announced plans to buy $500B in Treasuries and $200B in MBS. This doubled by June and began tapering in November 2021 (halving again by December 2021).
PDCF and MMLF (loans to prime money markets via stabilization fund) expired in March 2021.
Direct lending rates dropped from 2.25% to 0.2% on March 2020. Direct corporate loans via PMCCF and SMCCF were introduced, ultimately supporting $100B in new financing (expanded to $750B to support corporate debt), including bond and loan purchases. These tapered gradually from June to December 2021.
Via the CARES Act, the Fed prepared $600B in 5-year consumer loans, while PPP ended in July 2021. As per a December 2023 report, ~64% of the original 1,800 loans remained outstanding. By August, 8% were delinquent.
The speed of this monetary injection and creation was highly unique. It clearly mirrored 2021’s price action—peaking in Q1 and Q2, declining in summer (when many programs ended). Ultimately, when these programs fully ceased, Bitcoin underwent massive downward volatility.
Further Easing in 2023: Bank Failures
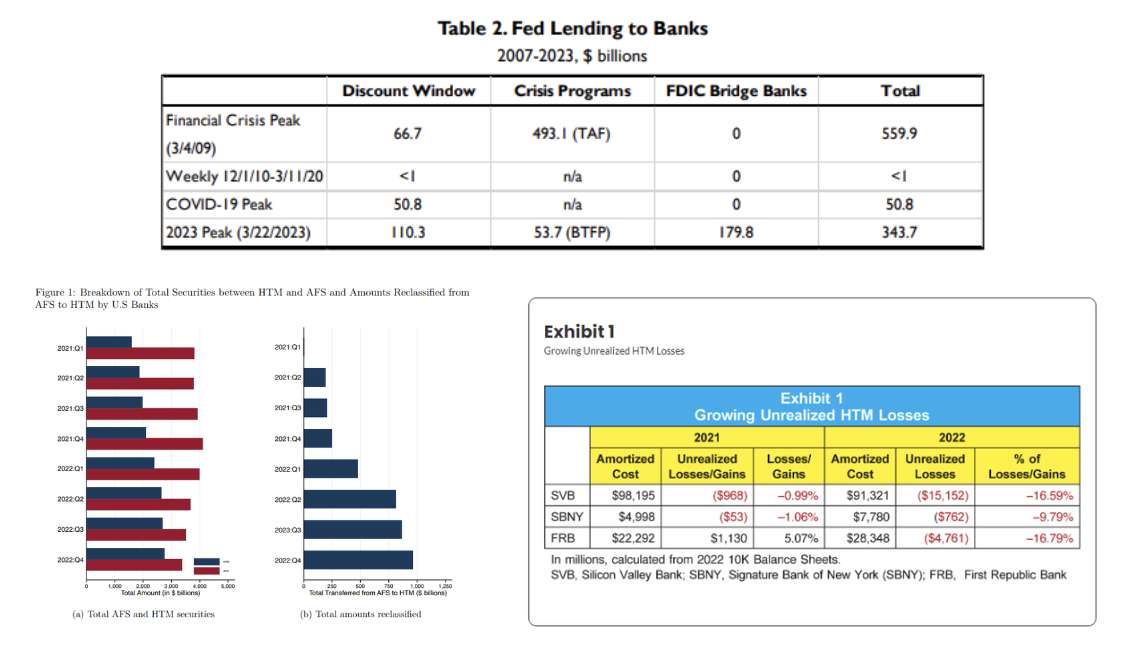
According to the Fed balance sheet, BTFP loans totaled $65B by March, discount window peaked at $150B. The Fed also lent ~$180B to bridge banks to resolve SVB and Signature Bank crises.
To put it in perspective, the Fed’s lending to banks during this period was about 6.5x higher than during the pandemic.
The reason is clear: All HTM (held-to-maturity) securities on bank balance sheets represented unrealized losses. These didn’t need reporting under FASB rules. In 2022, U.S. banks’ HTM portfolios grew from $2T to $2.8T, mostly by reclassifying securities as HTM. This is usually acceptable (market values of long-duration fixed income suffer under persistently higher rates), but actual depositor withdrawals triggered bank runs, forcing liquidity realization—requiring mark-downs on these securities.
Since March 2023, Bitcoin’s price discovery has been largely driven by this program—which stopped issuing new loans in March 2024—precisely when crypto became overheated and corrected short-term.
Glass Ceiling: Why It Exists
Overall, I see the sequence as:
-
Capital activated after likely U.S. government selling (central bank discount) and MSTR front-running, pushing price from 59,000 to 61,000 via premium expansion.
-
Rise from $61,000 to $64,000 occurred during the long weekend, primarily due to Trump hedge effect. Some capital exited last week as price pulled back to $65,000, leaving certain buyers this week with very high cost bases (over $70,000).
-
ETFs continue supporting spot prices under directional Trump opportunity (though Bitcoin beta hasn’t risen), while laggards continue trailing despite expanding positions, lacking capital recycling.
-
Bitcoin buying remains static within its own ecosystem, unwilling to “participate” elsewhere.
Why I Don’t Expect Strong Price Discovery in 2024:
-
Lack of restaking (measured via DeFi TVL compared to 2021).
-
Overconfidence in the degree of floating that will actually occur post-rate cuts.
-
Lack of strong government stimulus (emergency injections).
-
Diminished reaction in other markets (e.g., equities, gold, etc.).
In reality, the final part—some potential upside risks (some I’ve considered, others irrelevant in this timeframe):
-
M7 earnings this week totaled ~$15T. If they perform well (a month ago I thought most companies would struggle to beat growth), part of this new capital may flow into Bitcoin and related assets. I believe Alphabet rose $10 in after-hours earlier today.
-
Chinese stimulus (which I believe is already priced into Bitcoin) expands beyond prior announcements.
-
Primaries maintain sticky market impact, yet 75 election studies show opposing and harsher views: link.
-
Inflation hedging decouples from base measures (performed strongly during Democratic-passed IRA), shifting over longer term under Trump to Bitcoin and gold.
Overall, I believe if Trump wins, markets reach a higher level, while Harris (as the other candidate) may be undervalued in market pricing. Thus, even with the above risks, expected market value remains intact.
Join TechFlow official community to stay tuned
Telegram:https://t.me/TechFlowDaily
X (Twitter):https://x.com/TechFlowPost
X (Twitter) EN:https://x.com/BlockFlow_News
 @lazyvillager1