Viewpoint: 10 Data Points Indicate the Bull Market Has Not Truly Begun
TechFlow Selected TechFlow Selected
Viewpoint: 10 Data Points Indicate the Bull Market Has Not Truly Begun
Including technical indicators, social media metrics, macroeconomic data, and other categories.
Written by: cyclop, Crypto KOL
Translated by: Felix, PANews
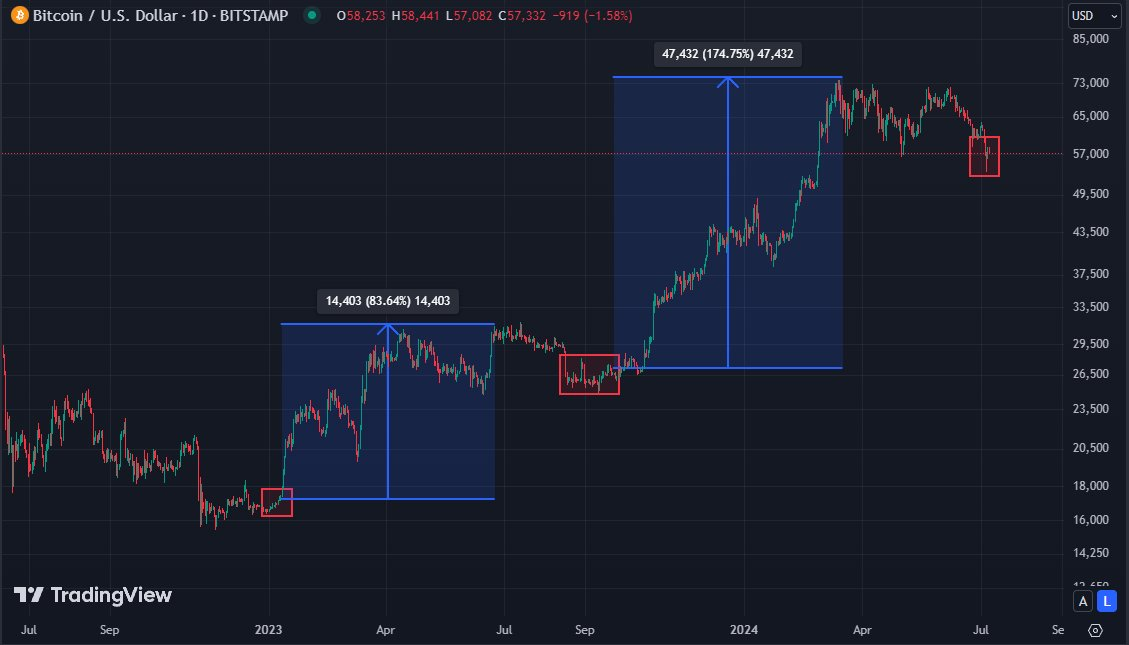
As the crypto market plunges, the Fear & Greed Index is currently at 26—nearly a one-year low. The last time it was this low, SOL was trading around $11. This level has previously occurred in January 2023, September 2023, and July 2022, each followed by a market rally. Everyone says "be greedy when others are fearful, and fearful when others are greedy," but in reality, only 1% actually follow this advice.
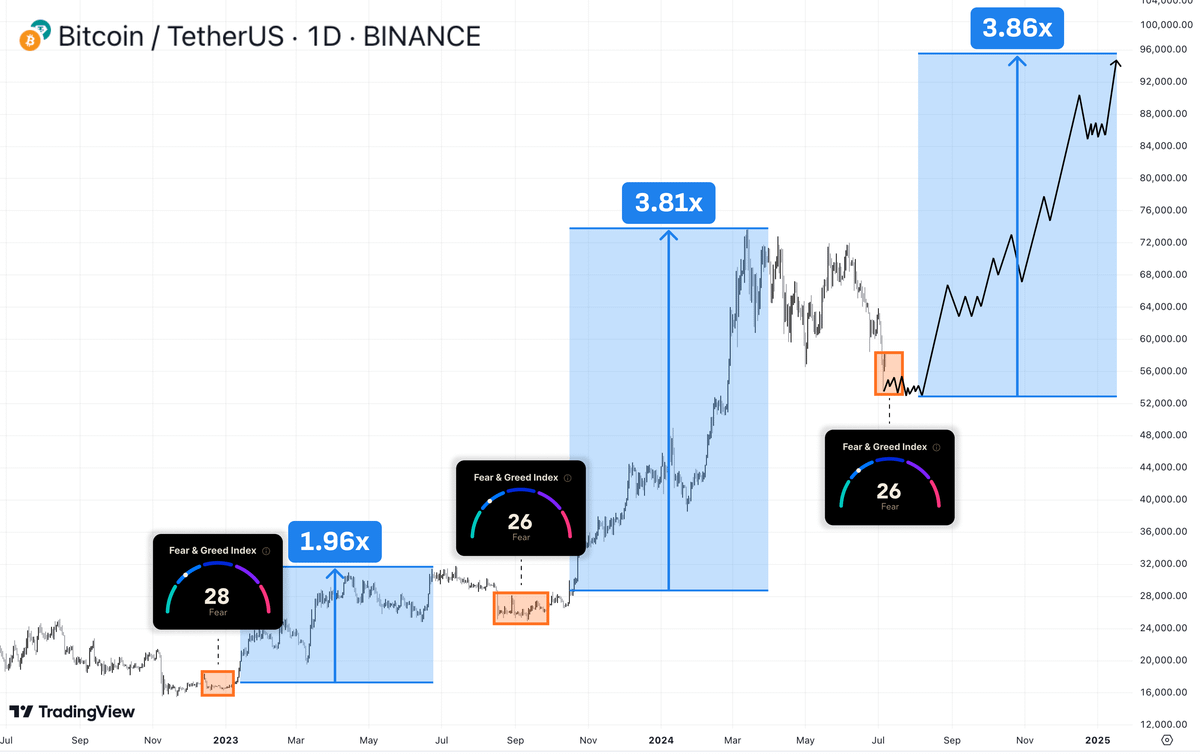
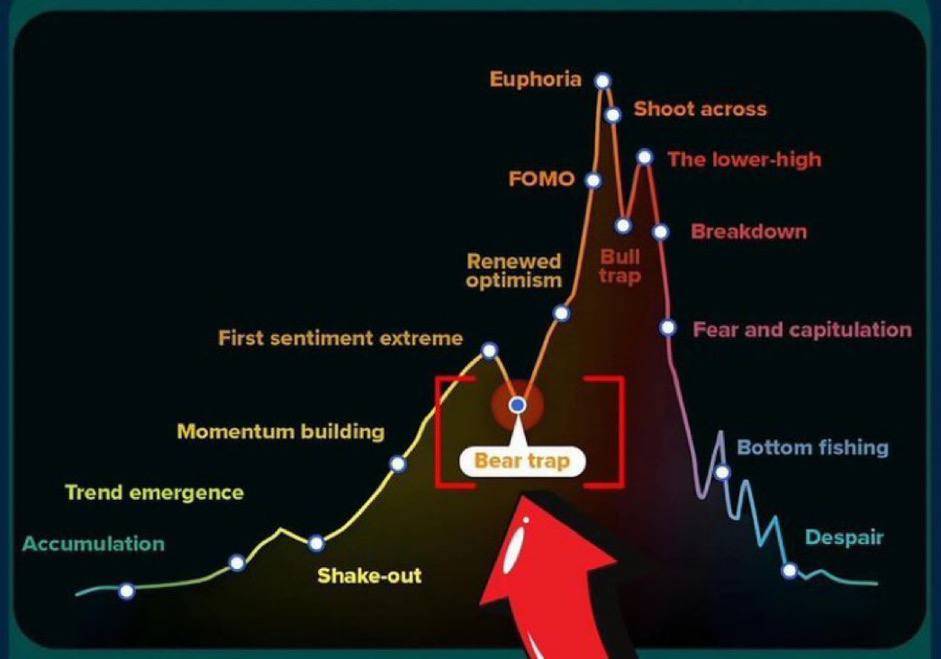
Many believe the bull market has already ended, but crypto KOL cyclop argues the bull run hasn't even started yet. Why is cyclop so confident? Below are the 10 indicators he cites.
Stablecoin Supply Ratio (SSR)
This metric tracks new capital flowing into the crypto market. It remains far below levels seen in previous cycles. Once liquidity increases, the market will grow accordingly.
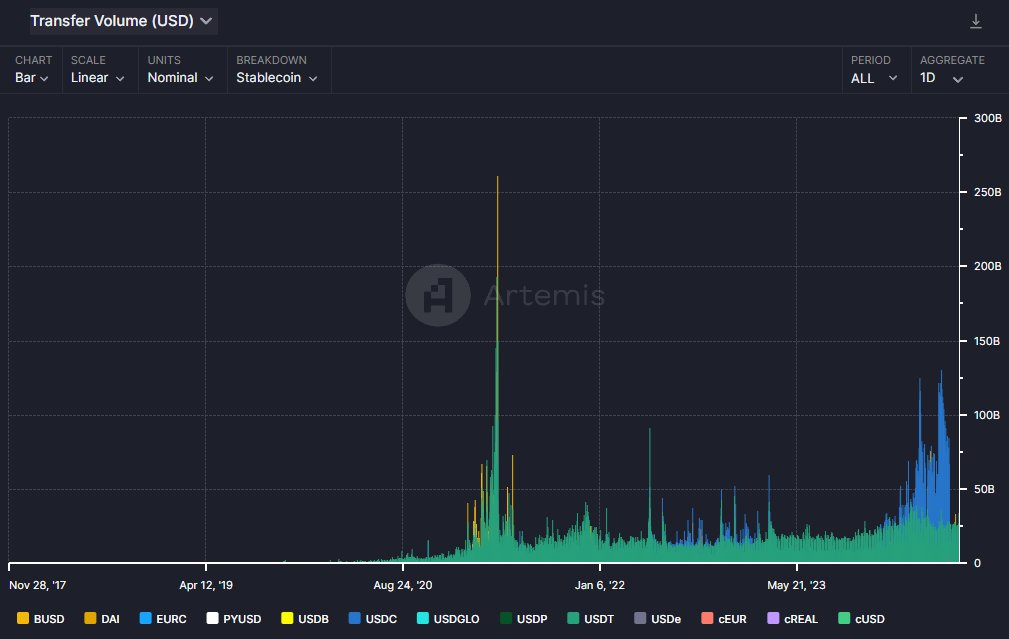
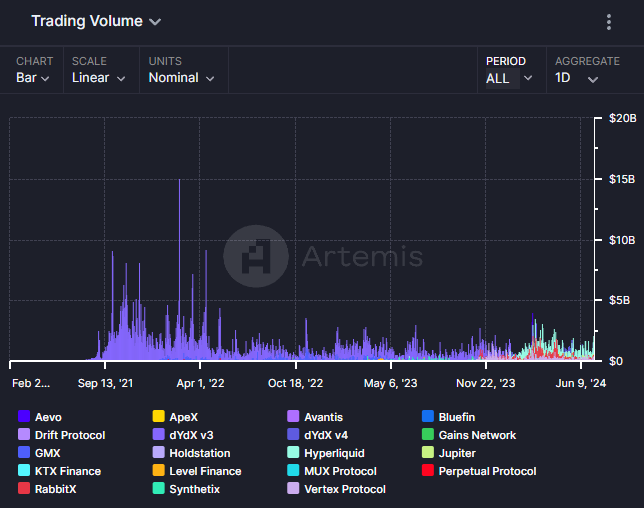
Trading Volume
Despite Bitcoin's high price, current trading volume is significantly lower than in 2021. Retail participation remains extremely low, meaning that once retail activity picks up, the market could surge.
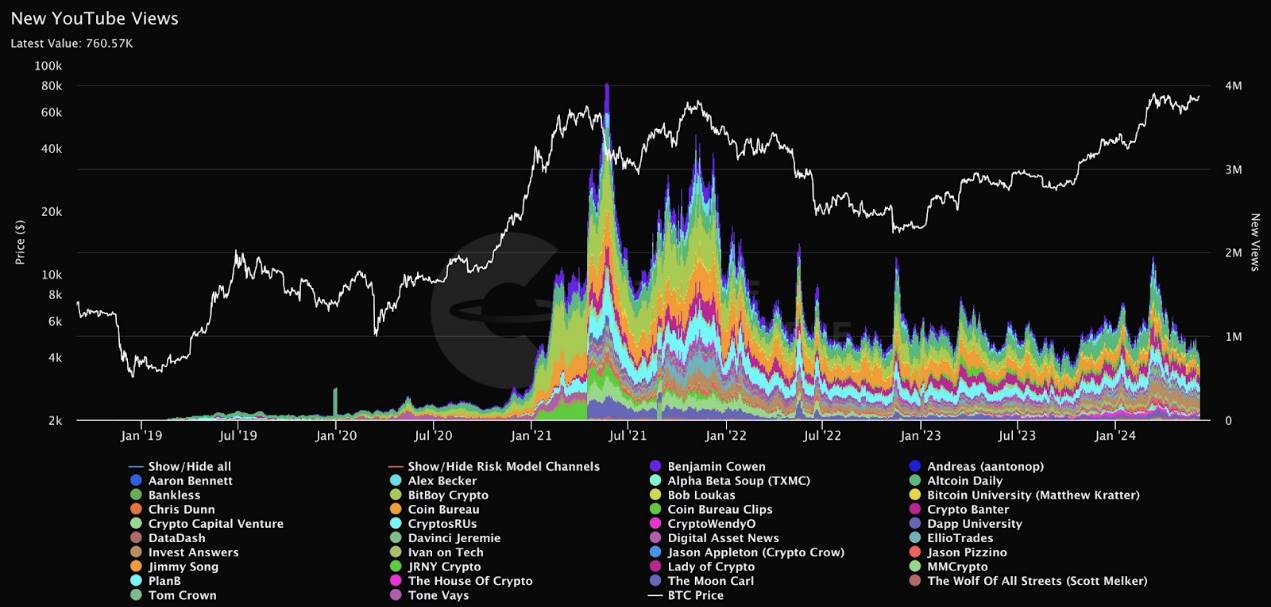
YT Indicator (YouTube Views)
Compared to the last cycle, YouTube views have dropped by roughly a factor of five. In 2021, when Bitcoin reached $70,000, daily views were around 4 million. Today, with Bitcoin again near $70,000, daily views are only about 800,000. This indicates retail investor interest remains low, suggesting significant upside potential.
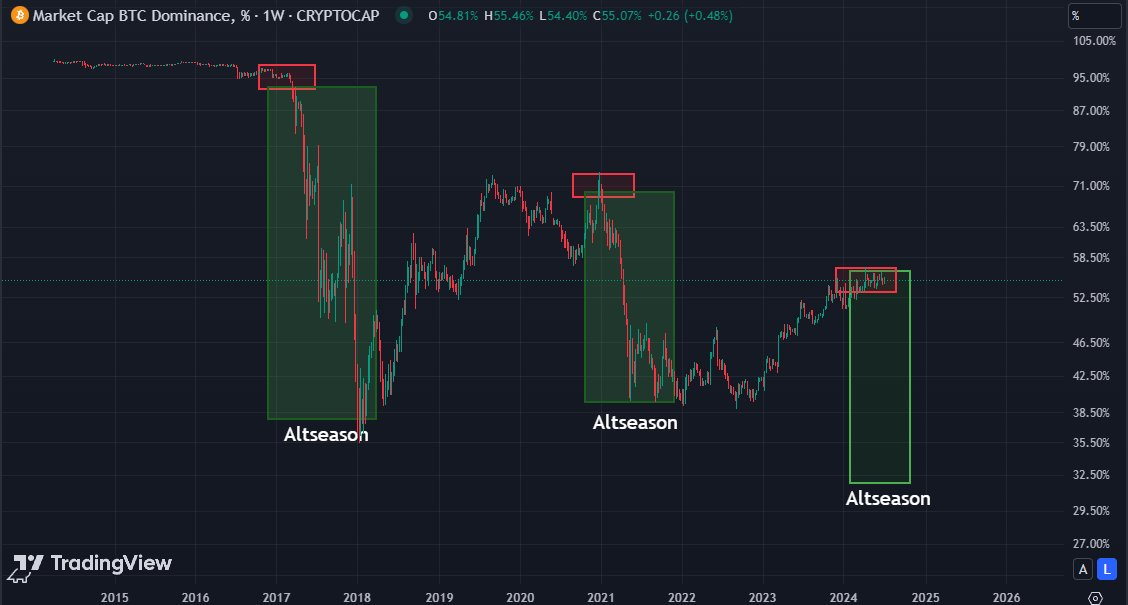
BTC.D (Bitcoin Dominance)
The chart below shows Bitcoin's share of total cryptocurrency market capitalization. Since April, BTC.D has been consolidating between 54% and 57%. A breakout below this range would signal the start of an altcoin season.
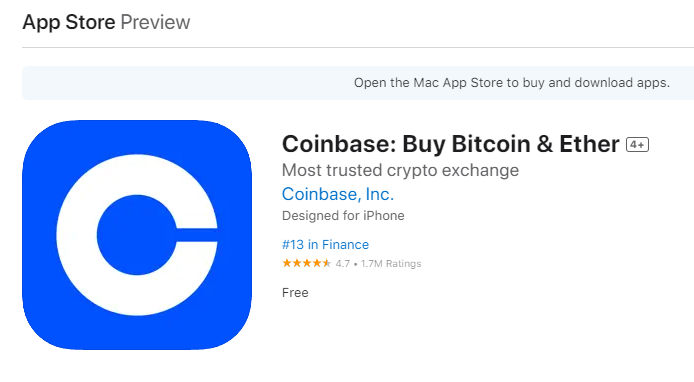
Coinbase App Download Rank
Historically, when Coinbase becomes the top-downloaded app, it signals a market peak and time to exit. While this pattern may repeat, we are far from seeing it now. (The chart below shows it currently ranks #13.)
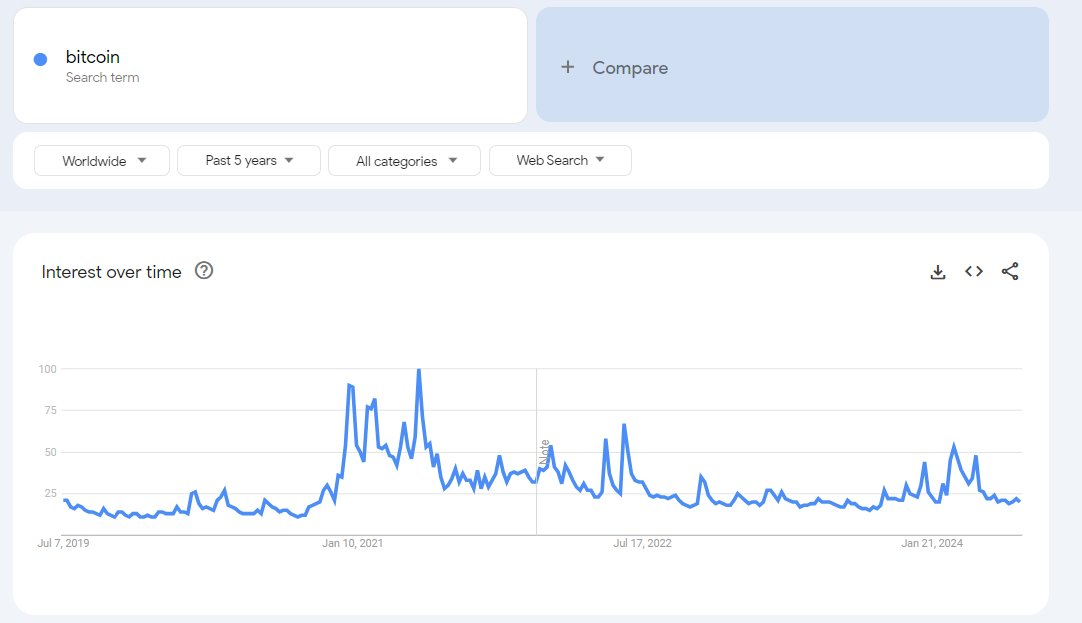
Google Trends
Search interest for terms like "Bitcoin," "crypto," or "altcoins" on Google Trends remains far below 2021 levels. Over the past five years globally, current search interest is 2.5 times lower than during the 2021 peak.
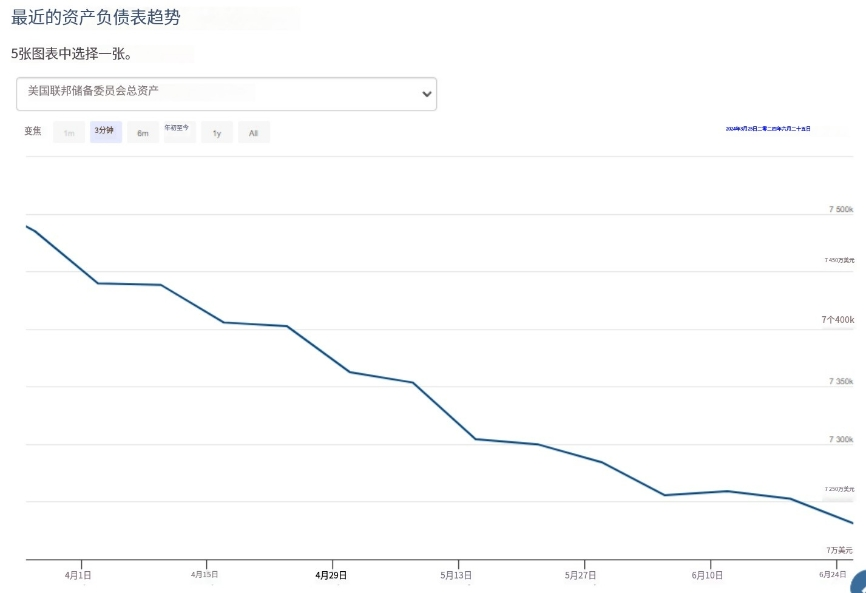
Federal Reserve Liquidity Trend
The chart below shows that when the Federal Reserve injects liquidity—buying assets and expanding its balance sheet—markets tend to rise, and vice versa. Monitoring this trend is crucial, as a reversal would increase liquidity in traditional financial markets first, then spill over into crypto.
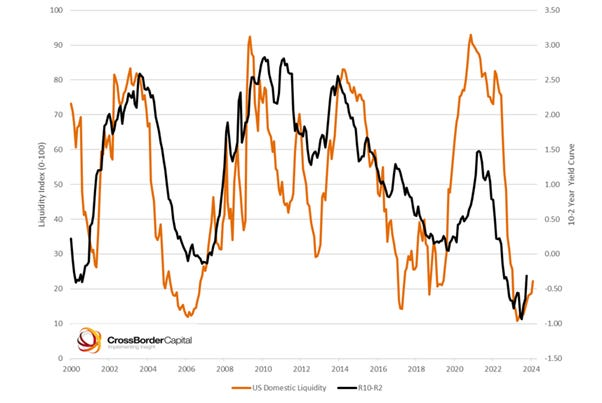
Global Net Liquidity Index
This indicator tracks central bank reserves, including those of the Federal Reserve. Global liquidity is currently in a consolidation phase, but the chart suggests a shift may be imminent.
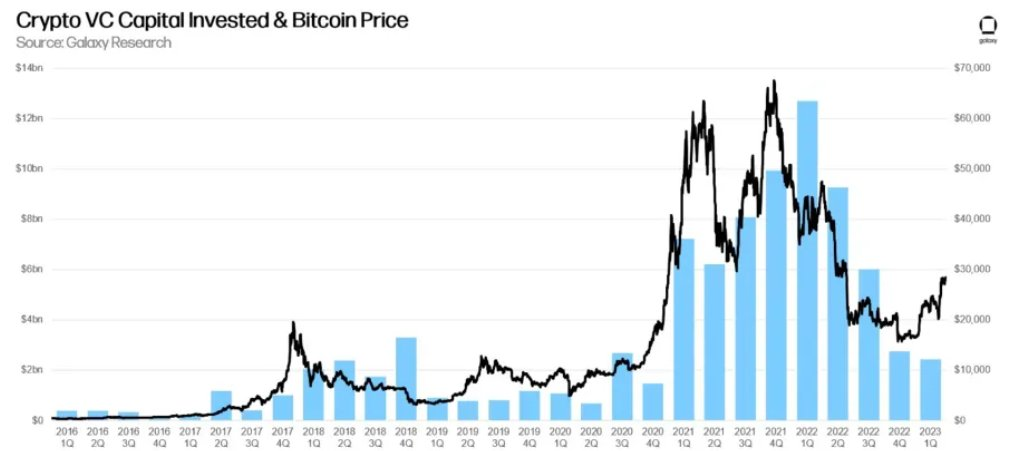
VC Investment
Venture capital funding in crypto projects reflects market sentiment. Funding peaked in 2021, aligning with the market top. Today, VC investment is down fourfold.
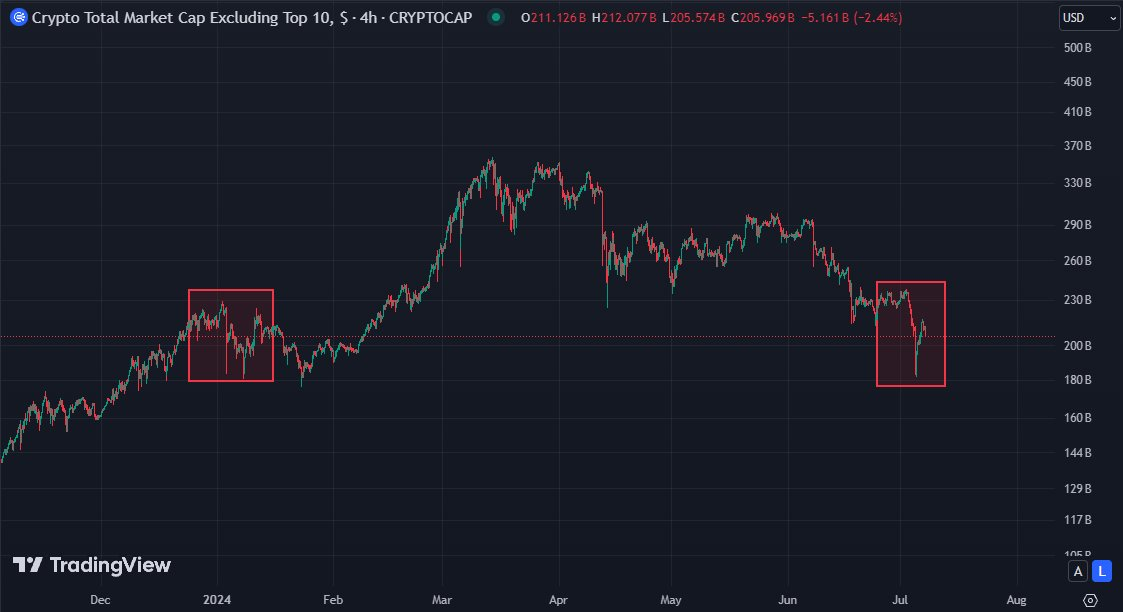
Total Market Cap of Cryptos (Excluding Top 10)
OTHERS/BTC—the market cap of all cryptocurrencies excluding the top 10—is a true reflection of the broader altcoin market. Currently, this ratio is even lower than in December 2023, indicating that the major upward move is still ahead.
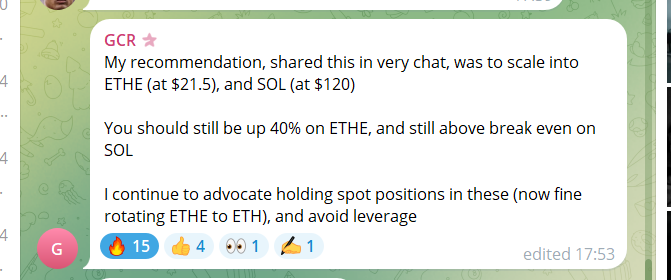
If you think believing this is crazy, remember—even GCR is bullish.
[Disclaimer] Markets involve risk. Investment should be made with caution. This article does not constitute investment advice. Readers should consider whether any opinions, viewpoints, or conclusions presented herein are suitable for their individual circumstances. Investing based on this information is at your own risk.
Join TechFlow official community to stay tuned
Telegram:https://t.me/TechFlowDaily
X (Twitter):https://x.com/TechFlowPost
X (Twitter) EN:https://x.com/BlockFlow_News