In-depth Research: The Subtle Relationship Between BTC Spot ETFs and CME's Massive Short Positions
TechFlow Selected TechFlow Selected
In-depth Research: The Subtle Relationship Between BTC Spot ETFs and CME's Massive Short Positions
It's no exaggeration to say that today's BTC futures market is no longer controlled by traditional cryptocurrency exchanges and retail investors, but has already fallen into the hands of U.S. institutional traders.
Author: Crypto_Painter
Recently, a slight sense of panic has emerged across the entire market, largely due to CME's massive short positions. As an old hand in the crypto space, I vaguely recall how the launch of BTC futures on CME back in 2017 effectively marked the end of that year’s epic bull run!
Therefore, analyzing these massive short positions on CME is highly significant.
First, let's go over some background:
CME refers to the Chicago Mercantile Exchange. It launched BTC futures trading at the end of 2017 under the ticker symbol 【BTC1!】. Following this, a large influx of Wall Street institutional capital and professional traders entered the BTC market, abruptly halting the ongoing bullish frenzy and ushering Bitcoin into a four-year bear market.
As more traditional capital continues flowing into the BTC market, institutional traders (such as hedge funds) and professional traders—CME’s core clientele—have become increasingly active participants in BTC futures trading.
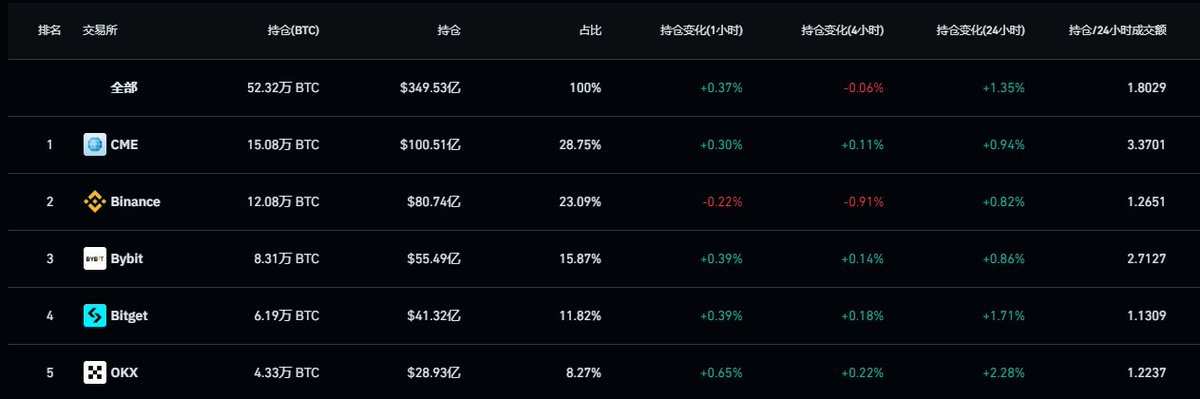
During this period, CME's futures open interest has grown steadily, successfully surpassing Binance last year to become the dominant player in the BTC futures market. Currently, CME holds a total BTC futures position of 150,800 BTC, worth approximately $10 billion, accounting for 28.75% of the entire BTC futures market share.
Thus, it’s no exaggeration to say that today’s BTC futures market is no longer controlled by traditional crypto exchanges and retail investors but has instead fallen into the hands of U.S. professional institutions.
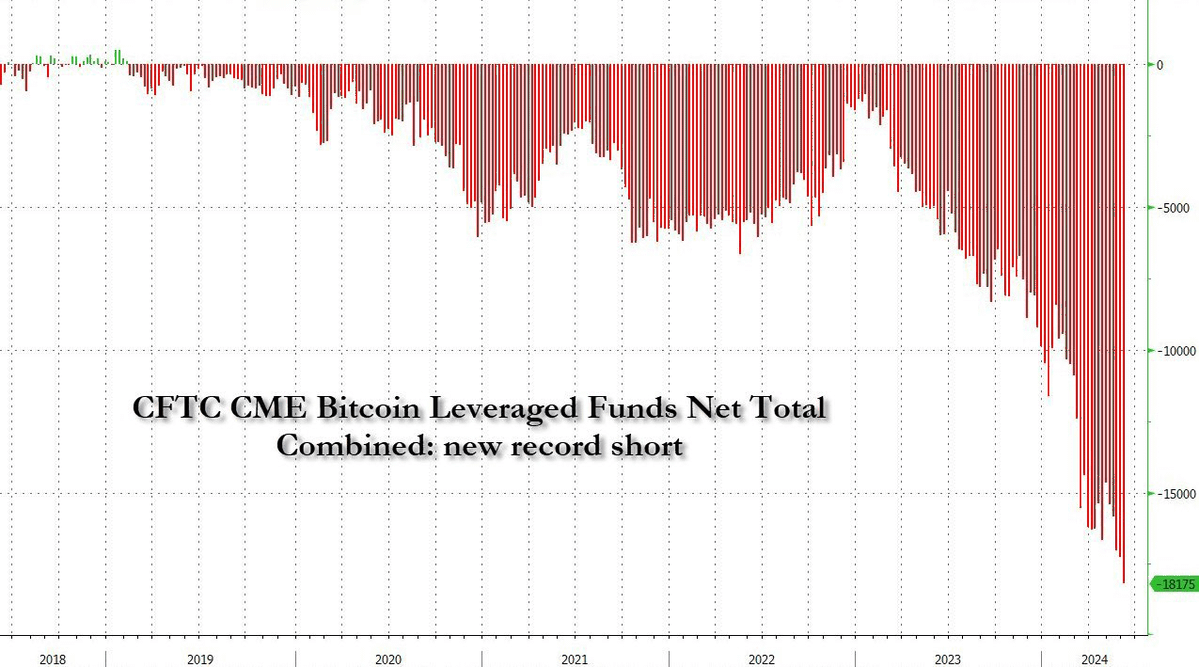
Recently, more and more people have noticed that not only has CME's short position increased significantly, but it has also recently broken historical highs and continues rising. At the time of writing this article, CME's short position has reached $5.8 billion, with no clear signs of slowing down yet.
Does this mean elite Wall Street capital is aggressively shorting BTC and completely pessimistic about the future performance of this bull cycle?
Judging purely from the data, it certainly seems so. Moreover, BTC has never before experienced such prolonged consolidation—over three months—after breaking its all-time high during a bull market. All signs suggest these large players may be betting that this BTC bull run will fall far short of expectations.
But is reality really that simple?
Next, I’ll explain where these massive short positions actually come from, whether we should truly be afraid, and what impact they might have on the bull market.
First, if you frequently check CME prices, you'll notice an interesting feature: the price of the BTC1! futures contract almost always trades at least several hundred dollars higher than the spot price on Coinbase. This makes perfect sense because CME's BTC futures are monthly expiring contracts, similar to front-month perpetual swaps on traditional crypto exchanges.
Therefore, when market sentiment is bullish, we often see varying degrees of premium on swap contracts—for example, next-quarter contracts typically carry very high premiums during bull markets.
If we subtract the Coinbase spot price from the CME BTC futures price (both quoted in USD), we get the following chart:
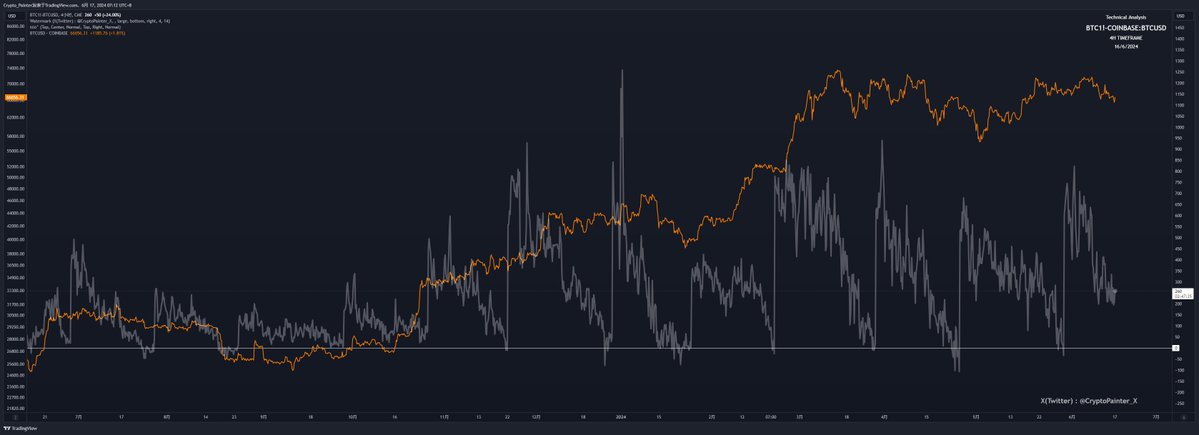
The orange line represents the 4-hour BTC price movement, while the gray line shows the premium of CME futures over Coinbase spot prices.
We can clearly see that the CME futures premium exhibits regular fluctuations corresponding to monthly contract rollovers (automatic migration to the next month’s contract). This pattern closely resembles the premium behavior of perpetual swaps on traditional crypto exchanges, which tend to start high upon contract creation and gradually converge toward zero as expiration approaches.
Thanks to this predictable behavior, certain forms of arbitrage between futures and spot become possible. For instance, when a quarterly contract launches on a CEX after a strong bull move and carries a 2–3% premium, one could allocate $2 million—buying $1 million worth of spot BTC while simultaneously opening a $1 million short position on the quarterly futures contract.
Regardless of price movements during this period, the short position is unlikely to be liquidated. By holding until just before contract expiry, when the premium has largely disappeared, one can lock in a nearly risk-free 2% return on the $1 million exposure—that is, $20,000 profit.
Don’t underestimate this return. For large funds, this represents a near-risk-free high-yield opportunity!
To illustrate further: CME rolls over a new contract roughly once per month. Since 2023, the average premium has been around 1.2%. Accounting for transaction costs, let’s conservatively estimate 1% per roll. That gives us a fixed 1% risk-free arbitrage opportunity every month.
With 12 cycles annually, this translates into approximately 12.7% annualized risk-free returns—outperforming most U.S. money market funds and far exceeding bank deposit interest rates.
Hence, currently, CME’s futures contracts serve as a natural arbitrage venue. But there remains one question: While futures can be traded on CME, where do institutions buy the corresponding spot BTC?
CME serves professional institutions and large players who cannot simply open an account on a CEX like retail users. Much of their capital comes from limited partners (LPs), so they must source BTC through compliant and legally recognized channels.
Ta-da! Isn’t it convenient? The BTC spot ETF has been approved!
And thus, the loop is closed: hedge funds or institutions buy heavily into U.S.-listed BTC spot ETFs while opening equivalent short positions on CME, executing a monthly risk-free arbitrage strategy yielding a stable annualized return of at least 12.7%.
This argument sounds both natural and logical—but we shouldn't rely solely on theory. We need data verification: Are U.S. institutional investors actually engaging in such ETF-CME arbitrage?
Consider the chart below:
On the chart, I’ve marked periods since the ETF approval when CME futures premiums were extremely low. Below is a sub-chart showing net inflows into BTC spot ETFs, based on my own calculations.
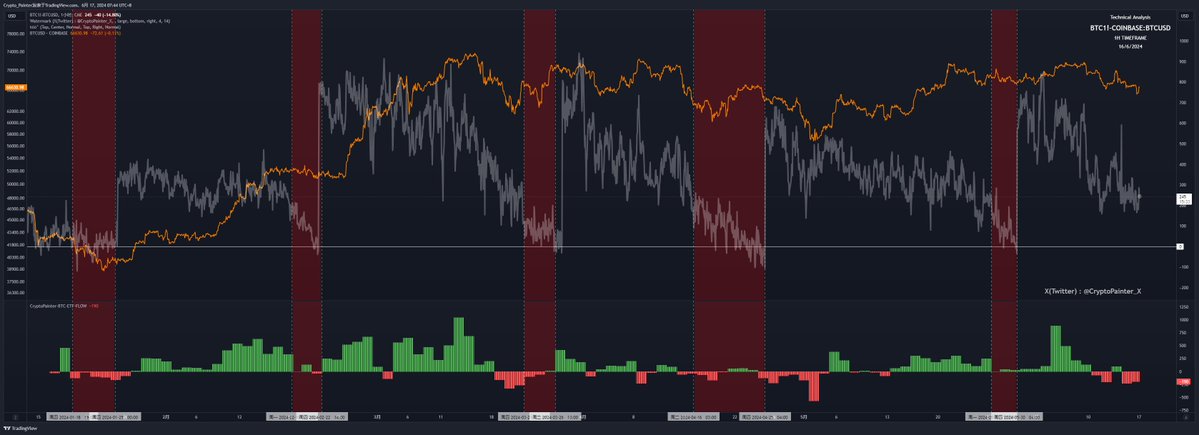
You can clearly observe that whenever the CME futures premium begins shrinking noticeably—falling below $200—the net inflows into ETFs also decline. Conversely, when a new monthly contract launches, substantial ETF inflows occur on the first Monday of the new contract’s trading cycle.
This suggests, to some extent, that a significant portion of ETF inflows aren’t purely speculative buys but are instead used to hedge against upcoming high-premium short positions on CME.
At this point, scroll back up and revisit the earlier chart showing CME’s growing short positions. You’ll notice that CME’s short positions didn’t begin surging—by over 50%—until after January 2024.
And guess what? BTC spot ETFs officially began trading in January 2024!
Based on this somewhat incomplete but compelling data analysis, we can draw the following conclusions:
1. A significant portion of CME’s massive short positions likely exists to hedge holdings in spot ETFs. Therefore, the actual net short exposure is probably much lower than the current $5.8 billion figure, meaning we don’t need to panic over this headline number.
2. Of the $15.1 billion in net ETF inflows to date, a considerable amount may be hedged, which helps explain why the second-highest daily ETF inflow in history ($886 million on June 6) and strong weekly inflows failed to push BTC prices significantly higher.
3. Although CME’s short positions contain substantial hedging activity, they had already begun rising before the ETF approval and did not experience major liquidations even as BTC rallied from $40,000 to $70,000. This implies that some U.S. institutional investors remain genuinely bearish on BTC, so we shouldn’t become complacent.
4. We need a new understanding of daily ETF net inflow data: Inflows may not always correlate positively with price. In fact, negative correlation is possible—large ETF purchases coinciding with BTC price declines.
5. Consider a special scenario: If, in the future, the CME futures premium is completely arbitraged away—eliminating any profitable spread—we would expect to see a sharp drop in CME short positions, accompanied by large outflows from ETFs. Should this happen, don’t panic—it simply reflects capital rotating out of BTC in search of new arbitrage opportunities elsewhere.
6. Final thought: Where does the premium in futures markets originate? Is the wool really being pulled over the sheep’s eyes? I may explore this topic further in future research.
That concludes this research summary. This piece leans more toward market structure analysis rather than offering direct trading signals, so it may not directly improve your trades. However, it’s helpful for understanding market mechanics. Frankly, when I first saw CME’s massive short positions, I got nervous too—even recalling the brutal 2017–2018 bear market...
That bear market was far worse than today’s choppy conditions. But thankfully, BTC is now gaining favor among traditional capital. To put it bluntly, the fact that hedge funds are willing to engage in arbitrage here is, in itself, a form of validation—even if the profits ultimately come from retail investors’ pockets. Ha.
Finally, if you’re skeptical about the uniqueness of this bull market, I recommend reading the referenced article “Is This Bull Market More Complex Than Previous Ones?” Combining it with this article offers deeper insights.
That’s all—thanks for reading!
Join TechFlow official community to stay tuned
Telegram:https://t.me/TechFlowDaily
X (Twitter):https://x.com/TechFlowPost
X (Twitter) EN:https://x.com/BlockFlow_News