Is this bull market's slower rise more complex compared to previous bull markets?
TechFlow Selected TechFlow Selected
Is this bull market's slower rise more complex compared to previous bull markets?
Not only is the growth slow, but liquidity is poor and there's also a lack of traffic.
Author: Crypto_Painter
This bull market:
1. Is rising slowly, failing to deliver the profit-making effect seen in previous bull markets;
2. Suffers from poor liquidity—most high-market-cap altcoins besides BTC haven't reached new highs;
3. Lacks public attention, with significantly lower social media engagement compared to past bull runs.
Let’s systematically analyze these three points.
1. Is this bull market slower than previous ones?
Is this bull market moving fast or slow? This is a technical question. Price momentum shouldn’t be judged solely by speed, but rather by sustainability.
For example, suppose a bull market lasts one year. If prices remain range-bound for the first 11 months and then surge 300% in the final month before peaking and entering a bear market, would you still call this a true bull market?
Despite the explosive final-month rally, such a pattern doesn’t reflect sustained market demand. It’s more indicative of orchestrated manipulation, commonly seen in small-cap altcoins, where the sole purpose is “pump and dump.”
For BTC, a genuine bull market should be a long-term, sustainable process characterized by continuous buying pressure and steadily rising prices—a sign of real, widespread behavior: buy, hold, and hold longer.
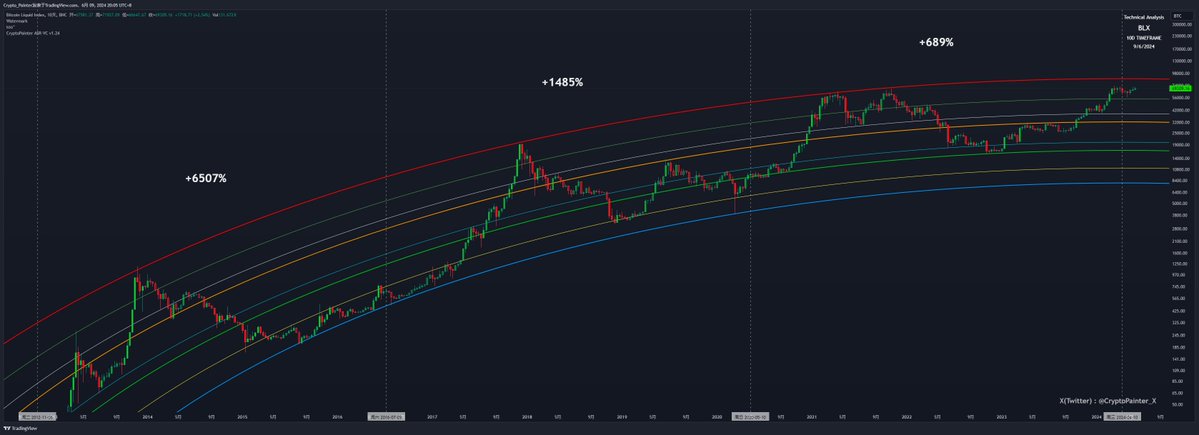
We can assess price momentum across three dimensions:
Duration of the bull market, total price appreciation, and momentum during the run-up.
As shown below:
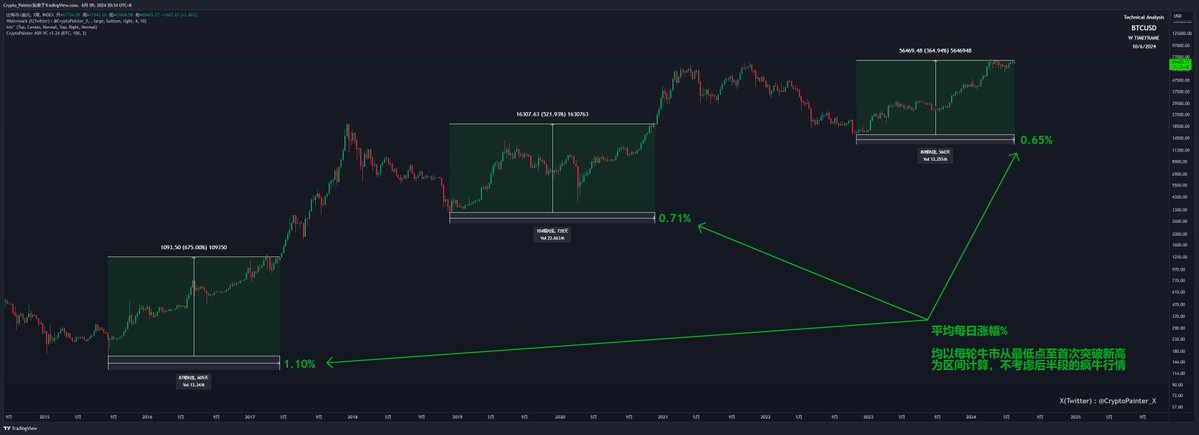
To fairly compare with the current cycle, I’ve calculated the average daily price increase (%) over structurally equivalent periods—the early buildup phase, defined as from the cycle low to just after breaking past the prior all-time high and consolidating near that level.
Dividing total price gain by the number of days reveals that the early-stage growth rate has indeed declined across the last three bull markets: 1.10%, 0.71%, and now 0.65% average daily gain.
That means, even if BTC immediately launches into a parabolic breakout today, its early-phase momentum will permanently remain weaker than the previous two cycles. And if BTC continues to consolidate, that 0.65% figure will only decrease further over time.
So yes, this bull market is undeniably slow.
Now let’s examine price momentum:
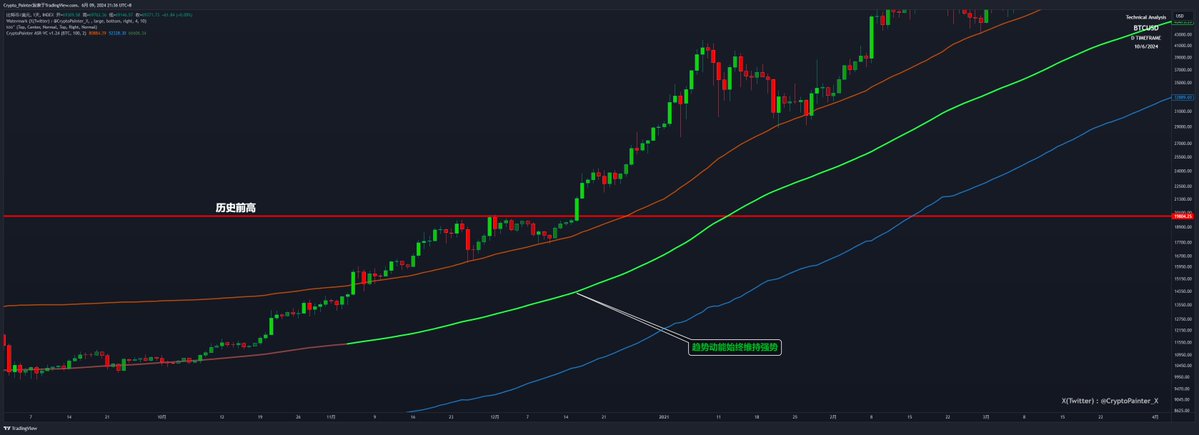
The three charts below show BTC’s ASR-VC trend indicator performance following its first new all-time high in 2017, 2020, and 2024 respectively:
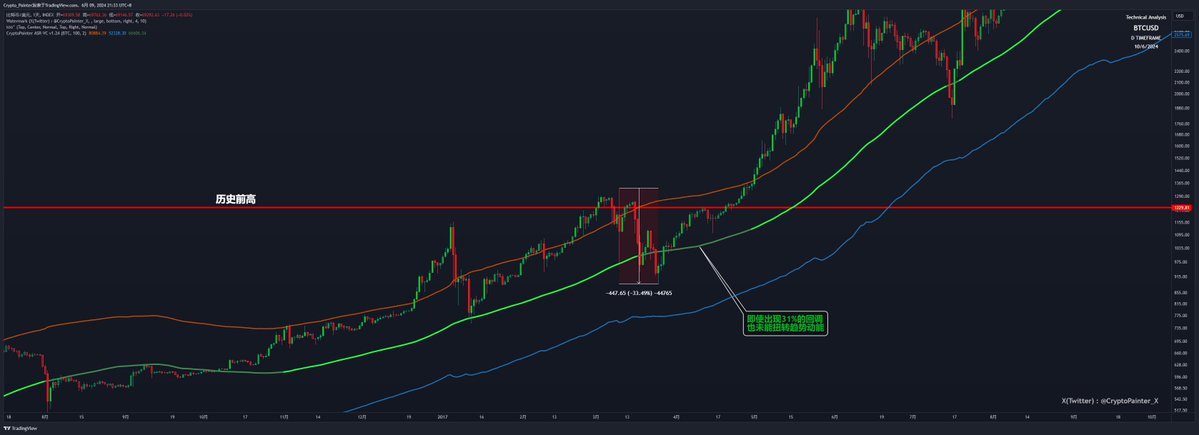
March 2017
December 2020
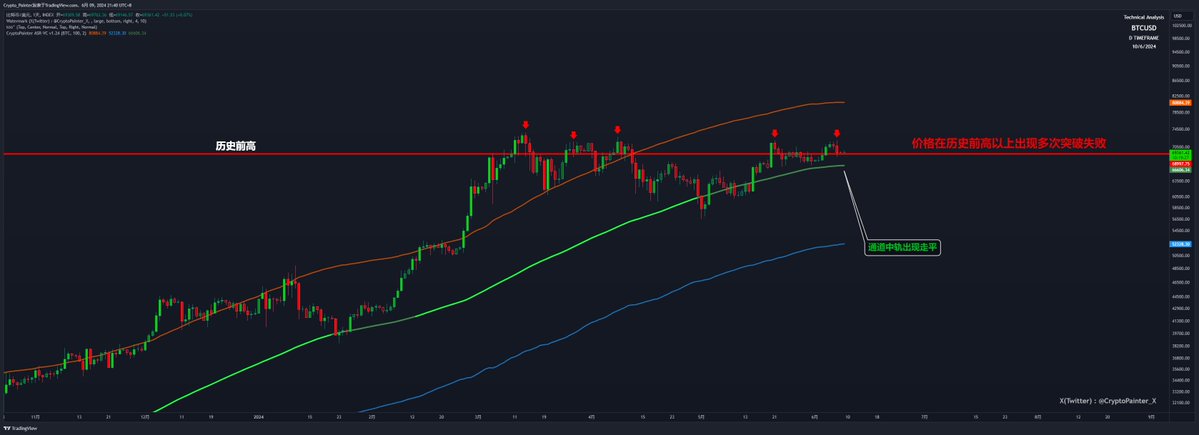
March 2024
At a glance, clear differences emerge.
After the first all-time high breakouts in 2017 and 2020, BTC saw significant pullbacks. But those corrections preserved the underlying uptrend strength—the green mid-band in the chart kept rising. In contrast, the current daily trend mid-band has nearly flattened—an unprecedented development.
Moreover, in prior cycles, BTC successfully broke out into strong bullish moves on the second or third retest of previous highs. Today, despite multiple retests, no such decisive breakout has occurred.
Conclusion: From a momentum perspective, the current bull market's early phase is far weaker than previous ones.
This doesn’t mean the bull market is over, but structurally, the foundation is weak—demand isn’t persistent enough, which explains why price has been stuck oscillating around previous highs for so long.
So what caused this weak foundation?
Next, let’s compare liquidity conditions!
2. Is overall liquidity in this bull market worse than in past cycles?
While overall liquidity levels don’t directly dictate price movements, they do determine the ceiling for price expansion.
We assess crypto market liquidity through two lenses: on-chain (on-exchange) and off-chain (macro) liquidity.
On-chain liquidity refers to assets already converted from fiat into stablecoins or cryptocurrencies—represented primarily by total stablecoin market cap.
Off-chain liquidity refers to global liquidity, specifically U.S. dollar net liquidity—measured as the Fed’s balance sheet minus Treasury General Account deposits.
First, let’s look at on-chain liquidity—stablecoin market cap during the past two bull markets. Since USDC and DAI launched later, we’ll start with USDT alone.
As shown below, to match the current BTC price hovering near all-time highs and preparing for breakout, we compare USDT market cap at similar stages: at prior cycle peaks versus just before the current potential breakout.
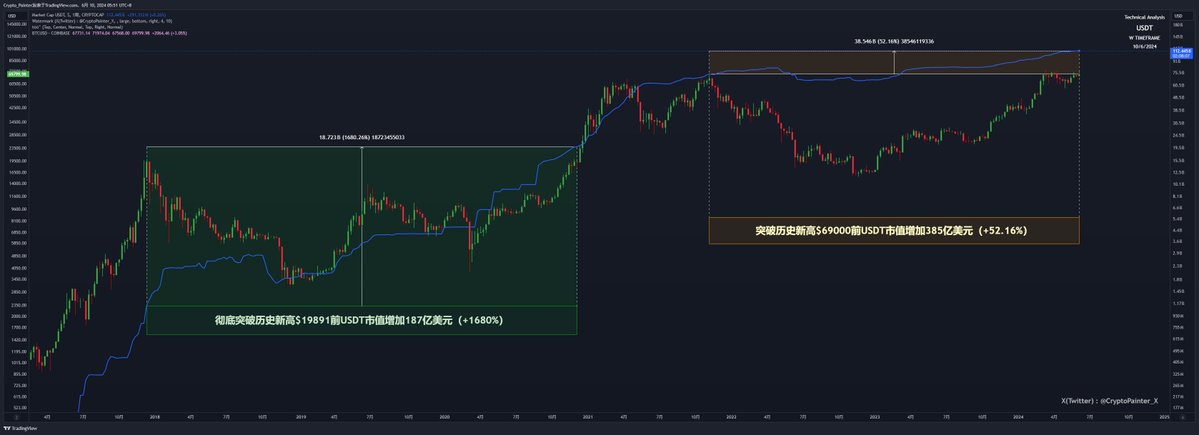
Before the last bull market decisively broke above $20,000, USDT’s market cap had already grown by $18.7 billion compared to its 2017 peak level. Simply put, when price returned to the same level, there was $18.7 billion more in USDT supply.
That extra $18.7 billion formed the foundational liquidity for the previous bull run. Adjusting for BTC’s different price levels, we also note that USDT’s market cap had surged 1,680% before the breakout.
Now consider the current cycle. Under the same conditions, USDT’s market cap has increased by $38.5 billion—but only up 52.16%. While the absolute increase is larger, BTC’s price level is entirely different.
Given that BTC’s all-time high is now much higher, the required liquidity to break it is proportionally greater.
Using a simple price ratio:
$69,000 / $20,000 = 3.45
$18.7 billion × 3.45 = $64.5 billion
To replicate the prior breakout strength, today’s USDT market cap would need to exceed its previous peak by $64.5 billion.
Currently, the additional $38.5 billion is insufficient. Therefore, relative to the last cycle, on-chain liquidity remains inadequate.
You might say, “Isn’t it misleading not to include other stablecoins?”
Fair point. Let’s now include USDT, USDC, and DAI, plus spot Bitcoin ETF inflows:
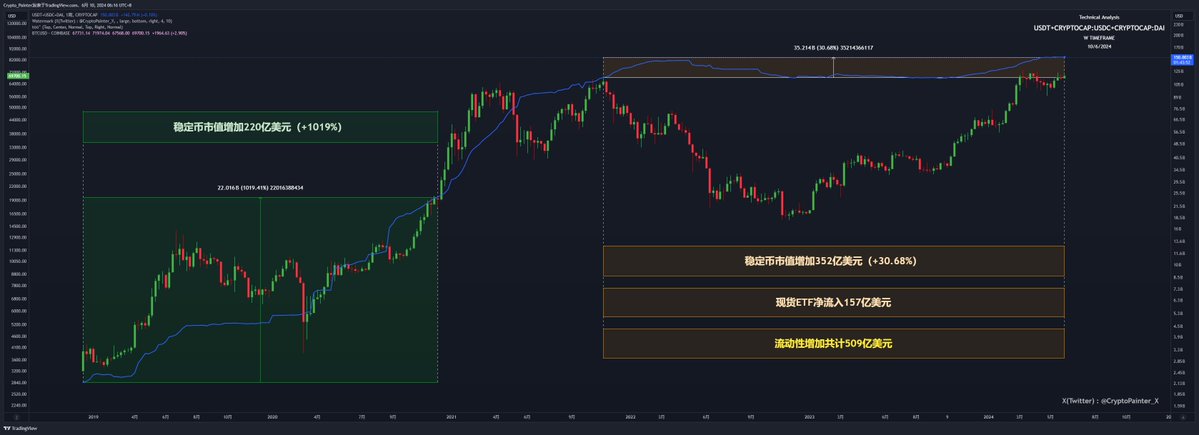
As shown, adding USDC, DAI, and ETF flows, total on-chain liquidity growth in this cycle reaches $50.9 billion.
In the prior cycle, pre-breakout liquidity growth was $22 billion.
Scaling accordingly:
$22 billion × 3.45 = $75.9 billion
Current liquidity accumulation: $50.9 billion
$75.9 billion – $50.9 billion = $25 billion
Thus, to replicate the previous breakout—where price consolidated briefly near ATH before surging—we’d need an additional $25 billion in liquidity.
Clearly, it’s this missing $25 billion that has kept the current bull market stuck in a sluggish, directionless consolidation for an entire quarter.
Yes, on-chain liquidity accumulation is indeed insufficient.
But does this shortfall make a breakout impossible?
Not necessarily. The key is whether liquidity can continue growing. For instance, if we enter another 3 months of consolidation, but during that time “stablecoins + ETFs + Hong Kong ETFs” generate over $20 billion in fresh inflows, we could smoothly break past all-time highs and escape this frustrating range.
However, the current situation is not optimistic. Stablecoin supply growth has stalled. Whether ETF inflows can sustain beyond a short burst remains uncertain.
The chart below shows stablecoin market cap trends and weekly ETF net inflows over the past three months:
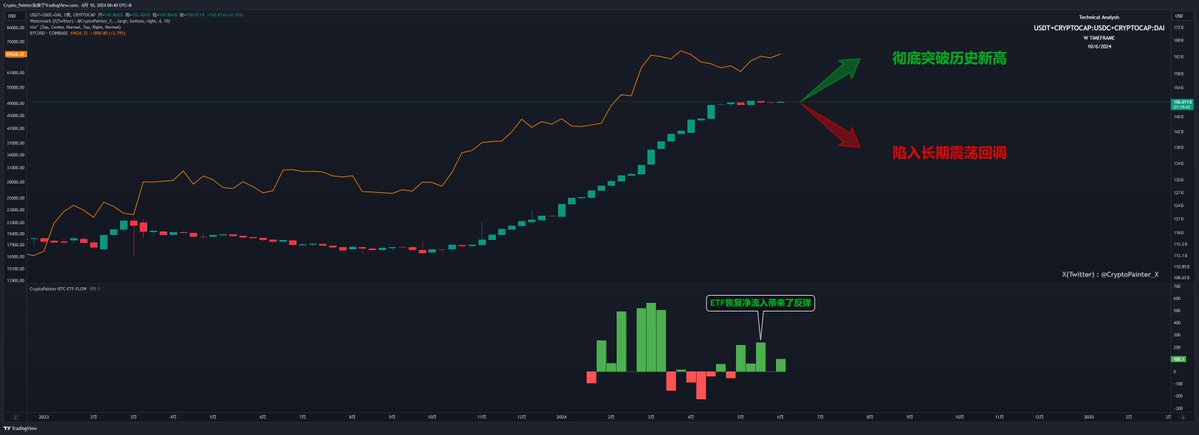
Clearly, total stablecoin supply has plateaued. Going forward, it may soon choose a direction. A sideways move is manageable, but shrinking stablecoin supply would pose a serious threat to this bull market.
Meanwhile, with stablecoin liquidity stagnant, recent ETF inflows have driven BTC’s gradual recovery—even without major changes in stablecoin supply.
You might wonder why BTC often enters extreme low-volume consolidation on weekends. The chart above explains it: on-chain stablecoin capital has completed its positioning. BTC price is now more influenced by ETF flows, which are active only during U.S. equity market hours.
Therefore, the most critical watchpoint now is whether stablecoin supply breaks out upward. A sustained rise likely signals long-term macro tailwinds, enabling BTC to finally break out of this range with sufficient incremental liquidity.
Conversely, if stablecoin supply declines, we’ll face prolonged consolidation or deeper correction. Simply put, BTC has advanced too quickly, arriving at the boss (ATH) only to find itself underpowered. It needs an extra $25 billion to level up. Unwilling to retreat, BTC is grinding nearby, farming experience until it can launch a final assault.
Conclusion: This bull market differs from past ones. It moved too fast early on, forcing it now to trade time for space. If it can hold this range long enough while liquidity gradually rebuilds, a breakout remains possible. But if the range breaks downward amid shrinking liquidity, the bull market could end prematurely.
Since we’re discussing macro, let’s now turn to off-chain liquidity—U.S. dollar net liquidity.
Due to complexity, I’ll limit this to a simple comparison:
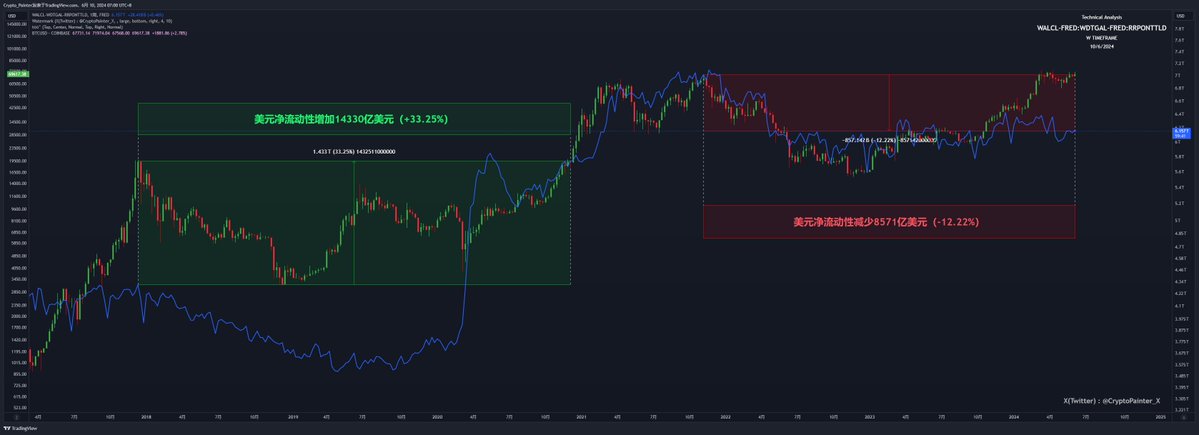
Using a similar comparison method, we see that during the last bull market’s final breakout, off-chain U.S. dollar net liquidity had increased by $1.433 trillion—up 33.25%.
In contrast, during the current cycle’s early stage, external dollar liquidity hasn’t grown—it has actually contracted by $857.1 billion, down 12.22%.
This neatly explains why on-chain liquidity accumulation pales in comparison to the last cycle: the external environment lacks abundant liquidity.
Yet, despite this, the blue dollar net liquidity curve has shown a choppy upward trend over the past year. So while overall liquidity is tight, it’s at least slowly improving recently.
Remarkably, BTC has still managed brief new highs in such a harsh macro backdrop. If during the last cycle, only 1.5% ($22B / $1.433T) of new dollar liquidity flowed into BTC, today’s share might be as high as 8.9% ($50.9B / ~$569.2B).
This suggests institutional confidence in BTC has reached a new level.
From this angle, this bull market is indeed different. Macro conditions are poor—like a class where everyone scored badly—but BTC still ranks in the top five. Especially impressive given Nvidia aced the test; BTC held up well.
That concludes our liquidity analysis. Now, the third point: media attention.
3. Is this bull market receiving less attention than past ones?
Short answer: Yes.
To crypto insiders and traders, BTC may seem like the global focus over the past two years. But data tells a disappointing story.
Below is YouTube viewership data over the past five years for all BTC-related channels. You can clearly see BTC’s peak moment was the 2021 bull market. Today’s run lags behind in both attention and topic热度.
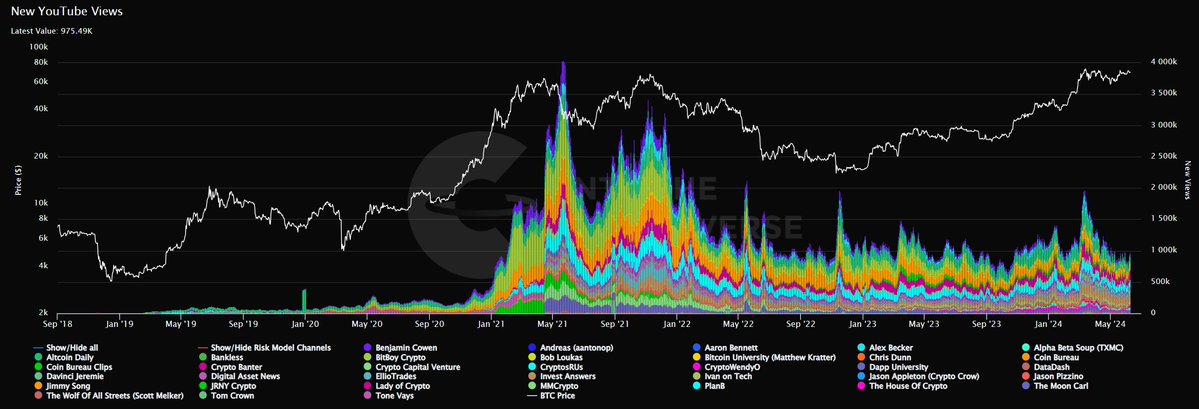
A sad truth: When BTC broke $69,000, its YouTube热度 was lower than during the FTX collapse.
However, if we compare attention at the moment of first ATH breakout, current levels are better than past ones. This implies that if BTC resumes a strong rally and pushes toward $100,000, dormant retail investors will return.
Conclusion: From a social media standpoint, this bull market isn’t fundamentally different. BTC has achieved常态化 presence. In today’s increasingly stock-like market, mass retail attention matters far less than in past cycles.
Alright~
That’s my full response to the question: “Is this bull market more complex than previous ones?” Writing nearly 10,000 words for a 15-character question is admittedly excessive!
Total writing time: 12 hours. Throughout, I continuously refined my analysis—especially on on-chain liquidity. I initially wrote a long section, realized the logic was flawed, deleted it all, recalculated, and almost gave up.
But I truly enjoy this research and charting process. You might not retain much after reading, but I’ve gained immense value from the journey—so I’m deeply satisfied!
That’s all!
Thanks for reading!
Join TechFlow official community to stay tuned
Telegram:https://t.me/TechFlowDaily
X (Twitter):https://x.com/TechFlowPost
X (Twitter) EN:https://x.com/BlockFlow_News