Interpreting the Consensys Research Paper: Is Ethereum Becoming Increasingly Centralized?
TechFlow Selected TechFlow Selected
Interpreting the Consensys Research Paper: Is Ethereum Becoming Increasingly Centralized?
Ethereum's degree of decentralization is dynamic and requires ongoing effort to maintain.
In the cryptocurrency space, Ethereum has become a focal point.
Decentralization is not only Ethereum’s core promise but also a primary source of its appeal. However, as Ethereum continues to upgrade and evolve, the community has begun questioning its true level of decentralization.
These concerns are not unfounded; scattered posts discussing "Ethereum becoming centralized" from various angles frequently appear.
Decentralization affects not only the distribution of power and control but also the network's censorship resistance, security, and transparency. Therefore, deeply understanding Ethereum’s actual degree of decentralization is crucial for investors, developers, and ordinary users alike.
To address these concerns, Simon Brown, a researcher at Consensys—the parent company of MetaMask—undertook an in-depth study. He adopted a rational, rigorous, and systematic approach, using multiple metrics and models for academic analysis aimed at revealing the real state of decentralization on Ethereum.
Given that the original paper is lengthy and requires some academic background, TechFlow Research has interpreted and organized the paper to help readers better understand its key arguments.
Original paper: “Measuring the Concentration of Control in Contemporary Ethereum”
I. Methodology: How to Measure Ethereum’s Degree of Decentralization?
Decentralization is a complex concept involving multiple dimensions. To accurately measure Ethereum’s level of decentralization, Simon Brown, the author of this paper, employed a range of statistical methods and indicators for comprehensive measurement.
First, he introduced the Gini coefficient—a statistical measure of inequality commonly used in wealth gap analysis.
Here, it is used to measure the distribution of resources or power within the network. The Gini coefficient ranges from 0 to 1, where 0 represents perfect equality and 1 represents complete inequality. For example, a Gini coefficient of 0.9 indicates a high concentration of resources or power within the network.
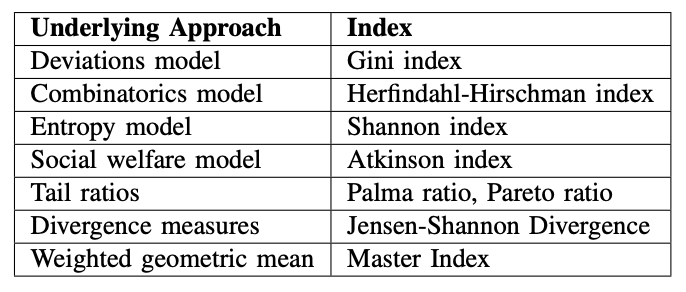
In addition to the Gini coefficient, researchers also considered the following:
HHI (Herfindahl-Hirschman Index): Commonly used to measure competition levels within specific industry sectors;
Shannon Index: Sensitive to both the size of distributions and the diversity of values within them, thus highlighting differences between distributions that the Gini index might miss;
Atkinson Index: Based on social welfare theory, estimating how much resource redistribution would be needed to achieve a certain level of equality;
Jensen-Shannon Divergence: Since we are interested in how decentralization levels change over time, this method measures the similarity or difference between two probability distributions (TechFlow note: colloquially speaking, whether Ethereum’s centralization level is similar or significantly different before and after a given point in time).
Nakamoto Coefficient: A metric measuring how many top entities control the majority of resources or power in a system. For instance, if the top five entities control more than 50% of resources, the Nakamoto coefficient is 5. This provides an intuitive sense of the influence held by major entities in the network.
The selection of these metrics and models was not arbitrary. They were carefully chosen to capture different aspects of decentralization from multiple perspectives. This multi-angle approach ensures comprehensiveness and accuracy in results, helping researchers gain a clearer understanding of Ethereum’s actual decentralization status.
II. Research Subjects: Which Metrics Best Reflect Ethereum’s Decentralization?
To deeply investigate Ethereum’s degree of decentralization, appropriate data and objects must first be selected—ones that represent key aspects of the Ethereum network and provide meaningful benchmarks for measuring decentralization.
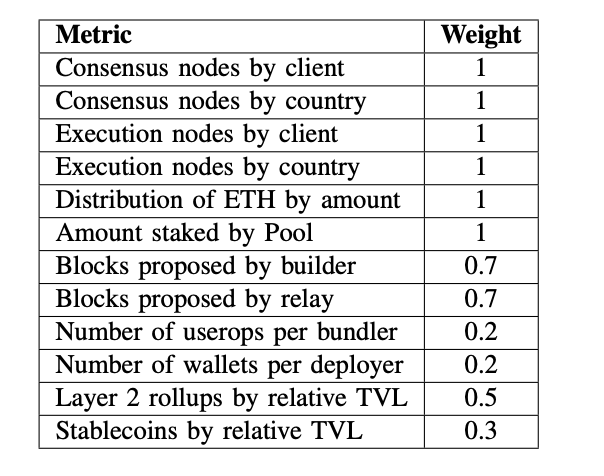
With Ethereum’s transition to PoS, along with emerging technologies such as MEV and account abstraction, this paper takes into account every stage and process involved in Ethereum transactions, summarizing the following suitable metrics for assessing its decentralization:
-
Based on the Original Nakamoto Coefficient:
-
Consensus nodes by client
-
Consensus nodes by country
-
Execution nodes by client
-
Execution nodes by country
-
Distribution of native asset by amount
-
Amount staked by pool / staking service provider
-
-
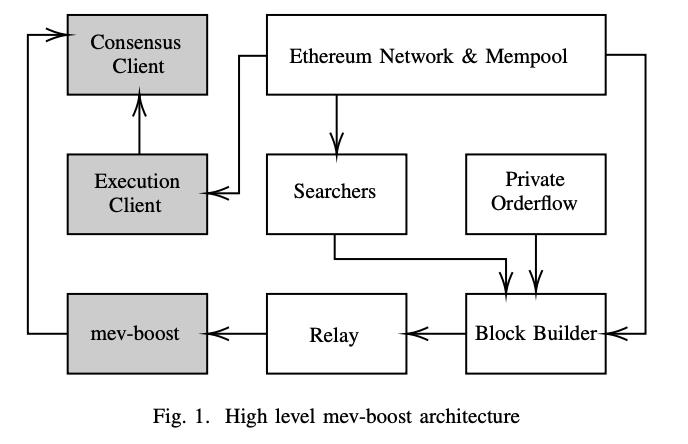
Metrics related to PBS:
-
PBS refers to blocks proposed by builders and relays, which play a critical role in the Ethereum network.
-
Blocks proposed by builder
-
Blocks proposed by relay
-
-
Metrics related to Account Abstraction:
-
Number of user operations per bundler
-
Number of wallets per deployer
-
-
Other metrics:
-
Effective inflation rate adjusted for burn
-
Percentage of total supply staked
-
Layer 2 rollups by relative TVL
-
Moreover, different metrics were assigned different weights.
III. Results and Interpretation: How Decentralized Is Ethereum?
The researcher observed Ethereum over a 90-day period, from May 23, 2023, to August 23, 2023. The overall research goal was to explore decentralization as a dynamic trait evolving over time within Ethereum, rather than a static, perpetually balanced one.
A. Discussion of Results
From the data below, it is evident that when the same dataset is applied to different indices, varying results emerge. Taking the Gini coefficient as an example:
-
Execution nodes by country: Gini coefficient of 0.85
-
Execution nodes by client: Gini coefficient of 0.74
-
Consensus nodes by country: Gini coefficient of 0.79
-
Consensus nodes by client: Gini coefficient of 0.57
-
Distribution of native assets: Gini coefficient of 0.91
-
Amount staked by pool / staking service provider: Gini coefficient of 0.76
-
Blocks proposed by builder: Gini coefficient of 0.78
-
Blocks proposed by relay: Gini coefficient of 0.54
-
User operations per bundler: Gini coefficient of 0.13
-
Wallets per deployer: Gini coefficient of 0.03
-
Layer 2 rollups by relative TVL: Gini coefficient of 0.87
These values are color-coded for readability, with colors closer to red indicating higher concentration and colors closer to green indicating greater decentralization.
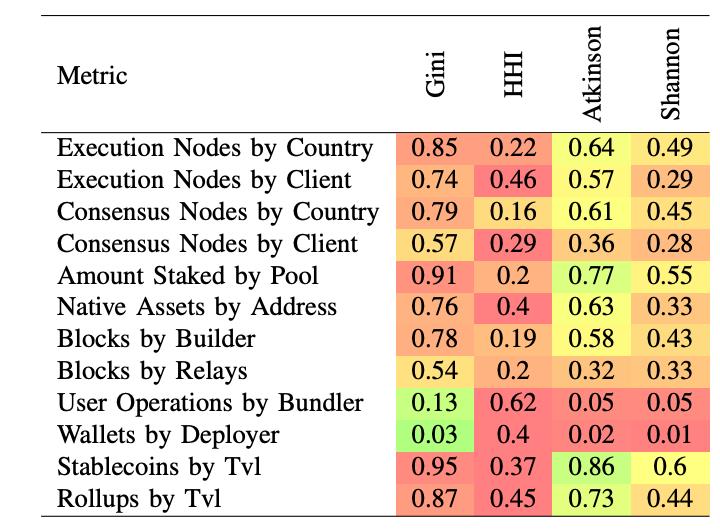
It is clearly apparent that Ethereum shows very high centralization in stablecoins and staking pools. This seems consistent with real-world observations—high market shares of USDC and USDT, and LDO leading in the liquid staking sector.
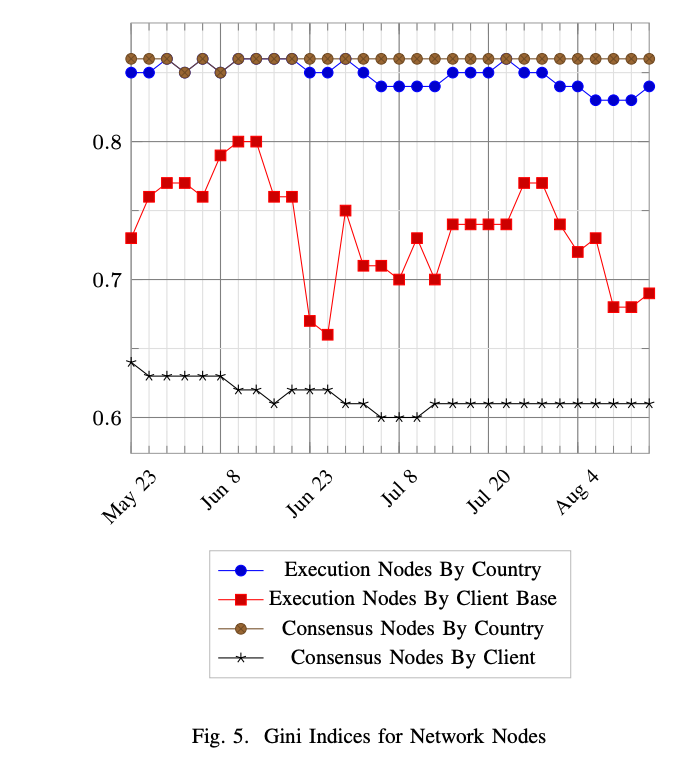
B. Results Based on Subsystem Selection Using the Original Nakamoto Coefficient
Network Nodes: When analyzing metrics based on the original Nakamoto coefficient subsystem, researchers first applied the Gini index to indicators related to network nodes (TechFlow note: the Nakamoto coefficient measures how many top entities control the majority of resources or power).
From this analysis, we observe that both “execution nodes by country” and “consensus nodes by country” maintained relatively high Gini coefficients of 0.85 and 0.79, respectively. This indicates a high concentration of these consensus and execution nodes within certain countries.
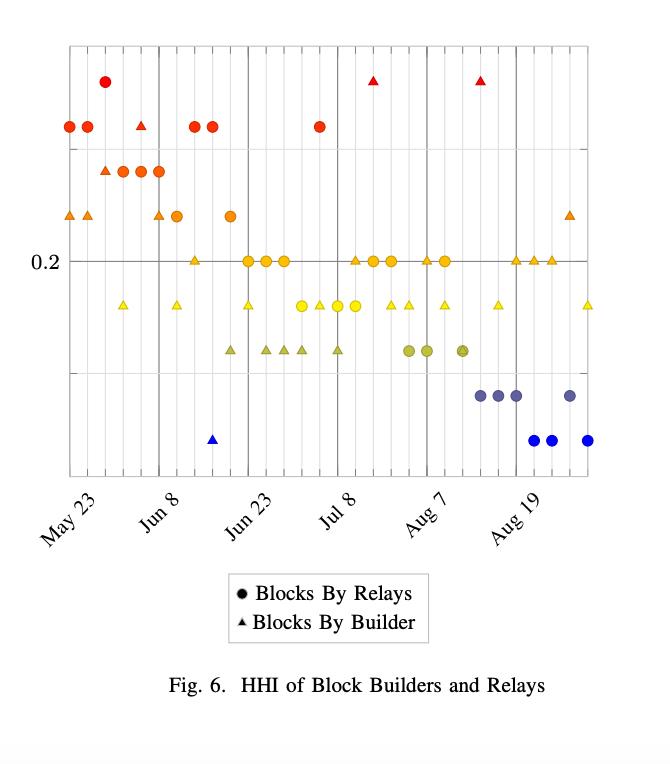
C. Metrics Related to PBS
PBS refers to blocks proposed by builders and relays. Data shows significant changes between the first and last 24-hour intervals of the dataset in the number of blocks proposed by individual builders and relays, as well as in overall market concentration. This implies that Ethereum’s level of decentralization increased during this period.
D. Other Metrics
When examining rollups by TVL, we observe a clear level of centralization, with a 90-day average Gini coefficient of 0.87. These figures make sense when reviewing the underlying data: a single rollup (Arbitrum One) holds 54.3% of all rollup TVL (down from 64.5% at the start of the sample), followed by Optimism with 25.9%. This means that despite the existence of multiple rollups, just two dominate the majority of the market share.
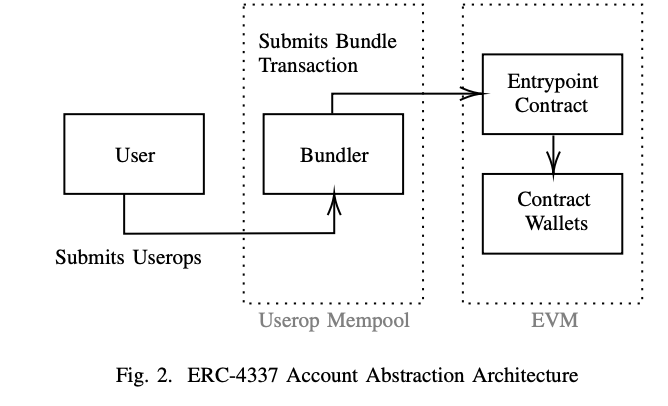
E. Metrics Related to Account Abstraction
This section focuses primarily on the impact of ERC-4337 bundlers. The data shows:
-
The 90-day Gini coefficient for user operations by bundler ranges from 0 to 1, with a median of 0.6 and standard deviation of 0.36.
-
One specific bundler holds 76% of the market share among 13 active bundlers.
These data indicate that the account abstraction space is still in its early stages, with infrastructure yet to see significant maturity or adoption. The impact of ERC-4337 bundlers on network decentralization is relatively limited, so even moderate centralization is acceptable at this stage.
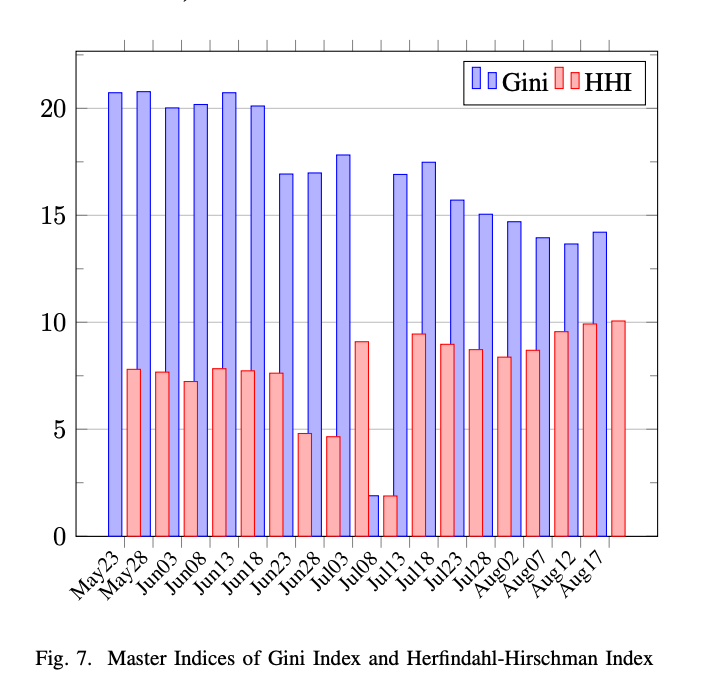
F. Main Index Reveals Overall Increase in Centralization
The main index provides a high-level metric for measuring how the overall network’s decentralization changed over time (May 23 – August 17, 2023).
The Gini coefficient across all measurement dimensions decreased from 21% to 14%, while the HHI index slightly increased from 7.5% to 10%.
-
Implications:
-
A decreasing Gini coefficient suggests increasing decentralization or reduced concentration.
-
An increasing HHI index suggests rising concentration.
-
-
Conclusion: Taken together, we can say that overall, Ethereum’s level of decentralization increased during this period.
IV. Overall Conclusions and Future Outlook
After thorough research and data analysis, the researcher reached the following conclusions regarding Ethereum’s degree of decentralization:
-
Ethereum’s decentralization is dynamic: Rather than being a static, perpetually balanced trait, decentralization evolves over time. As the Ethereum ecosystem develops and transforms, so does its degree of decentralization.
-
Different measurement dimensions show varying degrees of concentration: For example, classification of execution and consensus nodes by country versus client reveals different concentration patterns. This underscores the importance of using multiple approaches to assess decentralization.
-
Certain components exhibit high centralization: For instance, Arbitrum One and Optimism dominate the majority of market share among rollups by TVL, indicating clear centralization.
-
Sustained effort is required to maintain decentralization: The findings clearly show elements of concentrated control across the Ethereum ecosystem—potentially far more than the community might expect. This means continuous efforts are necessary to preserve a healthy level of decentralization.
Future Outlook
As the Ethereum ecosystem continues to evolve, its components and overall infrastructure will inevitably change. This means the community must continuously monitor and evaluate Ethereum’s level of decentralization to ensure its health and stability, taking necessary actions when needed.
Furthermore, as new technologies and solutions emerge, additional dimensions and methods may be incorporated into decentralization assessments. Researchers must continually update and refine their models to maintain accuracy and relevance.
Overall, decentralization is not just a technical challenge but a shared responsibility of the community and ecosystem. Only through sustained effort and collaboration can Ethereum’s decentralization—and its long-term success—be ensured.
Join TechFlow official community to stay tuned
Telegram:https://t.me/TechFlowDaily
X (Twitter):https://x.com/TechFlowPost
X (Twitter) EN:https://x.com/BlockFlow_News