TechFlow reports that on November 20, Material Indicators co-founder Keith Alan noted that Bitcoin’s 21-day simple moving average has crossed below its 200-day moving average, a move resembling a previous moving average crossover observed in 2023. In his analysis published on November 19, he predicted that the 50-day moving average would cross below the 100-day moving average before the end of this week.
A Bitstamp daily chart from Cointelegraph shows that in the snapshot captured at 17:15 Beijing Time on November 20, the 50-day moving average stood at approximately $77,684, below the 100-day moving average at $77,692. Two similar prior crossovers occurred between August and September 2023, after which Bitcoin retraced to test the ~$25,000 support level on September 11.
Alan emphasized that a single historical instance is insufficient to validate this as a reliable pattern, nor should it be used to forecast similar upside or downside moves, but the timing, position, and candlestick characteristics of both sequences share clear similarities.
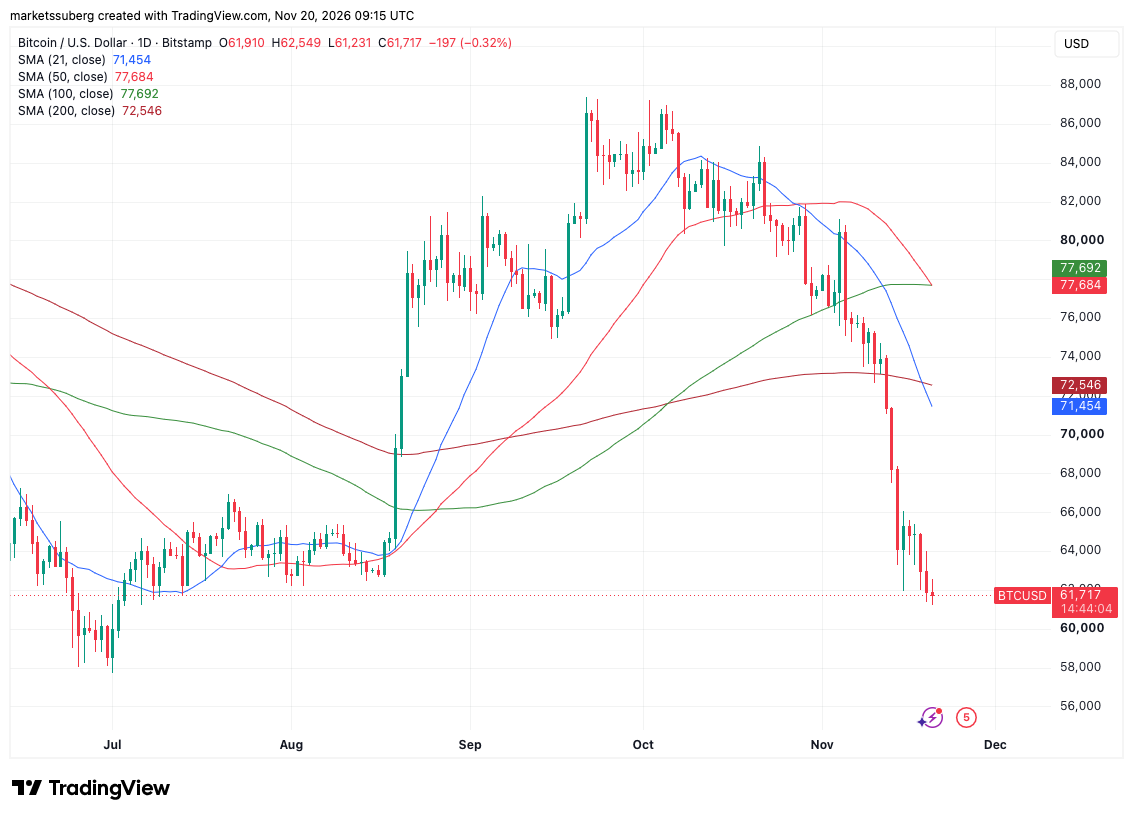
Image source: Cointelegraph/TradingView; Bitstamp daily chart, snapshot at 17:15 Beijing Time on November 20