

Michael Howell, the father of global liquidity: The expansion cycle is about to peak, you must hold both Bitcoin and gold
TechFlow Selected TechFlow Selected
Michael Howell, the father of global liquidity: The expansion cycle is about to peak, you must hold both Bitcoin and gold
In the face of inevitable long-term monetary inflation, Bitcoin and gold are the only two remedies. Don't treat it as a choice—have both.
Compiled & Translated: TechFlow
Guest: Michael Howell, global liquidity expert & originator of the concept of "global liquidity"
Host: Ryan Sean Adams
Podcast source: Bankless
Original title: The Real Crypto Cycle: What Happens When Global Liquidity Peaks
Air date: November 24, 2025
About the guest: Who is Michael Howell?
Michael Howell is a globally recognized authority on “global liquidity” and current Managing Director at CrossBorder Capital. With over 30 years of experience in financial markets, his core insights originated from his tenure as head of research at the legendary Wall Street investment bank Salomon Brothers during the 1980s.
There, rather than relying on traditional economics textbooks, he gained a profound insight by observing the vast trading floor: asset prices do not rise or fall based on economic fundamentals, but on the flow of money.
This discovery led him to create the Global Liquidity Index (GLI), covering 90 countries, which has become the most robust market indicator for monitoring central bank easing, debt refinancing, and capital flows.
For investors seeking to understand “where money comes from and where it goes,” Howell’s analysis is essential macroeconomic scripture.
Key Takeaways
Global liquidity expert Michael Howell brings over 30 years of professional experience. He formerly served as head of research at Salomon Bros and pioneered the concept of “global liquidity.”
In this episode, he dives deep into a core driver of asset price movements: a 65-month cycle of global liquidity and debt refinancing. This cycle is the key force behind market booms and busts and has fueled the recent "everything bubble."
During the interview, he analyzes the upcoming peak in debt maturities, rising stress in the repo market (repo stress), and the policy shift from Federal Reserve quantitative easing (QE) to "Treasury QE." He also explores the competition between the U.S.-led dollar stablecoin system and China's gold-backed capital strategy.
Additionally, he examines how these trends may impact Bitcoin, gold, and equities, and offers advice on optimizing investment strategies as the current economic cycle enters a turning phase.
Highlights Summary
-
The truth about the financial system: We live in a world of "debt refinancing"
-
Liquidity over fundamentals: Capital markets no longer play their traditional role of financing investment, but have evolved into a system centered on debt refinancing. Approximately 70%-80% of transactions are for rolling over debt, not funding new projects.
-
The 65-month cycle: Global liquidity follows a roughly 65-month cycle, closely aligned with the average maturity of global debt (about 64 months). The cycle is currently in its downward phase—this is the underlying reason for recent market weakness.
-
Warning signs from the repo market: In the short term, monitoring dynamics in the repo market over the next 3–6 days provides a better crisis predictor than GDP growth. The current widening of repo spreads signals systemic stress.
-
On monetary war: U.S. stablecoins vs. Chinese gold
-
Fragmentation of the global monetary system: The world is splitting into two blocs: one built on a digital dollar system based on U.S. Treasuries + stablecoins, and another being built by China on a monetary discipline system backed by gold.
-
China’s gold strategy: The PBOC’s massive gold purchases and tolerance for higher gold prices are essentially hedging against risks in the dollar system and attempting to build a new mechanism of monetary trust.
-
Technology vs. resources: This is a capital cold war between American technology (crypto/stablecoins) and Chinese hard assets (gold/industrial capacity).
-
Bitcoin and gold: Not either/or, but both are essential
-
Optimal hedge portfolio: Faced with inevitable long-term monetary inflation (annual debt growth ~8%), Bitcoin and gold are the only two viable solutions. Don’t choose—hold both.
-
Interesting correlation: Bitcoin combines the beta (risk appetite) of “NASDAQ tech stocks” and the alpha (currency hedge) of “gold.” They are negatively correlated in the short term (substitution effect), but positively correlated in the long term (joint resistance to fiat depreciation).
-
Valuation logic: Around 40%-45% of Bitcoin’s drivers come from global liquidity, 25% from its gold-like properties, and 25% from risk appetite.
-
Investment timing and strategy
-
Current opportunity: As markets gradually enter a weak phase (rising repo stress, liquidity withdrawal), this is an ideal window to allocate into Bitcoin and gold—not a time for panic.
-
Long-term trend: Regardless of short-term volatility, policymakers have only one path forward: printing money to manage debt. AI may bring technological transformation, but it won’t alter cyclical valuation adjustments or prevent the long-term fate of currency devaluation.
Global Liquidity: A Theory of Everything?
Ryan: Welcome, Michael Howell. Thank you for joining us—it’s an honor to speak with you. Today we’d like to explore markets through the lens of global liquidity.
You’ve said global liquidity is a key variable driving cycles, crises, and changes in asset prices—especially many dynamics in crypto. Could you start from the basics? Can global liquidity really be seen as a “theory of everything”?
Michael:
I wouldn’t say it’s absolutely a “theory of everything,” but it comes very close. The important question is: why is global liquidity so critical? Why is the flow of money the key to understanding today’s asset prices?
My early insight came from working at the U.S. investment bank Salomon Brothers. The firm was a major player in international bond markets, known for strong trading capabilities and broad market influence. Salomon was famous not just for research but also for having a large trading floor designed to let people visually track money moving between desks. I worked in the research department with a view overlooking the London trading floor—a massive space. This was in the late 1980s to early 1990s.
By watching the floor, I saw that money flows were real-time and dynamic. Salomon operated under the principle that no event in financial markets is insignificant—if one desk shouts “buy,” another across the floor might shout “sell.” These flows weren’t confined to one room—they could stretch across the globe. As an international fixed-income broker, Salomon could almost instantly track cross-border capital movements. This experience taught me the profound impact of capital flows on markets.
Henry Kaufman, then head of research at Salomon, published an annual report called “Outlook for Financial Markets,” detailing inflows and outflows in U.S. financial institutions and securities markets. This approach differed sharply from textbook economics, which often relies on mathematical models and yield comparisons. In reality, asset prices are driven more by supply and demand, with capital flows as the key variable. This became the foundation of our later work.
Today, our team focuses on tracking cross-border capital flows and developed the Global Liquidity Index (GLI)—a composite measure of global financial liquidity. We’ve worked in this field for nearly three decades and know the data intimately. GLI covers 90 countries and aims to be the authoritative source on global liquidity.
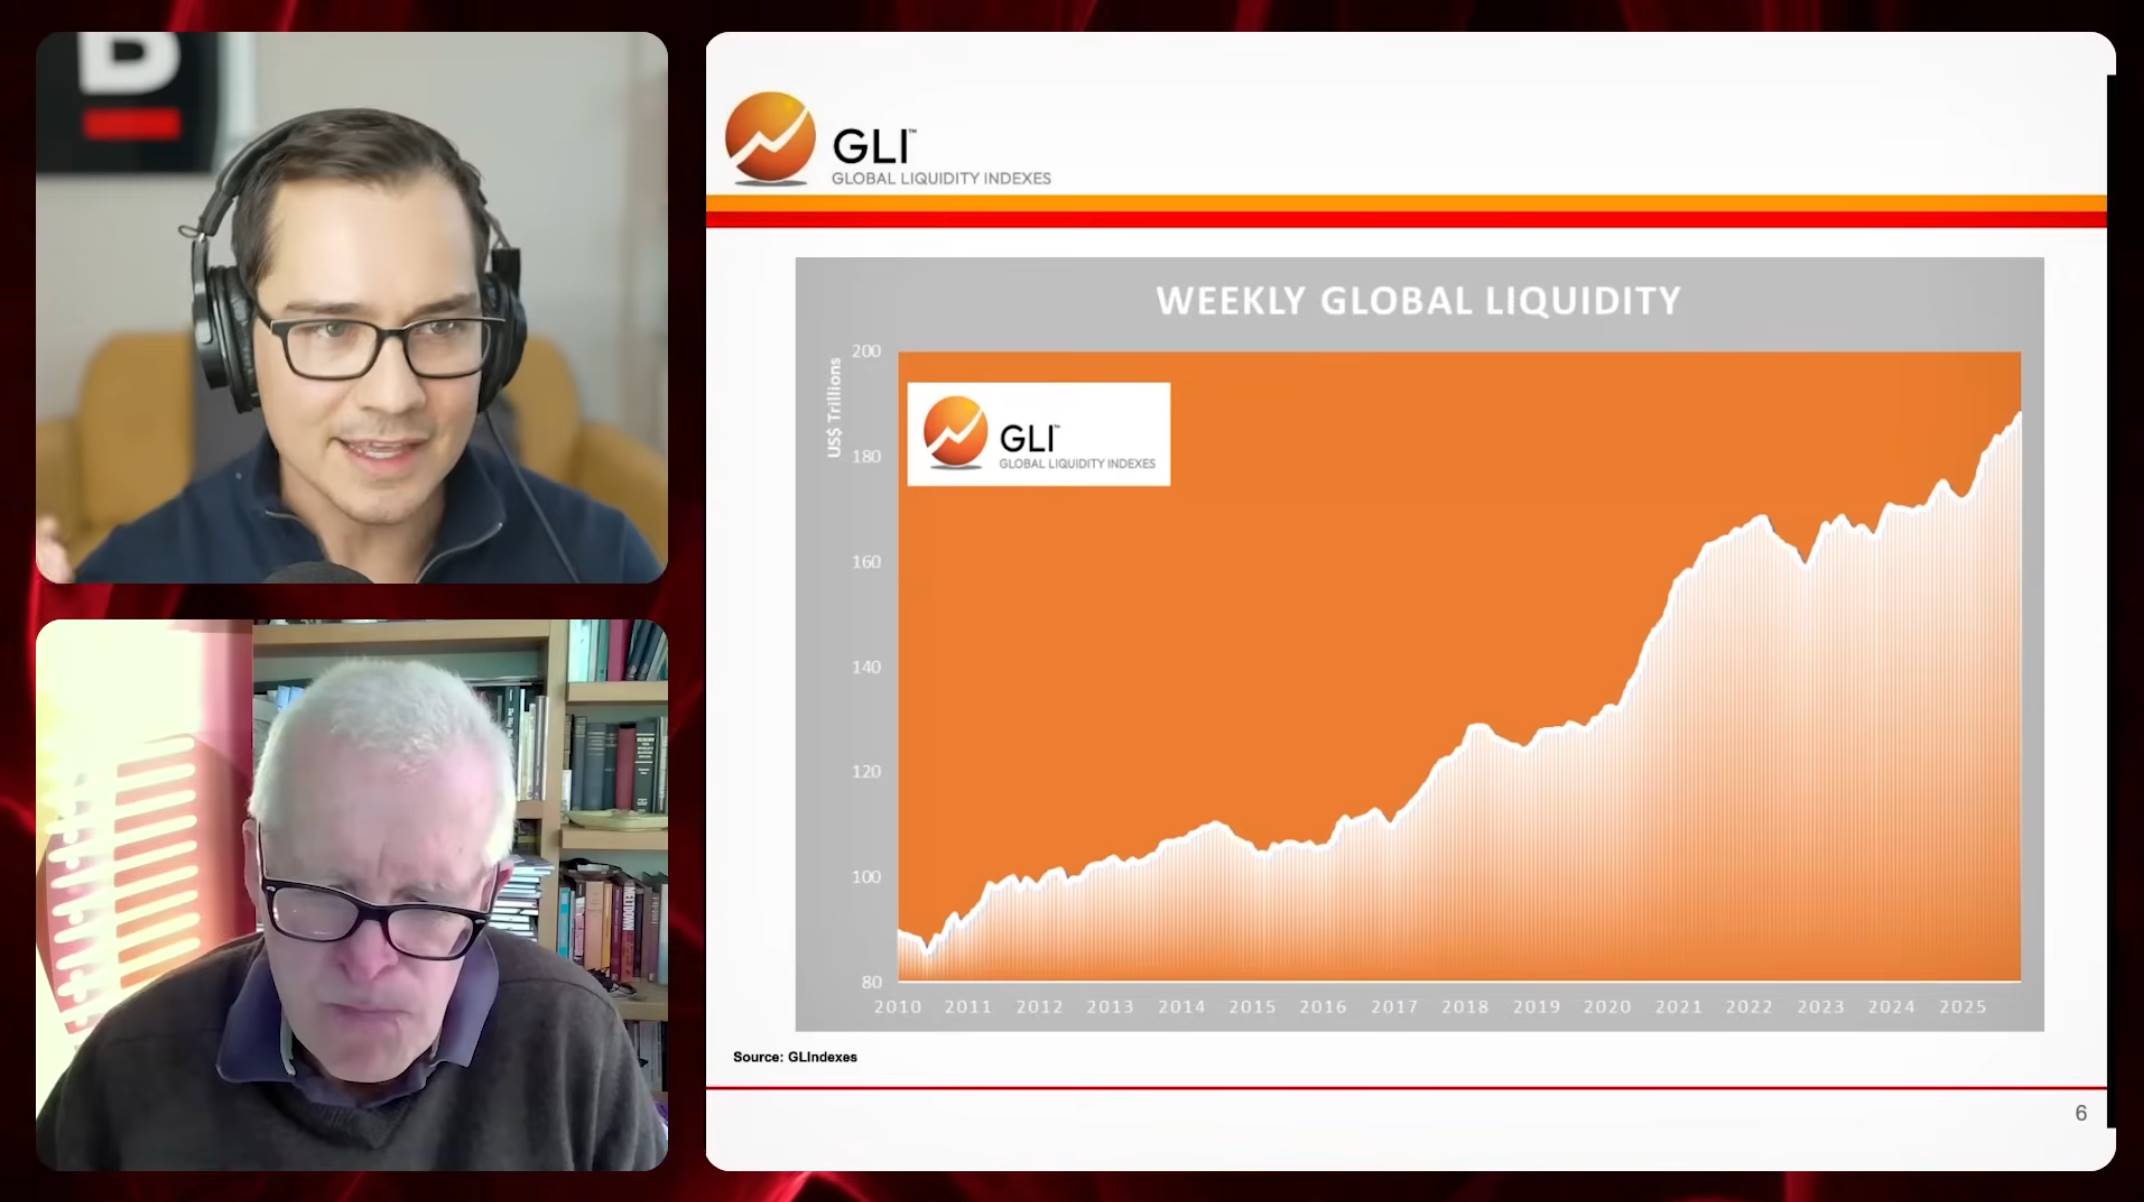
Ryan: The Global Liquidity Index (GLI) tracks weekly global liquidity trends since 2010. For those who can’t see the chart: in 2010, weekly global liquidity was about $100 trillion, now nearing $200 trillion—almost doubled. What does this chart actually tell us? What exactly is global liquidity? Where does it come from? And what can we learn from it?
Michael:
Global liquidity refers to the flow of funds within financial markets, distinct from traditional measures like M3 or M2. Our definition starts at the boundary of traditional money supply, focusing specifically on financial market liquidity, not real economy liquidity. For example, money in bank deposit accounts falls under M2, but these are peripheral to the financial system. We focus on the core: repo markets, shadow banking, and international securities markets. These are the flows that drive asset prices, which is why we monitor them closely.
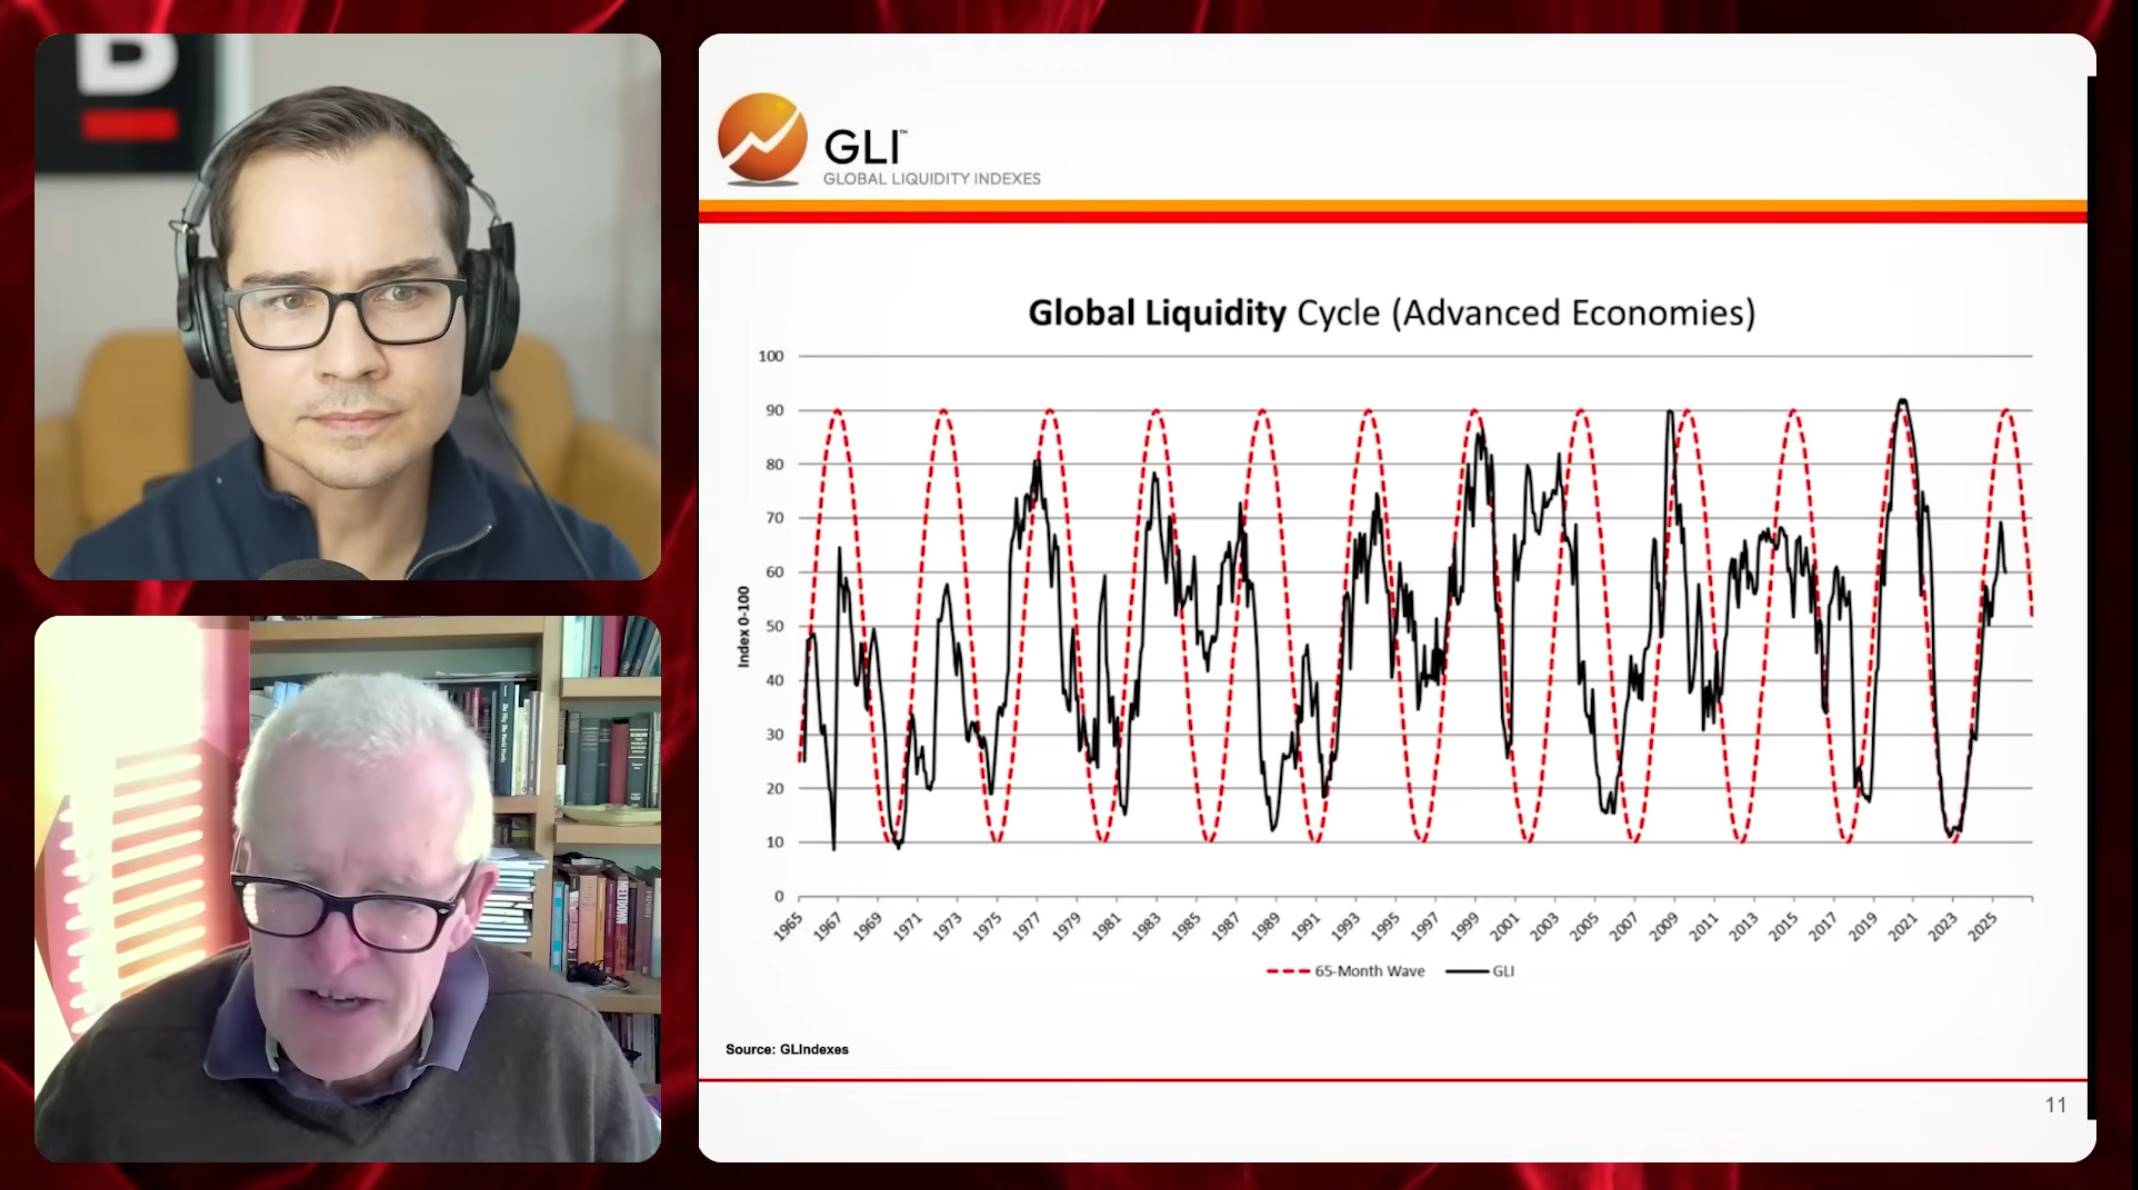
The chart shows the level of global liquidity in USD terms, aggregating data from about 90 countries. Major contributors include China, the U.S., the Eurozone, and Japan, while smaller nations have less impact. From this, we observe liquidity cycles. We use the “global liquidity cycle” to measure momentum in liquidity, quantified using Z-scores of liquidity growth rates. Fifty represents the long-term trend, around which data fluctuates, reflecting momentum shifts.
Data goes back to the mid-1960s, with our database starting then and updated in real time from the late 1980s. The black line represents current momentum, while the red dashed line is a sine wave model we added in 2000, illustrating a stable 65-month cycle.
We can discuss this cycle from two angles. First, its robustness. Recently, some cyclical research firms requested our data and found perfect alignment between our 65-month cycle and their findings. This consistency reinforces confidence in the cycle’s reliability. Second, why 65 months, not 50 or 100? We believe this cycle reflects the rhythm of debt refinancing in the global economy. Today’s debt capital markets focus far more on rolling over existing debt than raising new capital for investment.
The cycle closely matches the average maturity of global debt. Data shows the average debt maturity in the global economy is about 65 months (~64 months). Thus, this cycle may be an intrinsic feature of the system. According to the chart, the debt refinancing cycle hit bottom in October 2022 and was expected to peak by late 2025. Current trends show the cycle entering a downward phase.
Of course, we can’t be certain about future direction—whether the cycle will reverse and rise again. But current conditions suggest tighter liquidity is more likely. Importantly, there’s an inverse relationship between real economy and financial market flows. If the real economy gains momentum, capital may exit financial markets, pressuring asset prices. Strong global liquidity growth typically requires two conditions: ongoing central bank injections and relatively weak real economic growth. Neither condition holds today.
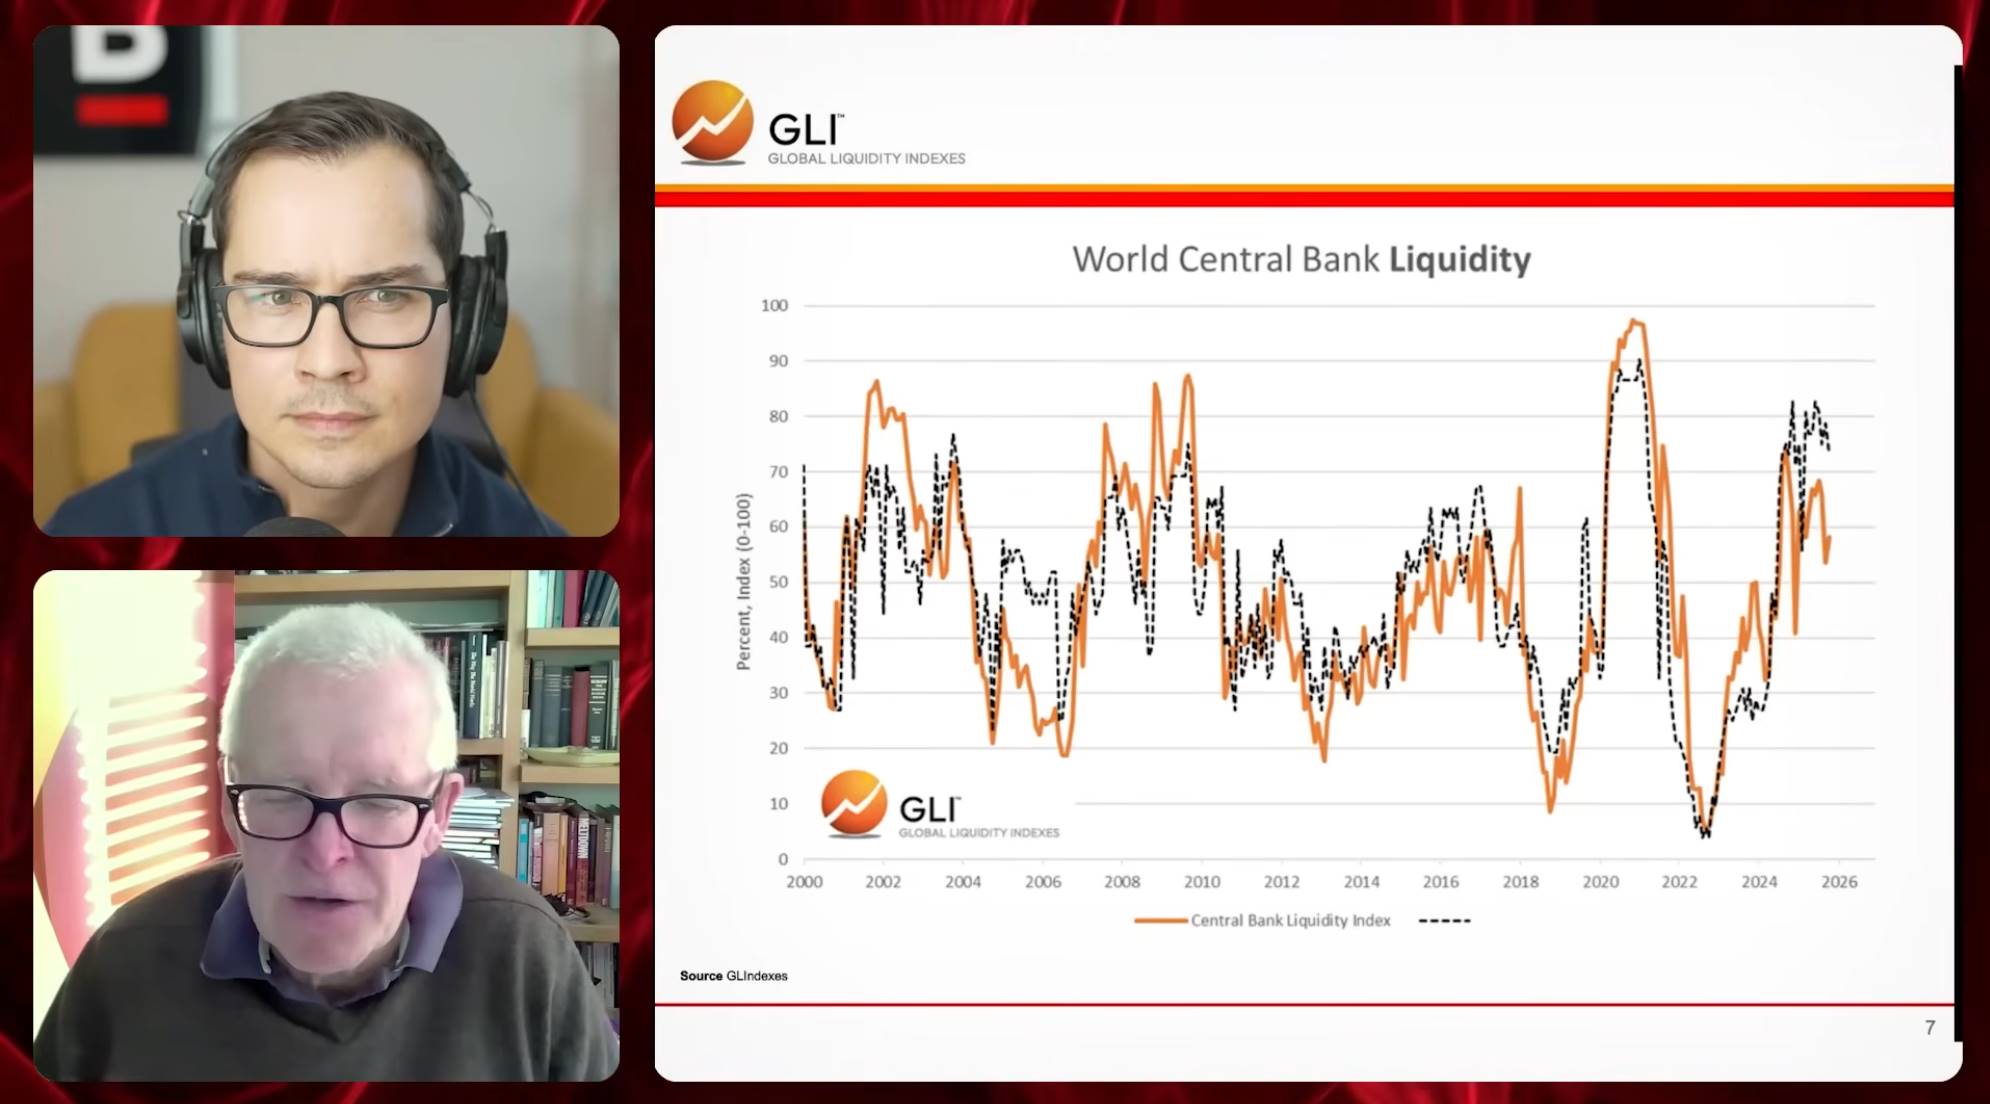
We can also examine a chart showing global central bank liquidity trends. This index tracks central bank action momentum, with the orange line as a weighted aggregate—dominated by the U.S. Federal Reserve. The black dashed line shows the proportion of central banks globally pursuing easing versus tightening policies. Currently, about 70% remain in easing mode, but this share is declining, with a clear inflection point emerging—helping us locate the current cycle stage and possible trajectory.
Will Global Liquidity Rise Forever?
Ryan: I’d like to dig deeper into the Global Liquidity Index. Why does it always trend upward? We know there are embedded cycles, but global liquidity seems to be in a long-term supercycle. What drives this persistent rise? Is it always this way, or could it reverse at some point?
Michael:
An excellent question. I think this traces back to liquidity’s role in markets. In a debt-dominated world, liquidity primarily serves to roll over or refinance existing debt to meet maturity pressures. Historical data shows that 70% to 80% of major transactions in financial markets are debt refinancing, not new capital raising. This is fundamentally different from textbook economics, where capital markets mainly fund investment projects. That model has changed.
Take AI investments today—they’re an exception, but such funding often comes from big tech cash flows or fiscal reserves, not capital markets. In China, the world’s largest capital investor, funding comes largely from state support, not capital markets. Capital markets no longer fulfill their textbook role. Many old-model indicators and theories no longer apply—we need a new perspective: a financial system centered on debt refinancing.
I can further illustrate this with a slide called the “debt liquidity cycle.” It reveals the core logic of the financial system and explains its evolution since the 2008 global financial crisis. At its center is the so-called “debt liquidity nexus”—the core mechanism of modern finance. As I keep emphasizing, the primary function of modern finance is to support debt refinancing.
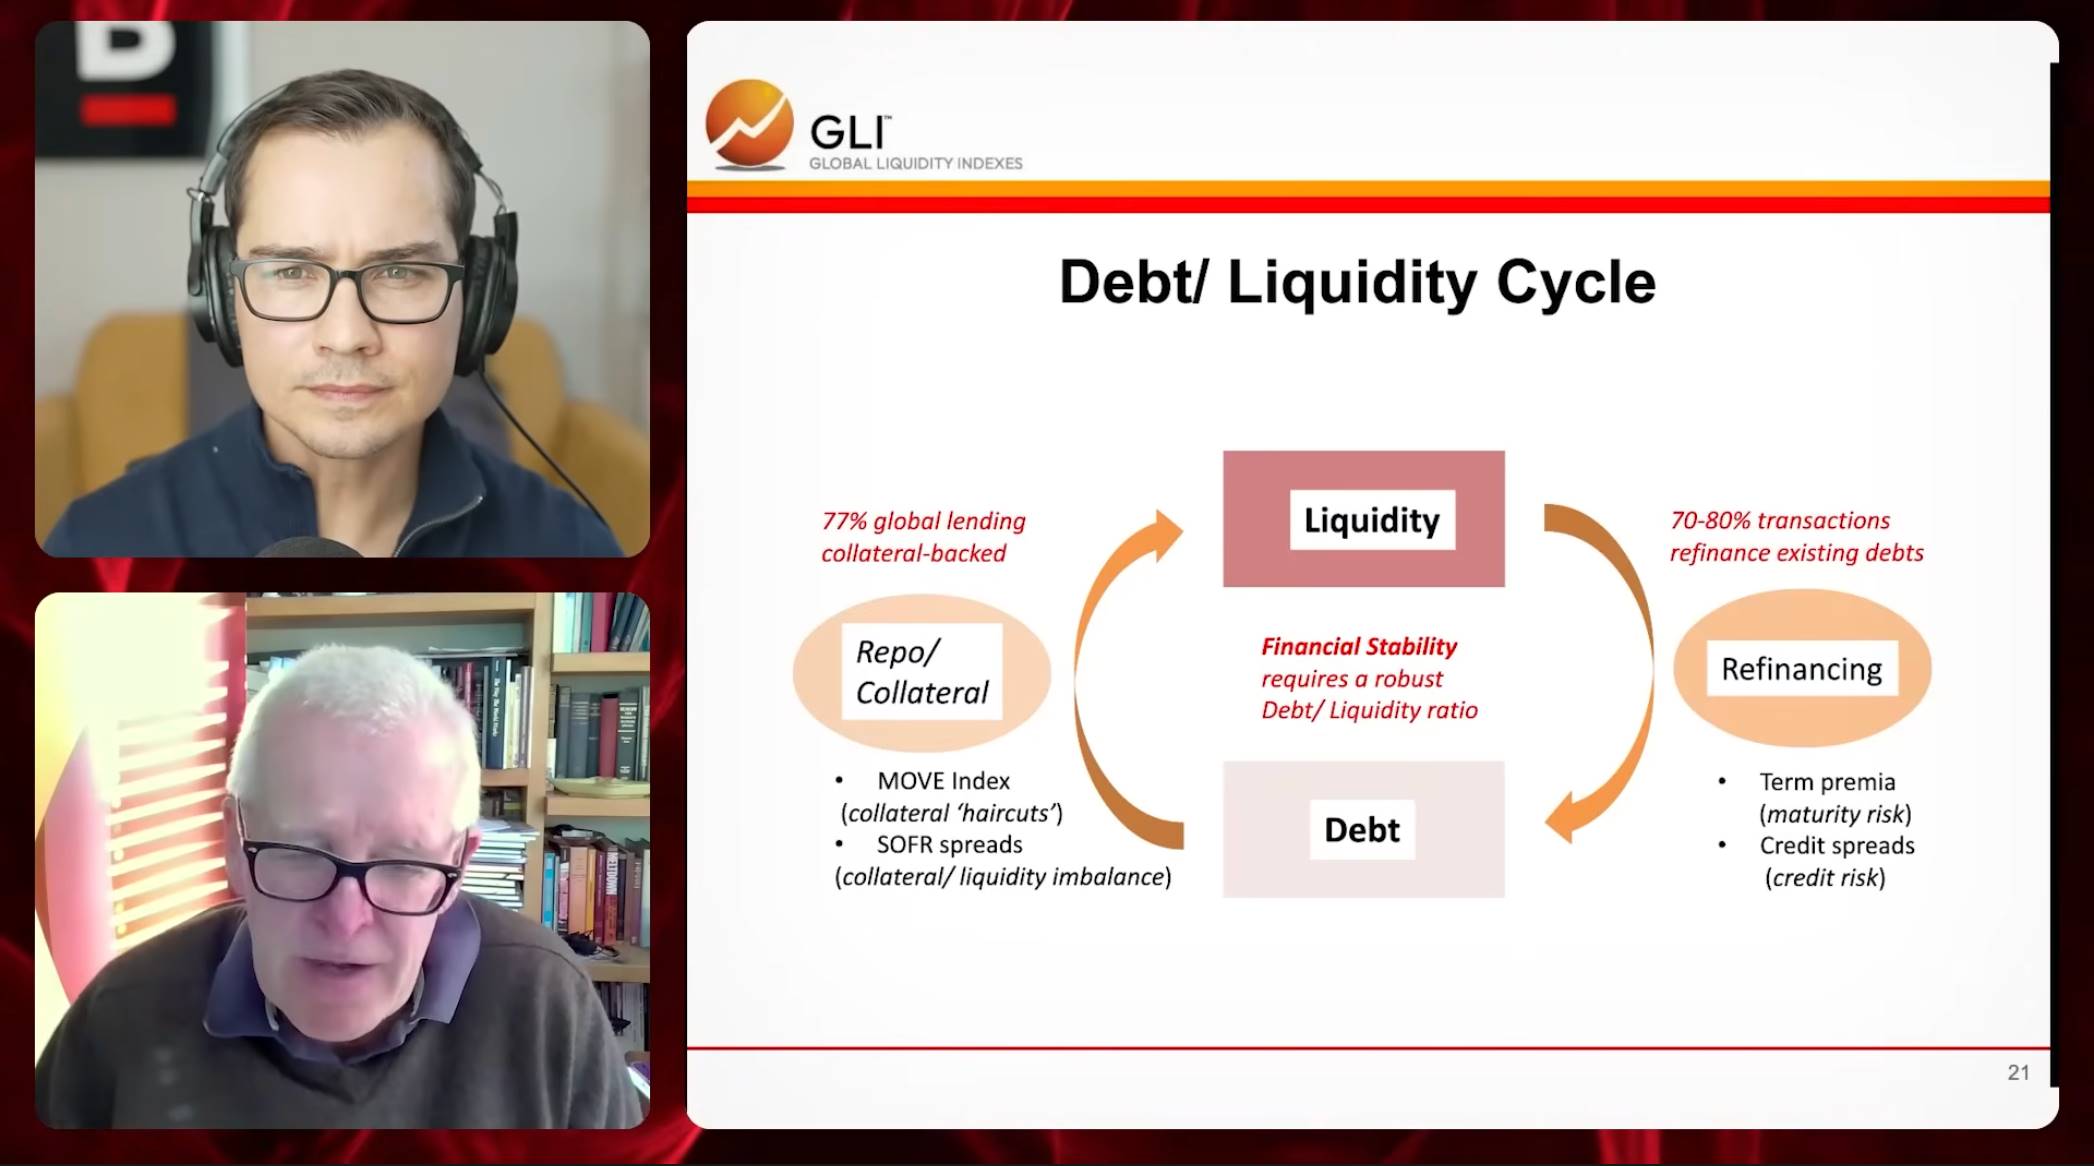
But here lies a paradox: debt needs liquidity to roll over, yet liquidity itself depends on the existence of debt. This interdependence forms the foundation of today’s financial system.
According to World Bank data, about 77% of global loans are collateralized. This includes mortgage loans and many financial transactions—like hedge fund trades that use government bonds as collateral. So we must deeply understand collateral’s role.
In other words, debt needs liquidity, and liquidity needs debt. An interesting phenomenon is that old debt actually supports new liquidity—this mutual dependence is the core operating mechanism of modern finance.
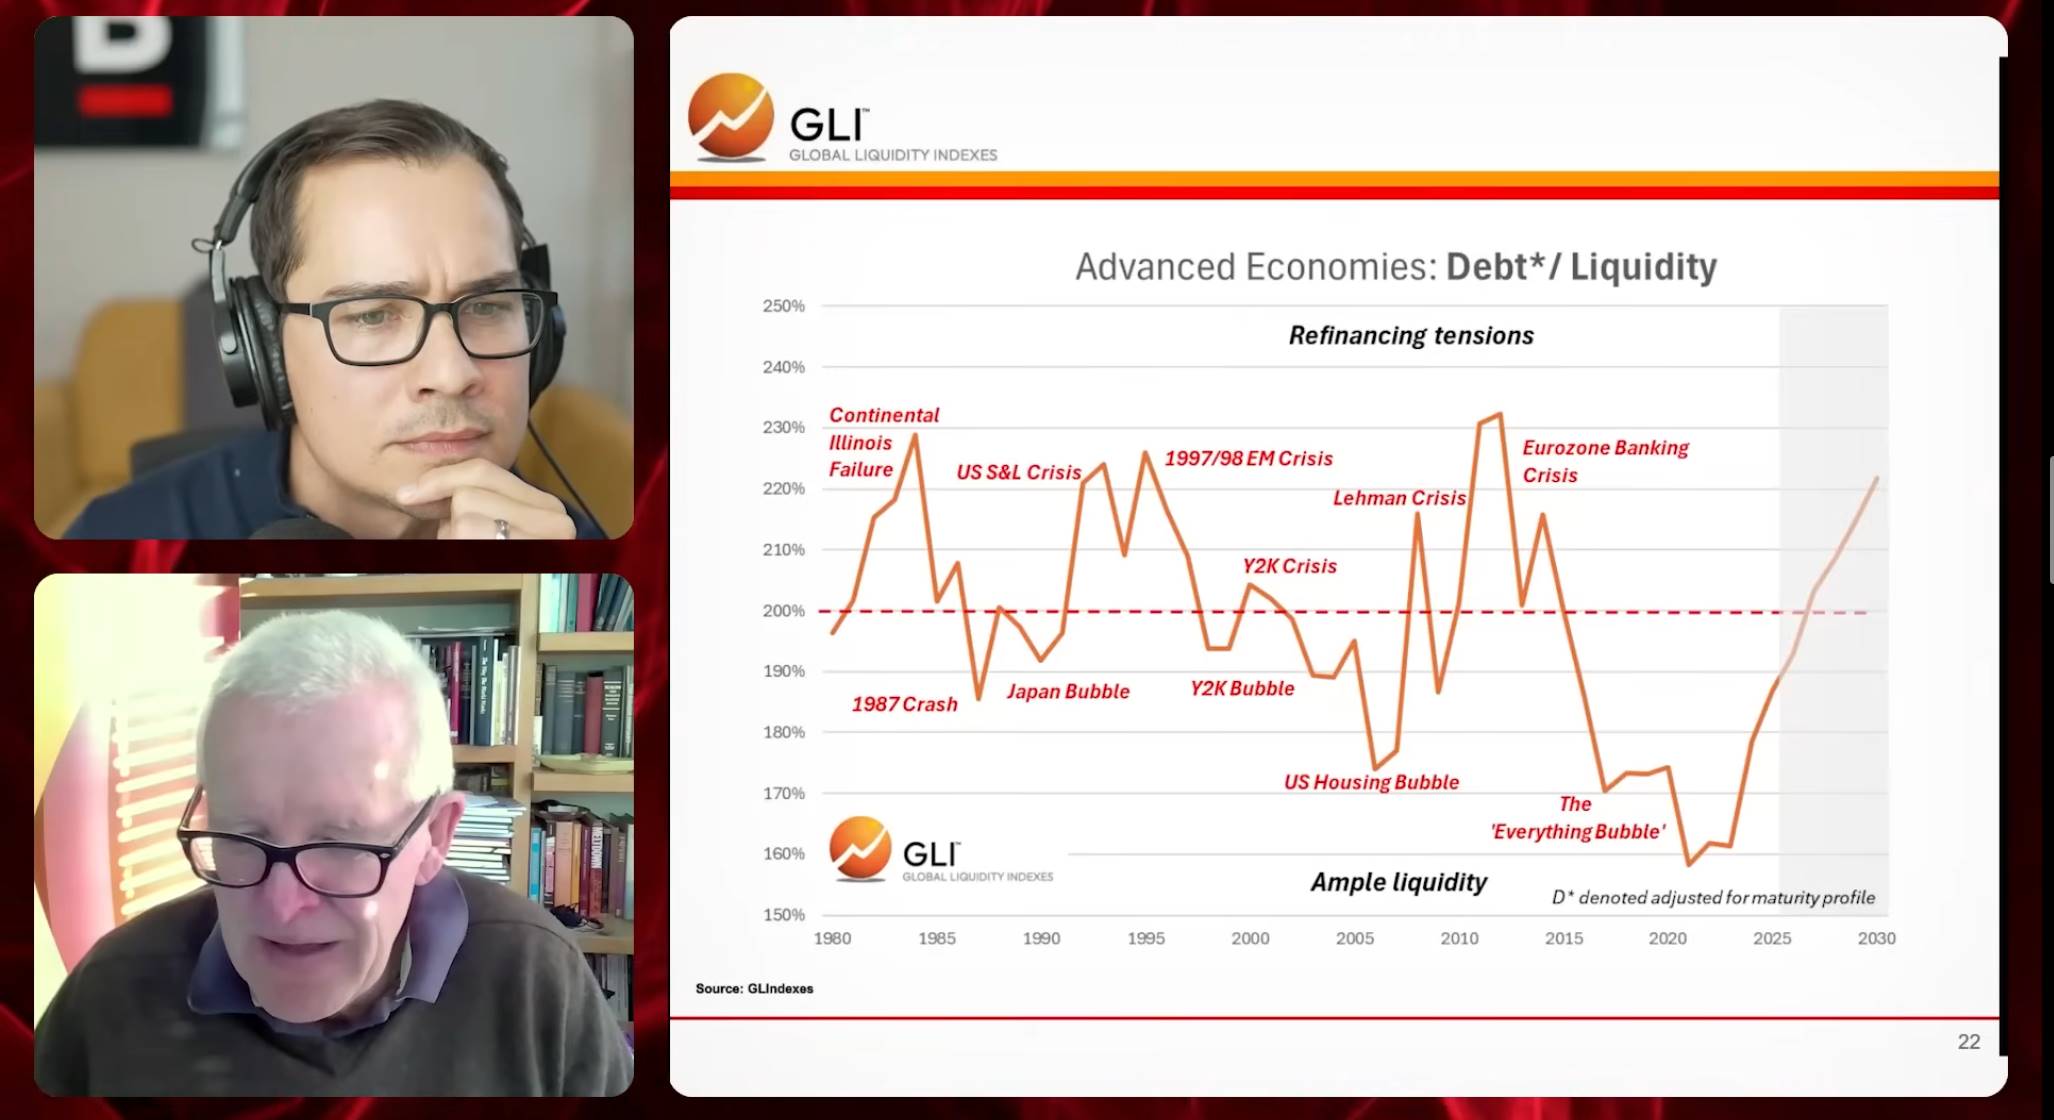
To maintain financial stability, we need a healthy debt-to-liquidity ratio. Total debt stock in advanced economies (public and private) is about $300 trillion. The debt-to-liquidity ratio—the ratio of liquidity to debt stock—averages around 2x. This ratio exhibits mean reversion: when it deviates from its long-term average, it tends to return. Compared to traditional debt-to-GDP ratios, the debt-to-liquidity ratio better reflects an economy’s ability to refinance debt.
When the ratio is too high, debt levels relative to liquidity become strained, risking funding difficulties or refinancing pressure—and potentially triggering a financial crisis. Conversely, when liquidity vastly exceeds debt, asset bubbles may form. We’ve just exited a phase called the “everything bubble,” marked by abundant liquidity and low debt pressure.
This phenomenon is tied to policymakers’ responses. After each crisis, they typically inject massive liquidity via QE to boost system-wide liquidity. During the pandemic, global interest rates dropped nearly to zero. Low rates encouraged more debt issuance and extended average debt maturities. Many debts were refinanced at low rates, creating a “wall of debt maturities”—a surge of debt expiring in coming years.
This may challenge markets, but not necessarily trigger a crisis. Over recent years, zero-rate policies pushed many debt maturities into the future, reducing current debt increments. But this delay intensifies refinancing pressure in the coming years—now one of our biggest challenges.
The link between liquidity and asset bubbles also matters. History shows liquidity surges often precede asset bubbles. We’re now exiting the “everything bubble,” mainly due to two factors: a coming wave of debt maturities and central banks—especially the Fed—slowing liquidity injections. Together, these mark the end of the bubble era.
Where Are We in the Cycle?
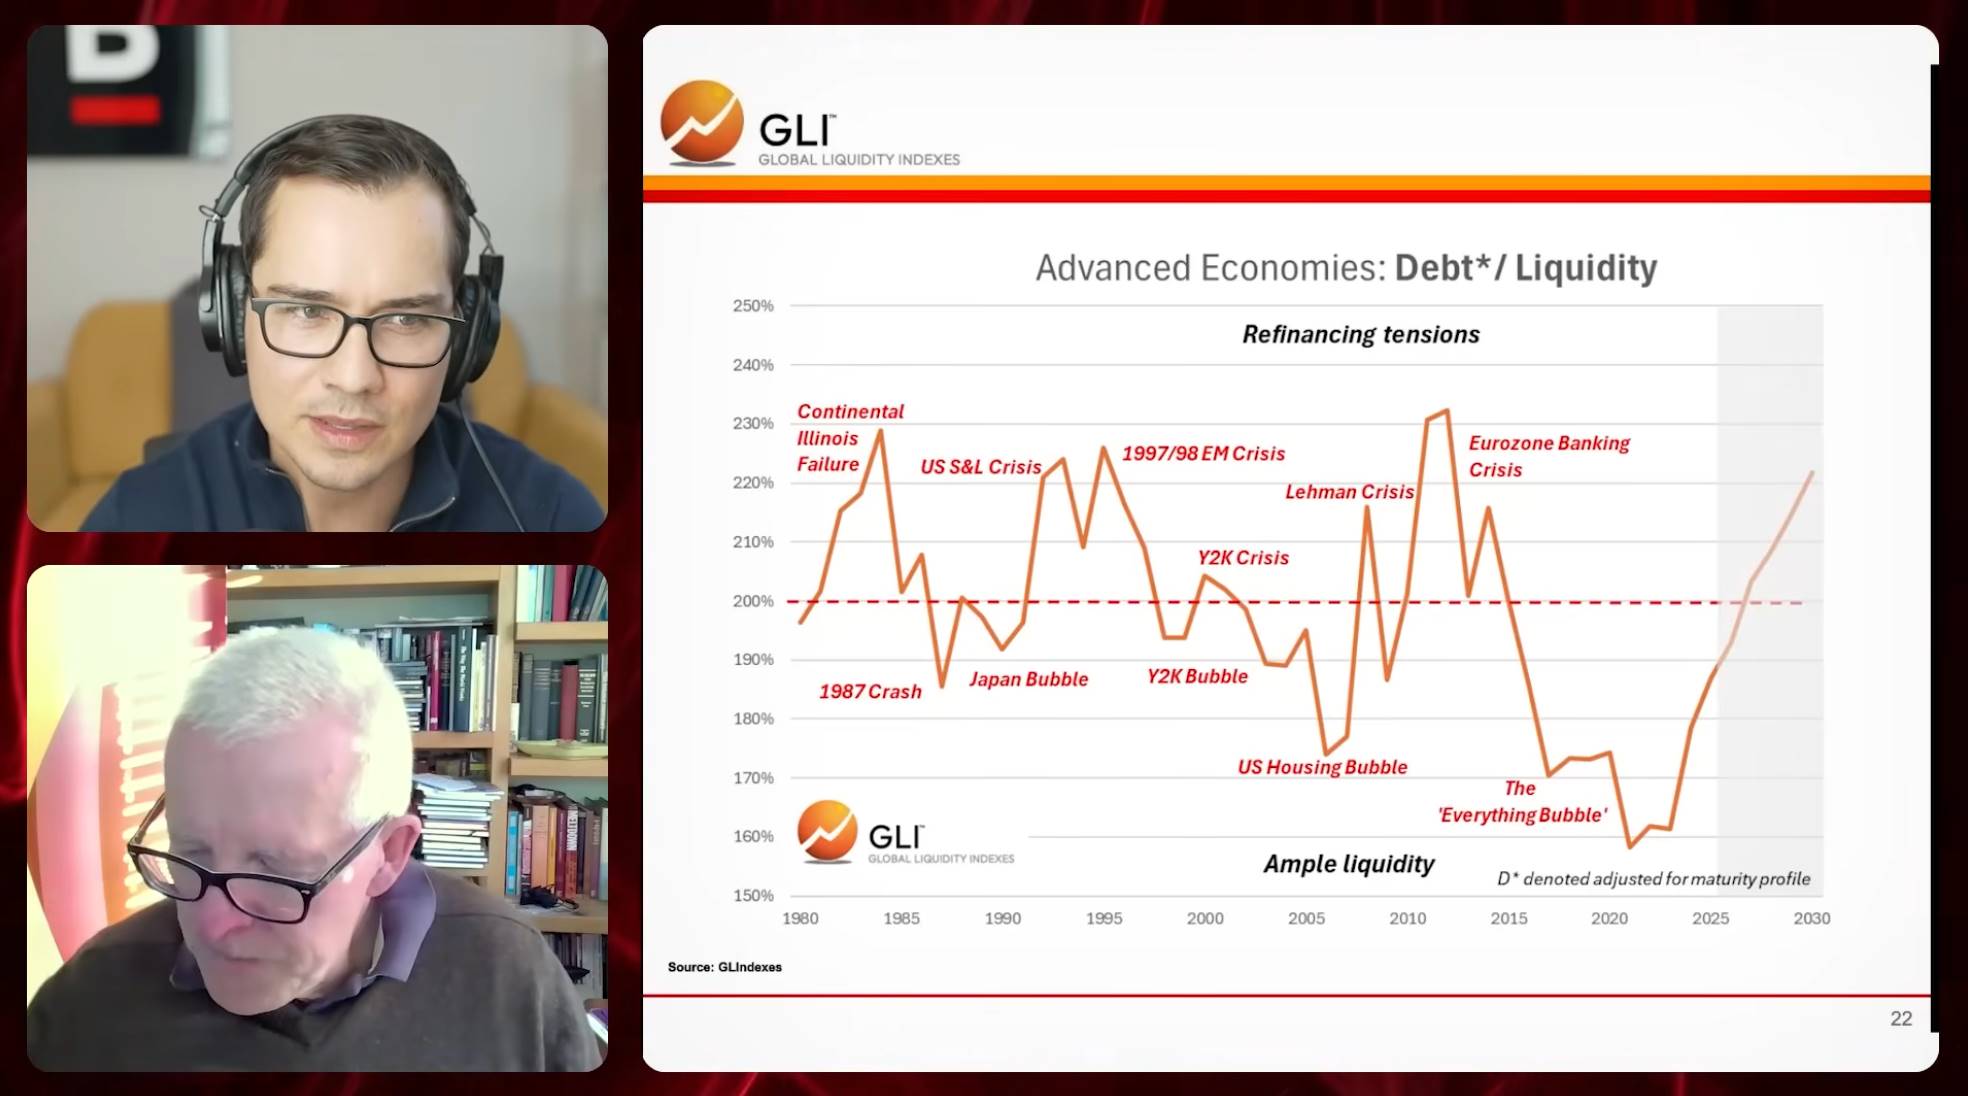
Ryan: From this chart, when the debt-to-liquidity ratio falls below 200%, we tend to see asset bubbles—Japan’s bubble, Y2K, dot-com, U.S. housing. Now, we’re in an “everything bubble” phase. But when the ratio exceeds 200%, financial crises usually follow. Judging from your chart, we seem near the cycle’s end—especially the end of the asset price rally. With liquidity draining, we’re returning to a crisis-prone zone.
Michael:
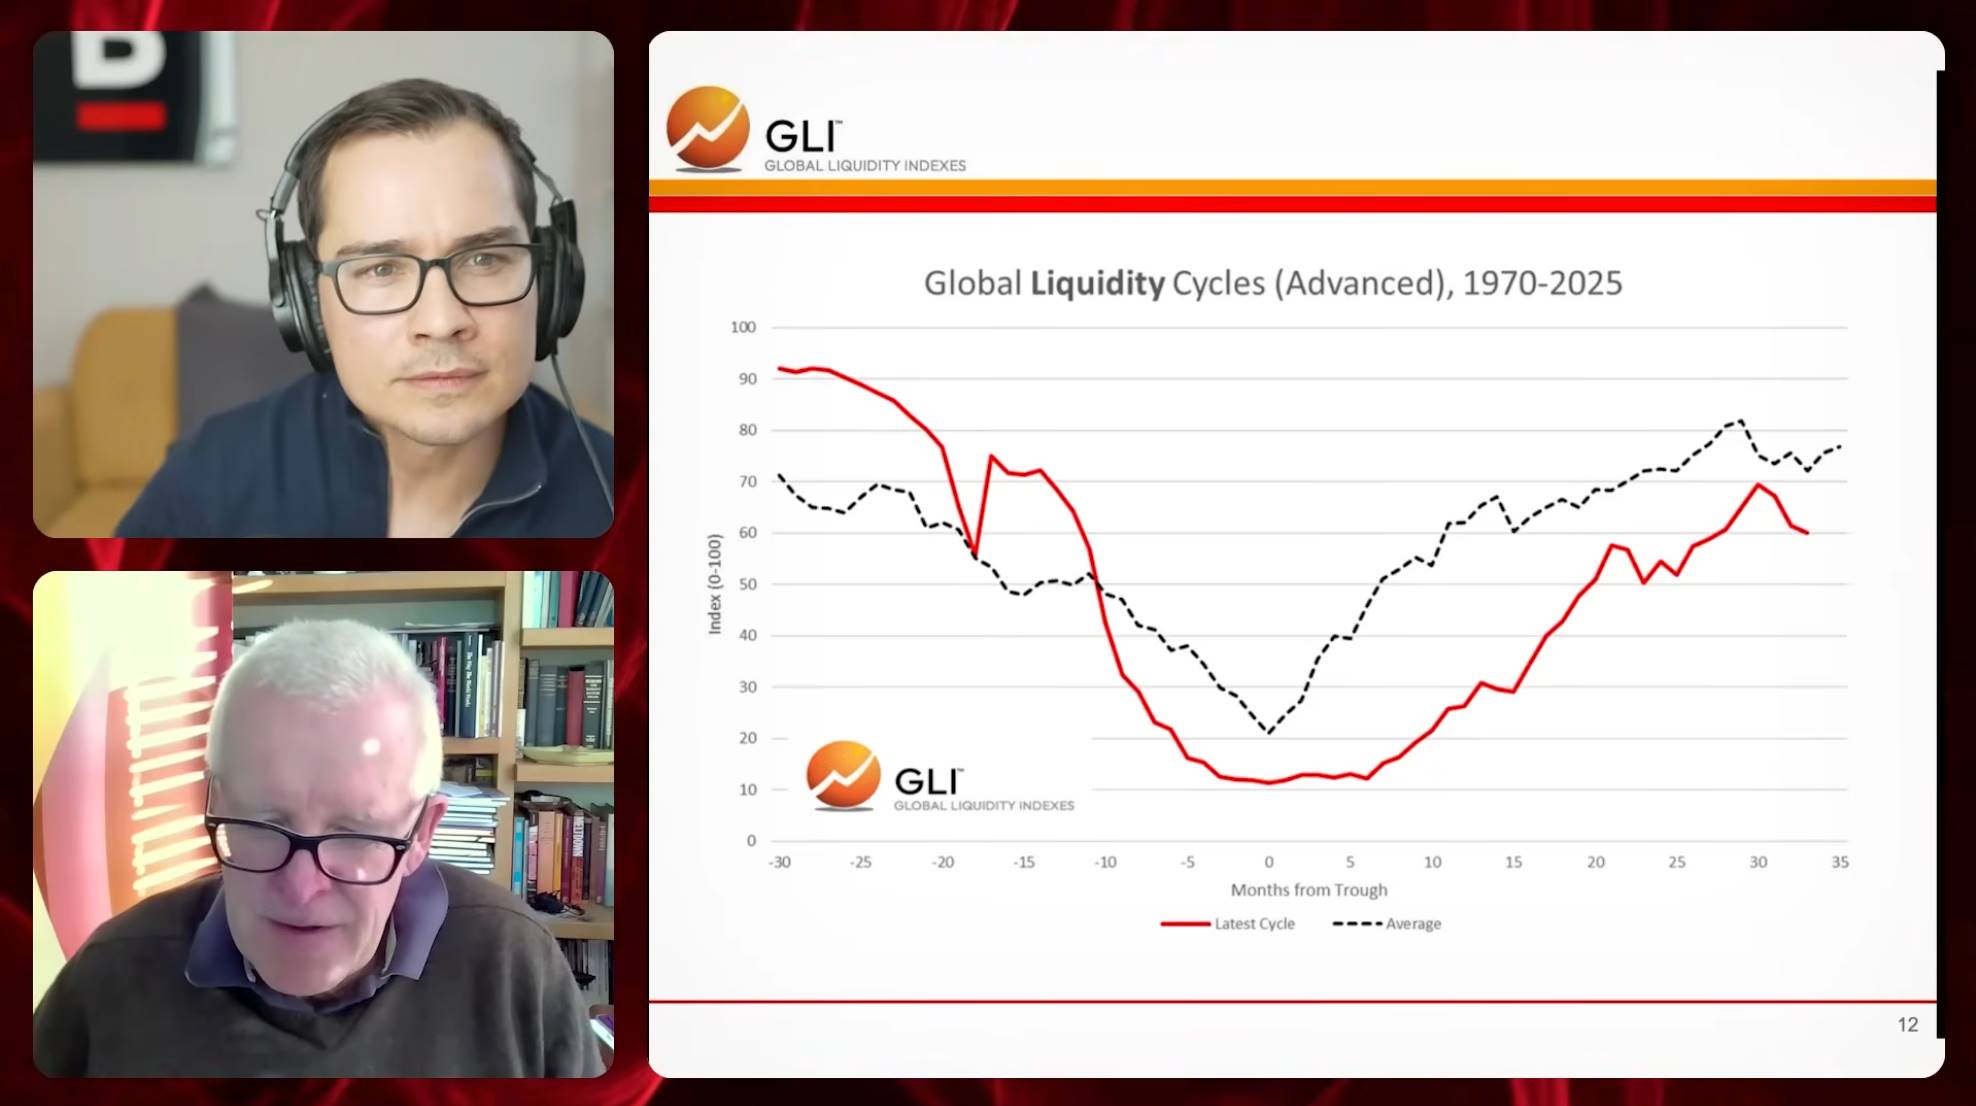
This chart compares the current cycle (red line) with the average cycle since 1970 (dashed line). The zero axis marks the cycle’s trough—you can measure left or right in months. This is one of the 65-month cycles mentioned earlier.
Typically, the cycle spans about ±8 months. If accurate, this suggests caution in asset allocation. Also, we must distinguish between cycles and trends. We’re confident the monetary expansion trend driving markets over the past decade may continue for decades to come.
Monetary inflation is clearly visible. It stems from massive fiscal burdens—welfare and defense spending. Policymakers have only one option: print money or monetize debt, inevitably causing monetary inflation. This is a long-term issue we all must face. But in the short term, we must watch repo market stress.
Repo market stress is worsening, shown by the growing spread between SOFR and the federal funds rate. SOFR should theoretically be lower due to collateral, but recently it’s exceeded normal levels by about 10 basis points—entering a “danger zone.” More concerning, the frequency and magnitude of rate volatility are increasing, signaling mounting repo market pressure and potential threats to financial stability.
This ties closely to the Fed’s liquidity policy. Changes in Fed liquidity aren’t fully captured by its balance sheet, as some components absorb liquidity. True liquidity shifts require filtering out irrelevant items. In 2021, Fed liquidity growth hit 80% annualized during the pandemic, then plunged to -40% a year later—reflecting tight monetary policy.
During tightening, the Fed’s inflation-fighting moves shocked the financial system—Silicon Valley Bank collapse, UK debt crisis. Then, the Fed shifted, gradually adding liquidity in 2023, though overall growth remained low. Early 2025 saw a brief liquidity spike due to the debt ceiling, but Treasury replenishment of the TGA later drained liquidity, increasing systemic stress.
Overall, Fed liquidity remains in negative territory despite QT ending—impact limited. Modest recovery may come in late 2026, dependent on QE resumption. The S&P 500 typically lags Fed liquidity by about six months—sharp drops often followed by market corrections. Current volatility may reflect this pattern, but outcomes remain uncertain.
Asset Allocation
Ryan: It seems we may be at the tail end of a cycle, with liquidity gradually withdrawn. Repo markets may already show warning signs—or at least need close monitoring. This could mean the 65-month liquidity cycle is ending, risk assets may suffer, and we might be nearing a potential crisis. Please synthesize this—what’s the current cycle status, and what does it mean for investors holding various assets?
Michael:
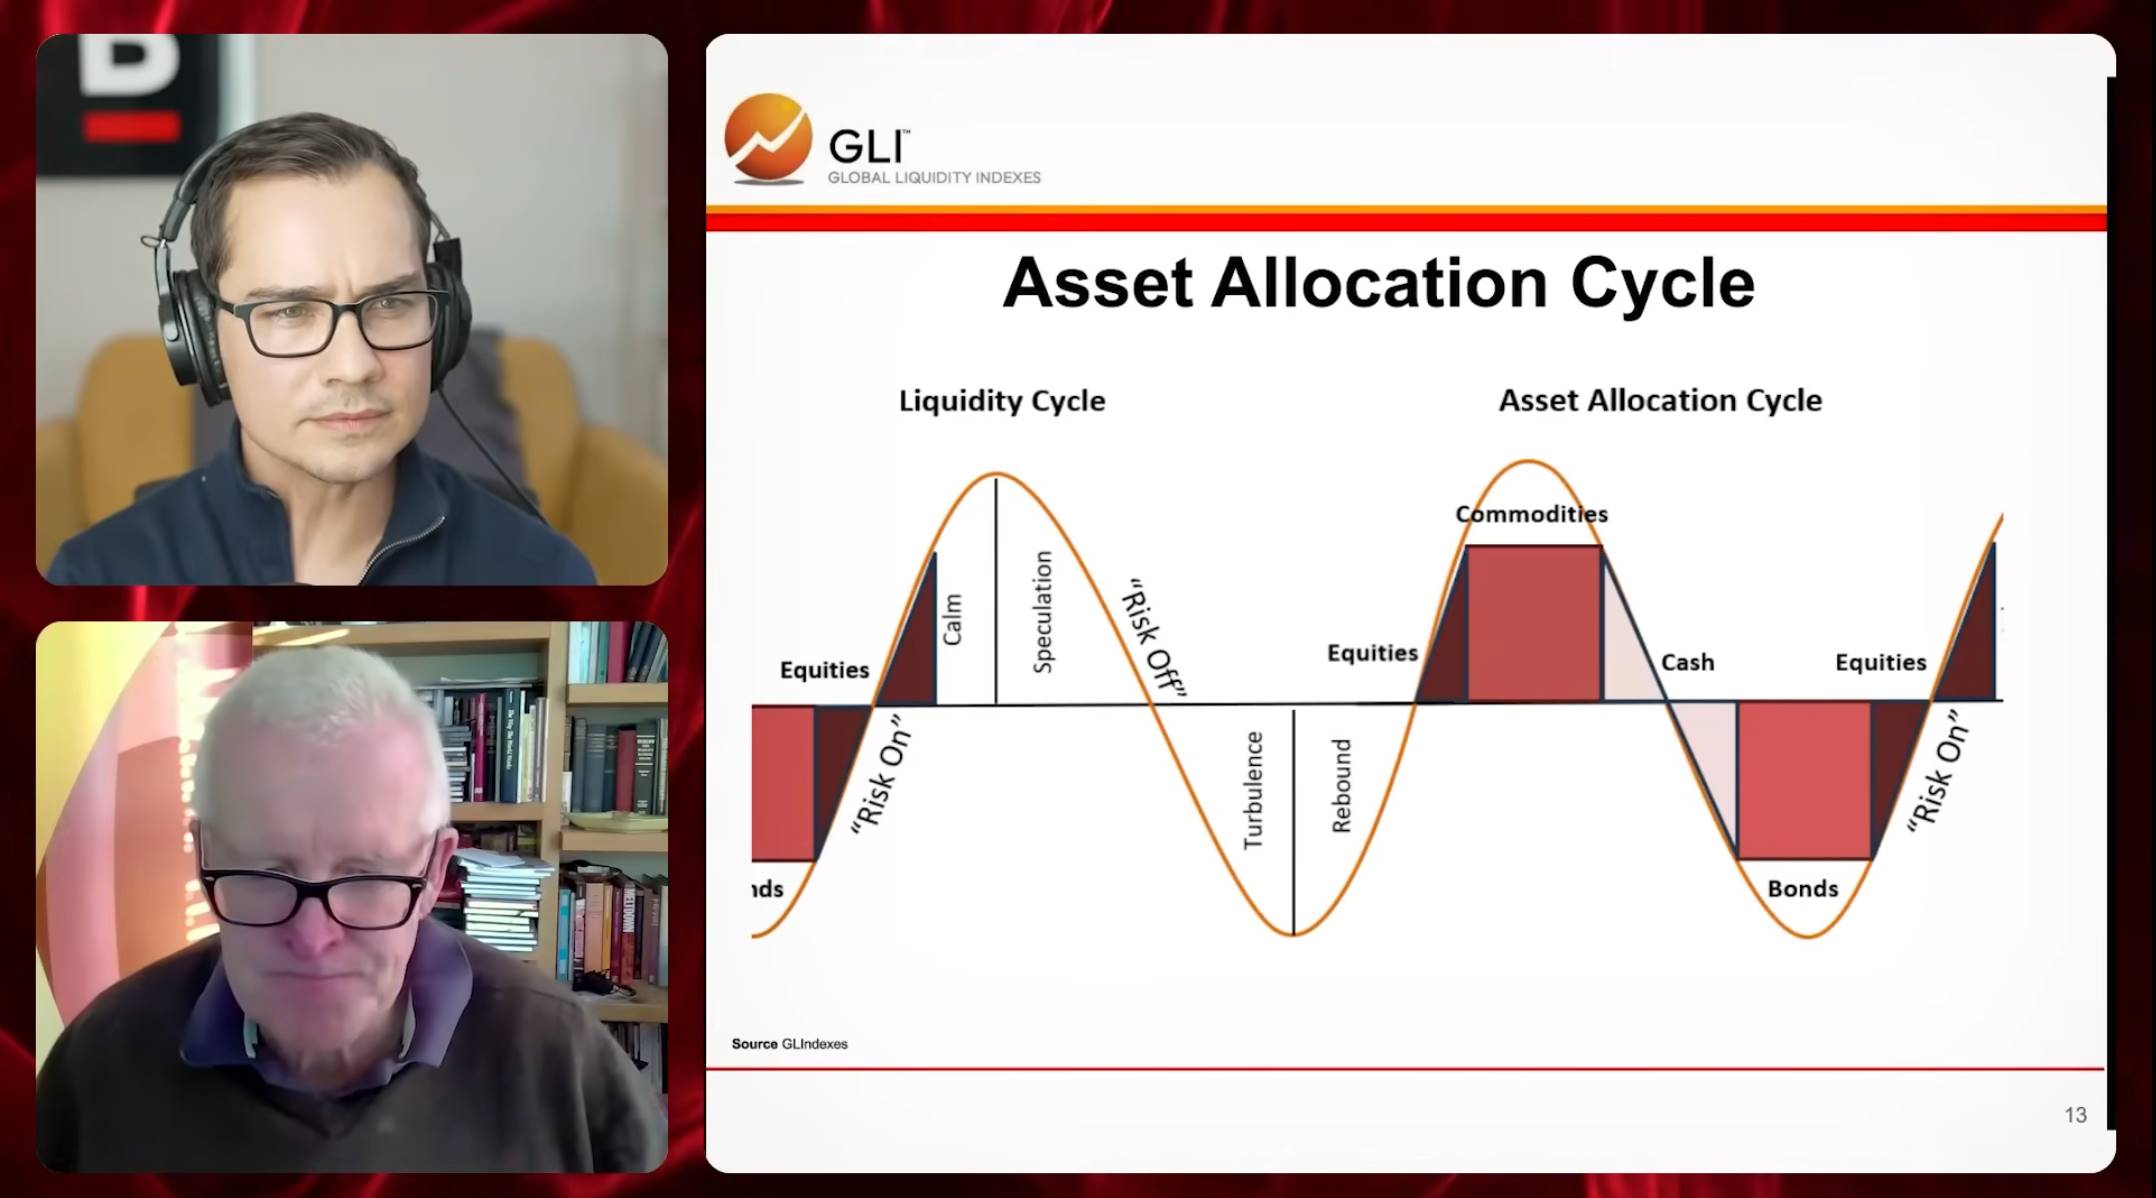
Let me explain. This diagram shows the relationship between the liquidity cycle and the asset allocation cycle. The liquidity cycle has four phases: calm, speculative, turbulent, and recovery. Each corresponds to different asset performance patterns. While phases may overlap, they generally align with major asset class cycles.
Though not perfectly aligned, they broadly match asset performance cycles. The chart labels major categories: equities, commodities, cash, and bonds.
Typically, risk assets perform well during recovery and calm phases. Especially from mid-recovery to late calm, equities are often top performers. As the cycle peaks and transitions from calm to speculative, commodities tend to shine. During the down leg, cash usually delivers the best absolute returns. At the cycle trough, government fixed-income assets—especially long-duration bonds—typically excel.
After poor risk asset performance ends, the cycle re-enters a phase favorable to risk assets. A traffic light chart illustrates this more intuitively.
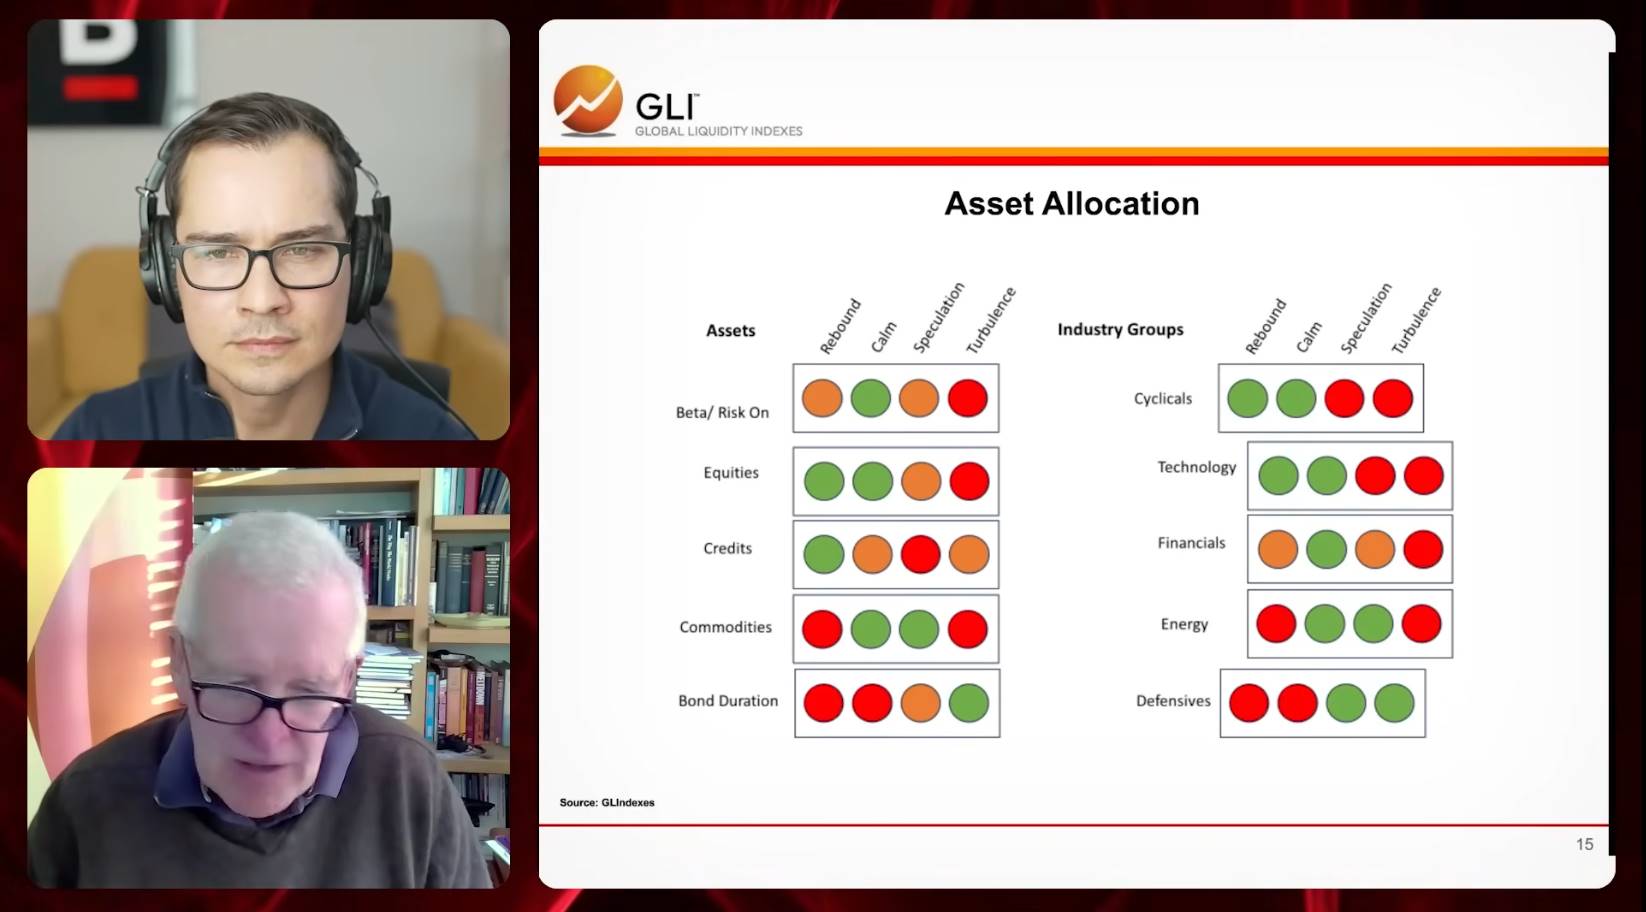
The left side shows allocations across major asset classes, the right shows sector allocations within equities or credit. Green means invest aggressively, yellow means caution, red means stop. The chart indicates that in recovery—early upswing—while not necessarily full risk-on, investors can cautiously increase risk exposure. Equities and credit lead here—hence green. By the calm phase, reduce credit, focus more on commodities. Equities and commodities become optimal.
In the speculative phase, credit carries higher risk. Investors should favor commodities and real assets, gradually reducing extreme equity positions. In the turbulent phase, long-duration government bonds are ideal.
Currently, equities and commodities aren’t performing well. If sector yields improve, credit may recover. Cyclicals outperform during risk-on phases, defensives during risk-off. Tech stocks often lead early cycle and stay strong in calm phase. Financials peak mid-cycle, especially during calm. Energy commodities perform strongly in speculative phase and at cycle peak.
Though no clear business cycle exists post-pandemic, the asset allocation and liquidity cycles behave normally. This is because government spending dominates Western economies, muting business cycles. Yet the liquidity cycle—from trough to current peak—follows a typical pattern. To assess asset allocation, simply scan the traffic light chart. This isn’t cycle-specific—it works for all. We’ve used it for decades, and it consistently works.
Performance-wise, equities outpace credit, credit beats bonds. Commodities are now rebounding. Tech has led markets, financials performed well globally over the past 18 months. Energy commodities—like gold miners—have shined this year. These signals confirm a classic cycle.
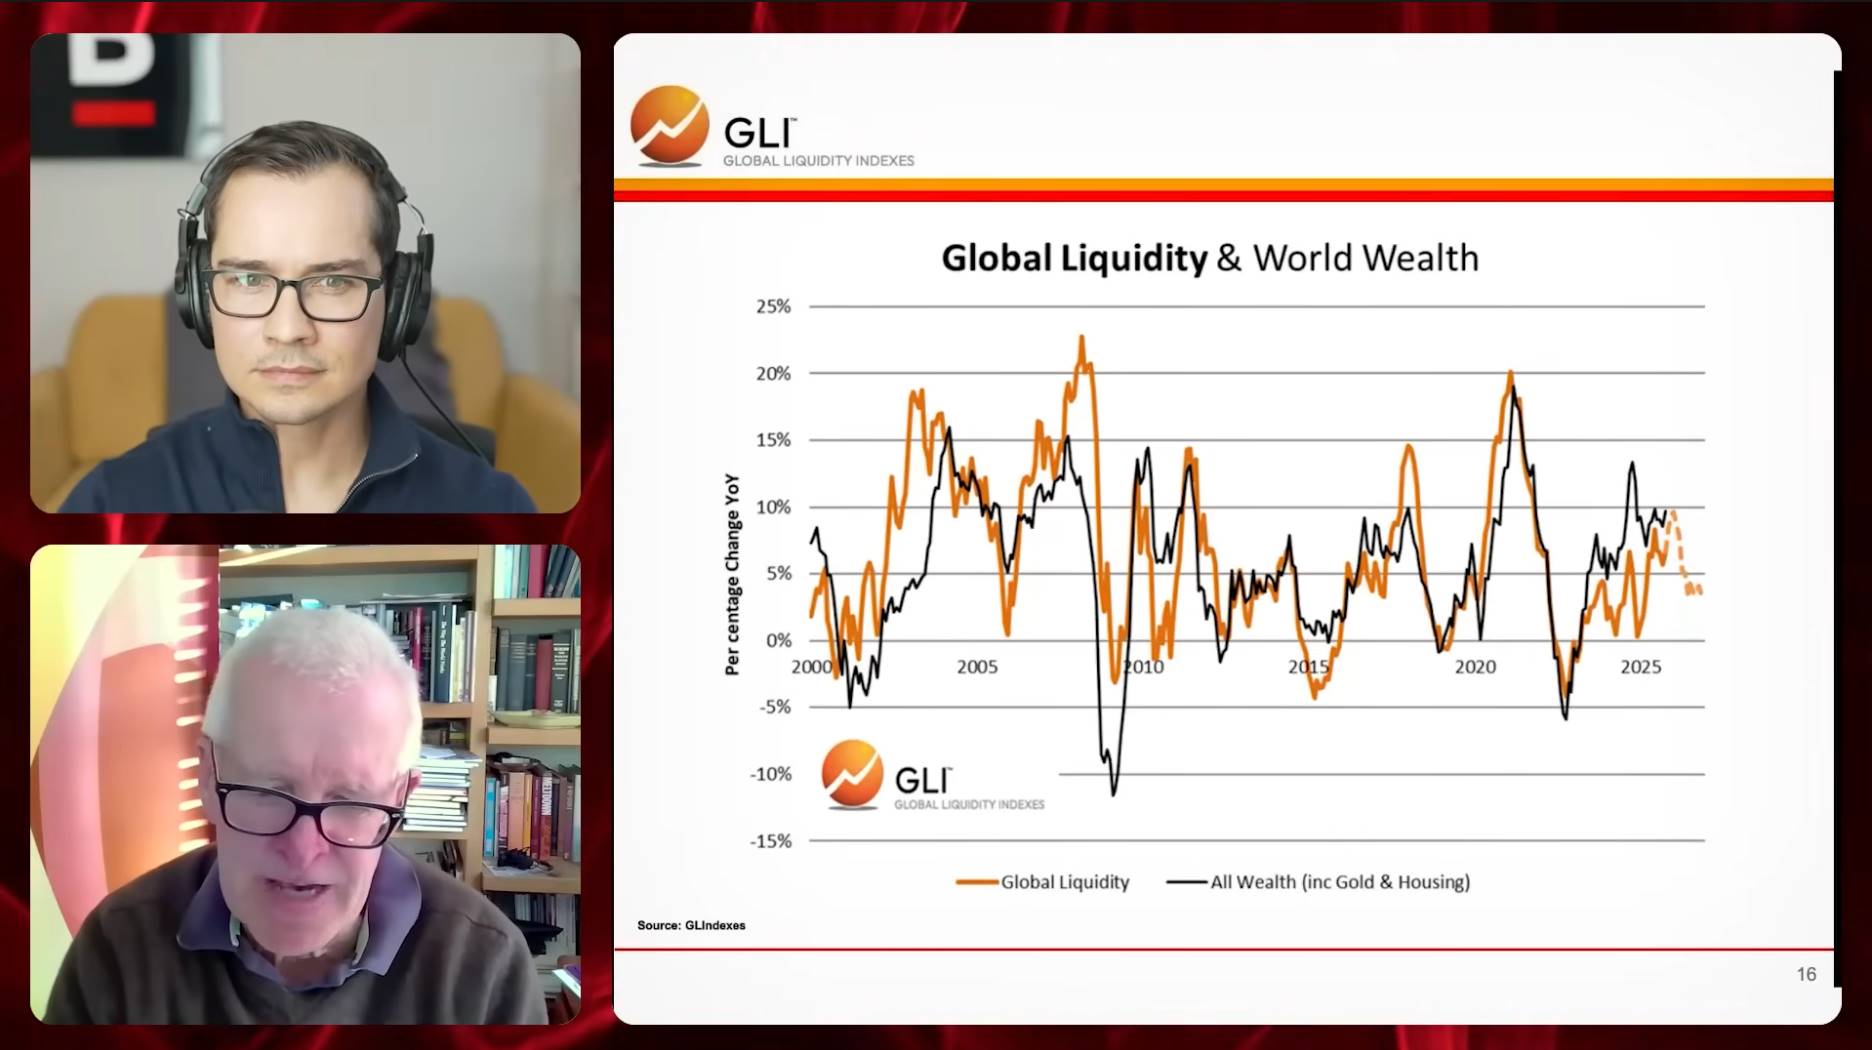
We also see a chart showing tight correlation between global liquidity and global wealth. It covers all major assets—equities, bonds, liquid assets, residential real estate, crypto, precious metals. Annual returns of these assets are compared to global liquidity growth (in USD), showing a highly significant correlation.
If we go back before 2000, the link between global liquidity and wealth growth still exists but is weaker. Since 2010, the correlation has strengthened dramatically. This shows liquidity has become a key driver of global wealth returns. In short, market performance increasingly depends on liquidity supply, not traditional economic fundamentals.
This trend is a major market dynamic, now attracting government attention. Treasury Secretary Bessent has moved to end the Fed’s loose policy, redirecting Treasury funds toward the real economy. The goal is to ease excess liquidity’s market impact and reduce social fragmentation. Without effective solutions, inequality may worsen, bringing greater challenges.
We’ve also analyzed crypto performance. As a new asset class, crypto price volatility increasingly correlates with global liquidity.
We used high-frequency data, tracking weekly changes with a six-week window. We found a strong correlation between global liquidity and crypto performance, suggesting crypto may play a growing role in portfolios as the liquidity cycle evolves.
Ryan: Michael, from your analysis, we seem between the calm and speculative phases. Do you agree? Are we nearing the late speculative phase?
Michael:
It depends on the economy. The U.S. is clearly in the speculative phase—our data confirms this. European and parts of emerging Asia are in late calm phase.
Ryan: So we can say we’re between calm and speculative. We’re not in turbulent or recovery. For asset classes—stocks, credit, commodities, bond duration—where does crypto fit? Is it a commodity or a risk asset?
Michael:
Crypto behaves like both tech stocks and commodities. It has NASDAQ-like traits and gold-like qualities. So crypto is essentially a hybrid. Trend-wise, it resembles gold; cycle-wise, it aligns with tech stocks.
If we analyze Bitcoin’s drivers, studies show about 40%-45% are tied to global liquidity. Of the remainder, ~25% links to gold, and ~25% to risk appetite—measurable via NASDAQ. If Wall Street suddenly sells off due to caution, it may affect Bitcoin. Gold is less sensitive. So Bitcoin is more vulnerable to market or tech stock swings than gold.
The Bitcoin-gold relationship is fascinating: negatively correlated short term, positively correlated long term. Mathematically, it fits an error-correction system. Long-term trends align, but short-term moves are independent. Bitcoin may diverge sharply short term but eventually revert to gold’s direction. Recent months confirm this—when gold rises, Bitcoin may stagnate or fall; when Bitcoin rallies, gold may flatline or dip. Short-term negative correlation balances with long-term positive correlation, as both hedge monetary inflation but substitute each other short term.
Will the Monetary System Collapse?
Ryan: Michael, you forecast GLI (Global Liquidity Index) will keep rising. Here’s my question: the data is USD-denominated. Can we compare this to the Bretton Woods collapse? I mean, every 70–90 years, the monetary system seems to undergo major change.
If we truly enter a new monetary system, would this trend collapse? Would the system’s foundation unravel, or would it keep growing? What’s your take?
Michael:
Excellent question. Historically, monetary systems do evolve over time. I believe we’re in a new transformative phase—especially after the U.S. launched stablecoins. If this monetary form is carefully designed, not accidental, its impact will be profound and reshape global finance significantly.
We can understand this through the “debt-to-liquidity ratio.” It reflects the relationship between debt size and liquidity. Long term, this ratio shows stability across countries and systems. Numerator and denominator use same units, clearly showing debt-liquidity dynamics.
But this stability doesn’t hold universally. For emerging economies borrowing heavily in USD but supplying local-currency liquidity, default risk rises. This has happened historically, requiring international aid or system restructuring. But for Western advanced economies, default is nearly impossible—the entire system depends on continuity of existing debt.
As I said, today’s system is debt-centric. New liquidity is often issued with old debt as collateral. So old debt can’t default—it must be rolled over or sustained. This dynamic is key to system continuity. So what lies ahead?
Take Japan and China. Their debt-to-liquidity ratios reveal economic traits. In Japan, we saw peaks around 2005 and 2010, reaching 300%. China’s ratio peaks lower but follows a similar path. Note: this ratio reflects debt structure, not full economic health.
How did Japan handle high debt-to-liquidity ratios? Through economic stimulus. The BoJ massively bought government debt and printed money, depreciating the yen and lowering the ratio. Apply this to China: will it default? No. China is more likely to monetize debt to relieve pressure. This may not happen overnight, but current trends suggest China is on a similar path.
We’ve seen China’s monetary policy fuel inflation, with rising gold prices as a clear signal. The PBOC injected massive liquidity in early 2025, directly pushing RMB gold prices higher. This shows China is indirectly managing policy challenges through gold price control.
Need evidence? Watch gold prices. Why keep rising? Because China is buying heavily and printing money to support it. It’s a mechanism: by expanding money supply, China effectively influences gold prices.
PBOC liquidity injection data confirms this—surged in early 2025. Though recently slowed, overall liquidity remains high. Not coincidental—RMB gold prices also surged. I believe this is partly why China pushes gold prices—all tied to its core monetary goals.
Why act now, not one or two years ago? I think it’s closely tied to stablecoin threats. Stablecoins made China realize its monetary system integrity is under threat.
Stablecoins offer global investors a new store of value—especially in unstable currencies or unfriendly tax regimes. In Europe, the ECB has publicly stated U.S. stablecoins may strip Europe of monetary control. For China, the threat is even greater.
Chinese exporters are already highly dollarized—most income in USD. They face two choices: deposit USD in Western banks—risk of seizure (like Russia post-Ukraine war); or deposit in domestic banks—risk of loss due to policy shifts. Rather than pick between risks, they move funds into U.S. stablecoins. Stablecoins’ anonymity and convenience make them preferred—opening a stablecoin account is easier than a traditional bank account.
From a global view, beyond China and Europe, Africa, Middle East, Latin America—regions with unstable currencies—may adopt stablecoins en masse. This could profoundly reshape the global monetary system.
Thus, I believe the world is splitting into two main monetary systems. One is dollar-based, centered on digitizing Treasuries via stablecoins. The other is China’s gold-backed system. Note: China isn’t returning to classical gold standard, but using gold to impose monetary discipline. This reflects two trust systems: America relies on tech innovation; China on gold’s stability. This may define how the world operates going forward.
China’s Gold vs. America’s Tech
Ryan: GLI keeps growing—$200T, $300T, more—because U.S. and other governments almost never default. If fiscal trouble hits, they just print. So we expect these numbers to keep rising. You said this reflects a capital war, with U.S.-China rivalry as the main front.
You mentioned two monetary blocs forming: one U.S.-led, backed by Treasuries and stablecoins, possibly strategic Bitcoin reserves; the other China-led, gold-centered. The PBOC keeps buying gold aggressively.
If we project this trend, might we see a gold-backed Chinese bloc and a U.S. stablecoin-Bitcoin bloc? Is that your view?
Michael:
Exactly. My view is precisely that. If we see this as a capital war, one U.S. tactic is to keep gold prices volatile. Rising gold prices significantly strengthen China’s economic power. Why? Though the U.S. holds large gold reserves (~8,000 tons), they’re not linked to the dollar—USD is detached from gold. The U.S. doesn’t rely on gold to back its currency, so gold price hikes affect it far less than China.
Reports suggest China may secretly hold ~5,000 tons—closing the gap with the U.S. This clearly threatens the U.S. Meanwhile, China may leverage tech advantages for cyberattacks—using quantum computing to break crypto security or disrupt Western infrastructure like traffic lights or home devices. If Chinese malware infiltrates global supply chains, it poses major risks to the U.S. and others.
Ryan: Is this the new frontier of capital war? Between U.S. crypto strategy and China’s gold strategy, which has the edge?
Michael:
Personally, I hope the U.S. prevails—I have faith in American tech innovation. But historically, gold often wins in the long run.
Ryan: Does this also explain gold’s sharp rise in recent years?
Michael:
Yes, likely because China is actively accumulating gold. Official data may not show it, but as the world’s largest gold producer, China is building credibility in its monetary system via gold reserves. It may push gold-for-commodity swaps—letting certain nations trade gold for oil. Not for public use, but among select central banks. Like the old U.S. gold standard—not fully convertible, but gold backing and credibility play a key role in China’s system.
Crypto and Gold
Ryan: As respected currencies increasingly serve as collateral for broader fiat, new opportunities may emerge. Looking ahead, if this trend holds, should investors hold both crypto and gold? Like a Bitcoin-gold portfolio? Under this backdrop, any price outlook for these assets over the next 5–10 years?
Michael:
I think the answer has two sides. From a 'capital war' perspective, gold and Bitcoin are key assets in a long-term rivalry. Facing persistent monetary inflation, investors shouldn’t choose between Bitcoin and gold—they should hold both. This strategy requires proper volatility adjustment in portfolios to balance risk and return.
On inflation trends, I refer to Congressional Budget Office forecasts—bipartisan, transparent, projecting debt growth and deficits to 2035. U.S. federal debt may grow ~8% annually.
Over the past 25 years, U.S. federal debt grew ~10x. From 2000 to 2025, debt rose faster than S&P 500 (~5x), while gold rose ~12x—outpacing debt growth.
CBO projects U.S. public debt-to-GDP ratio will rise from ~100% today to 250% in coming decades—debt doubling. Debt growth will exceed GDP growth by over 2x, staying ~8% annually.
If gold continues its current relationship with federal debt, it could easily reach $10,000/oz by mid-2030s, $25,000 by 2050.
For Bitcoin, consider its current ratio to gold—~25–27x. Projecting this, Bitcoin could see significant growth. Exact price forecasts require deeper market analysis, but long-term potential is clear.
Four-Year Cycle
Ryan: A fascinating question—I’m asking on behalf of crypto investors. We all watch the crypto four-year cycle, like Bitcoin halvings—occurred three times. How does your global liquidity model view Bitcoin’s and crypto’s four-year cycle? Now in the fourth cycle’s end, prices have dropped sharply. Investors wonder: is this cycle over? Your thoughts?
Michael:
Briefly: I’ve analyzed crypto and global liquidity, but found no clear evidence of a four-year cycle. I know some propose it—maybe they’re right—but my research shows no distinct periodicity. Bitcoin halvings may affect markets, but I can’t pinpoint their role. I observe longer cycles—like debt refinancing, typically five to six years. If halvings affect supply, they may indirectly reflect demand shifts—but don’t fully align with global liquidity cycles. Still, markets now show convergence signs—investors should stay cautious.
Ryan: Setting aside crypto’s specific four-year halving cycle, just from your global liquidity model—can we say markets are in a late-cycle stage? Crypto is at a critical juncture. Do you think this cycle is ending, or could it persist?
Michael:
I should clarify: trends and cycles are entirely different concepts. In portfolios, you must consider both. Typically, you have a core long-term trend position, plus tactical adjustments for cyclical volatility. The split depends on personal preference and how you balance core and tactical holdings.
Generally, this allocation varies with age. In the U.S., target-date funds are popular in retirement plans—adjusting allocations based on age. As you age, fixed-income share grows; younger investors hold more equities. Similar logic applies to tactical vs. core allocation. If young, I’d put more in core assets, less in tactical. If older, I’d focus more on cycles—because with only ten years to invest, I wouldn’t want asset declines late in life. Younger investors, with longer horizons, better withstand cyclical volatility.
So it’s a personal choice. I believe core holdings should emphasize protection against monetary inflation. This includes Bitcoin, gold, quality residential real estate, and high-quality stocks with pricing power. These typically do well in inflation. In fact, this strategy mirrors Warren Buffett’s philosophy—choosing companies with high growth and stable margins.
Tactically, when cyclical shifts occur, adjust part of the portfolio to reduce risk. Recently, we’ve been bearish on the prevailing trend—advising against chasing risk or holding extreme positions. Because during sharp volatility, unwinding these positions may become extremely difficult.
AI Bubble
Ryan: Another hot topic: the AI bubble. Some Silicon Valley techno-optimists and true believers claim AI represents a new industrial revolution. They believe AI will dramatically boost productivity, drive GDP growth, even transcend traditional economic cycles.
Michael, how does your liquidity model fit into these discussions? In such a world, does your cycle model still apply? What’s your take on the AI bubble? Do you think a bubble exists?
Michael:
History tells us: this time won’t be different. Recall Japan’s stock bubble. When I entered the industry, Japan’s market was wildly inflated—many thought Japan would dominate global economy. But that optimism didn’t last. After the bubble burst, the economy stagnated for decades. There was even a famous movie about Japan taking over the world—later seen as a cautionary tale.
Then the 2000 tech bubble. Many firms were believed to change the world—but few achieved lasting success. Same with biotech. Mid-20th century, biotech was seen as the future, but now fundraising is tough. These show bubbles and valuations are cyclical. Undoubtedly, the AI bubble may follow similar rules.
But note: we’re discussing stock valuations, not the technology itself. In 2000, tech did become part of life—but that’s separate from market valuations. Railroads in mid-19th century were revolutionary, but few profited from railroad stocks. AI may bring deep tech change, but that doesn’t mean its market valuation won’t undergo cyclical correction.
Limitations of Global Liquidity
Ryan: Back to our opening question: can global liquidity be a universal theory for markets? You said it’s almost—but not quite. Where does global liquidity fail to explain market changes?
Michael:
Global liquidity is a vital market indicator, but many other factors matter. Extreme innovation, for instance, may shift trends in ways liquidity can’t predict. Also, liquidity suits macro-level cycle analysis, but becomes hard for micro decisions—like individual stock picks. For example, liquidity helps decide whether to invest in a sector, but can’t tell if Amazon will outperform Walmart or Costco. Micro analysis needs other tools—global liquidity can’t cover all details.
Also, geopolitical factors. Geopolitical events often impact markets short term. Historically, such shocks are absorbed over time. If Trump and Xi have a major clash, markets may dip short term, but long-term effects fade.
Ryan: I think your model’s value lies in helping investors find signals from macro forces like global liquidity and monetary policy. Do you think investors can filter market noise by watching the Global Liquidity Index and your research? Can your charts and data tell the market’s full story?
Michael:
I hope so. The Global Liquidity Index can serve as a comprehensive statistical tool, helping investors filter overly complex micro data. Not everyone should use it directly—some may need deeper analysis, which we can provide. But if you want a simple, clear reference number, the GLI is highly effective.
In my experience, I find liquidity more important than GDP growth or other economist-focused metrics for understanding markets. I may be skeptical of traditional economics. Often, the easiest-to-measure variables are deemed most important, but reality may differ. It’s like a drunk man searching for keys under a streetlight—not because he lost them there, but because that’s where the light is. Much economic research suffers from this—overemphasizing measurable metrics while missing what truly matters.
Outlook for Next 3–6 Months
Ryan: Last question, Michael. Over the next three to six months, what are you watching most? Any expectations for the market’s basic trajectory?
Michael:
Right now, I’m more focused on the next three to six hours and three to six days in the repo market—this may be the key factor shaping the next few months. Recently, the repo market has expanded, which may pressure the Fed. If leveraged positions fail and unwind, it could escalate into a larger financial crisis—shocking the entire market.
This likely marks the cycle’s end. The key question: what are current policy goals? For example, Trump appointees—especially Steve Mnuchin—want to shrink the balance sheet and cut rates. These goals seem contradictory, but may have deeper logic.
Rate cuts directly stimulate the real economy—lower mortgage rates, weaker dollar boosting export competitiveness. Shrinking the balance sheet may redistribute economic activity—moving wealth from financial markets (Wall Street) to the real economy (Main Street). It’s pro-real-economy policy, not anti-Wall Street, but dampens financial market optimism.
Overall, current Fed policy doesn’t support a Wall Street bull market, but favors a range-bound market environment.
Assets Worth Holding
Ryan: You mentioned the Fed’s QE may shift toward Treasury QE—a trend you’re closely watching. In this environment, which assets are worth holding?
Michael:
In this environment, I’d focus on assets gaining more momentum from real economic growth. Commodities should perform well, and U.S. defense-related equities are worth considering. Also, as a short-term tactical play, five-year Treasuries may be attractive, offering stability during
Join TechFlow official community to stay tuned
Telegram:https://t.me/TechFlowDaily
X (Twitter):https://x.com/TechFlowPost
X (Twitter) EN:https://x.com/BlockFlow_News


