End of Shutdown = Market Rebound? Performance Analysis of US Stocks, Gold, and BTC After Previous Government Reopenings
TechFlow Selected TechFlow Selected
End of Shutdown = Market Rebound? Performance Analysis of US Stocks, Gold, and BTC After Previous Government Reopenings
The incident can be put behind, but the game will continue.
By David, TechFlow
At 5 a.m. Beijing time on November 13, a 43-day government shutdown—setting a new record in U.S. history—is about to end.
The U.S. House of Representatives passed a temporary funding bill by a vote of 222–209 on the evening of November 12 local time, which was then signed into law by Trump.
Thus, the impasse that began on October 1 has officially concluded.
During these 43 days, widespread flight delays, interruptions in food assistance programs, and suspensions in economic data releases cast uncertainty across all sectors of the world’s largest economy.
Now, with the shutdown ending, how will markets react?
For investors in both crypto and traditional financial markets, this is not merely the conclusion of a political event, but also an opportunity to observe how asset prices respond to the elimination of "uncertainty."
Historical data shows that after previous major U.S. government shutdowns, the stock market, gold, and Bitcoin have exhibited distinct price patterns.
This time, as the government reopens and federal funds resume flowing, which assets may benefit?
If you’re short on time, the chart below captures the key takeaways.
The following sections provide deeper insights to help you learn from history and become a smarter investor.
How Exactly Does a Shutdown Affect Investing?
To understand market reactions after a shutdown ends, we must first answer: How does a government shutdown actually impact asset prices?
A government shutdown is far more than just “civil servants taking time off.”
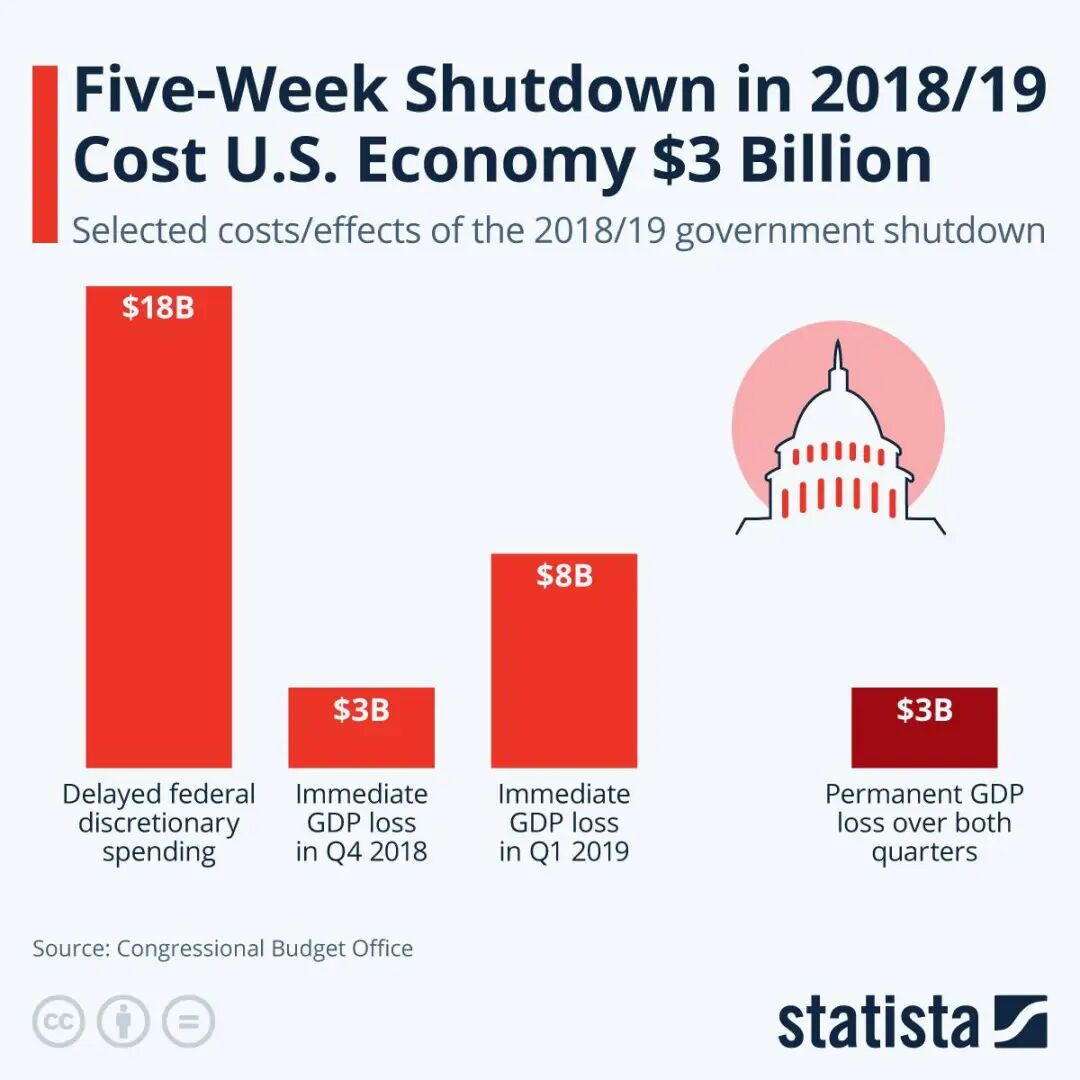
According to estimates by the Congressional Budget Office (CBO), the 35-day shutdown in 2018–2019 caused approximately $3 billion in permanent GDP losses, along with around $8 billion in delayed economic activity.
This latest 43-day shutdown has broken historical records. Although the CBO has not yet released its economic impact assessment, given its longer duration and broader reach, the economic losses are likely significantly greater than those seen in 2018–2019.
Real reductions in economic activity will show up in key indicators such as GDP growth, consumer spending data, and corporate earnings.
But even more important than direct economic losses is the uncertainty itself.
One core principle of financial markets is that investors dislike uncertainty.
When the future becomes unpredictable, capital tends to sell off high-risk assets (technology stocks, growth stocks), increase holdings of safe-haven assets (gold, Treasury bonds, etc.), reduce leverage, and hold cash while waiting.
Conversely, when a shutdown ends, what happens? In theory, the end of a shutdown means:
-
Policy certainty returns – At least for the next few months, government funding is secured
-
Economic data releases resume – Investors regain tools to assess economic fundamentals
-
Fiscal spending restarts – Delayed procurement, wages, and welfare payments begin flowing again, providing short-term economic stimulus
-
Risk appetite recovers – The worst-case scenario is over, and capital starts chasing returns again
This typically triggers a "relief rally," as the removal of uncertainty itself is seen as positive news.
However, it's important to note that such rallies may not last.
After a shutdown ends, markets quickly refocus on economic fundamentals. Therefore, we believe the market impact of a shutdown ending can be divided into two phases:
-
Short-term (1–2 weeks): Emotional recovery driven by reduced uncertainty, usually favorable for risk assets
-
Medium-term (1–3 months): Depends on whether economic fundamentals were truly damaged and other macro factors
For the crypto market, there's an additional consideration: the resumption of regulatory agency operations.
Agencies like the SEC and CFTC were largely paralyzed during the shutdown, with approval processes paused and enforcement actions delayed. How these agencies catch up once operations resume is another variable worth watching.
Next, let's examine historical data to see how the stock market, gold, and Bitcoin performed after previous major shutdowns ended.
Stock Market Retrospective: A "Relief Rally" Always Follows Shutdown Ends
Let’s focus on three prolonged shutdowns that significantly impacted markets and see how investors responded in the U.S. equity market when the government reopened.
Key observations:
1. December 1995 Shutdown (21 days): On the cusp of the tech bubble, modest gains
On December 16, 1995, the Clinton administration and the Republican-controlled Congress deadlocked over budget-balancing plans, forcing a government shutdown.
Market performance:
-
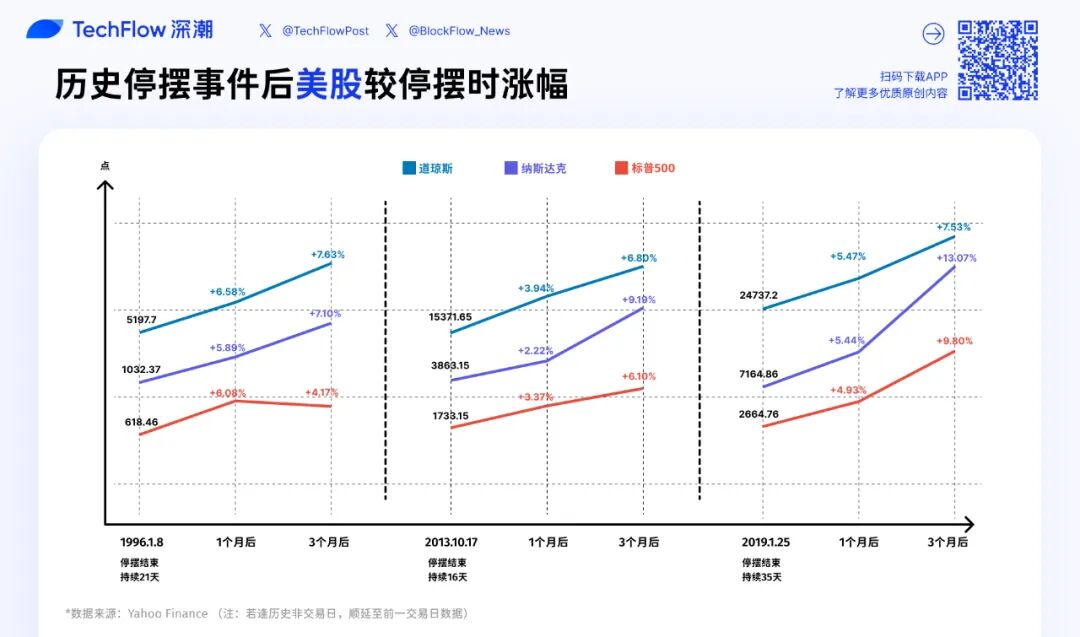
1 month later: S&P 500 rose to 656.07 (+6.1%), Nasdaq reached 1093.17 (+5.9%), Dow Jones hit 5539.45 (+6.6%);
-
3 months later: S&P 500 at 644.24 (+4.2%), Nasdaq at 1105.66 (+7.1%), Dow Jones at 5594.37 (+7.6%);
This resembles a classic pattern: initial gains followed by consolidation. One month after the shutdown, all three indices posted rebounds of around 6%, but gains narrowed by the three-month mark—with the S&P 500 even retreating from its one-month peak.
Despite the distant timeframe, considering the political and economic context, the likely reason is that after digesting the short-term positive news of the shutdown ending, markets reverted to fundamental pricing.
Early 1996 marked the beginning of America’s “golden era” of economic growth. With the rise of personal computers and the internet, technology was in its infancy, inflation was low, and markets were already in a long-term upward trend—the shutdown was merely a brief interruption.
2. October 2013 Shutdown (16 days): Stock market breaks pre-financial crisis highs
On October 1, 2013, Republicans attempted to force President Obama to delay implementation of the Affordable Care Act through a shutdown, leading to another government closure. This shutdown lasted 16 days, ending with an agreement reached in the early hours of October 17.
Market performance:
-
1 month later: S&P 500 rose to 1791.53 (+3.4%), Nasdaq reached 3949.07 (+2.2%), Dow Jones hit 15976.02 (+3.9%)
-
3 months later: S&P 500 at 1838.7 (+6.1%), Nasdaq at 4218.69 (+9.2%), Dow Jones at 16417.01 (+6.8%)
This shutdown occurred at a pivotal historical moment: October 2013 marked the point when U.S. stocks emerged from the shadow of the financial crisis and surpassed their 2007 highs.
The end of the shutdown coincided almost exactly with a technical breakout, amplified by the Fed’s ongoing QE3 quantitative easing program, fueling extreme optimism. The Nasdaq’s nearly 10% gain over three months clearly outperformed traditional blue-chip stocks, with tech stocks once again leading the rebound.
3. December 2018 Shutdown (35 days): Bear market bottom reversal, strongest relief rally on record
On December 22, 2018, Trump insisted on $5.7 billion for the U.S.-Mexico border wall, leading to a standoff with Democrats. The impasse lasted until January 25, 2019, setting a then-record 35-day shutdown—the longest in history until now surpassed by this 43-day episode.
Market performance:
-
1 month later: S&P 500 rose to 2796.11 (+4.9%), Nasdaq reached 7554.46 (+5.4%), Dow Jones hit 26091.95 (+5.5%)
-
3 months later: S&P 500 at 2926.17 (+9.8%), Nasdaq at 8102.01 (+13.1%), Dow Jones at 26597.05 (+7.5%)
This was the strongest rebound among the three shutdowns, driven by unique circumstances.
In Q4 2018, U.S. stocks plummeted nearly 20% from highs due to Fed rate hikes and trade tensions, hitting a low on December 24.
The end of the shutdown coincided almost exactly with the market bottom, compounded by the Fed’s subsequent policy pivot to pause rate hikes—these dual positives likely drove the strong rebound.
The Nasdaq’s 13% gain over three months reaffirmed the high elasticity of tech stocks during periods of recovering risk appetite.
Reviewing historical stock market data post-shutdown, three clear patterns emerge:

First, short-term rallies are highly probable. After each of the three shutdowns, all three major indices rose within one month, gaining between 2% and 7%. The elimination of uncertainty itself is inherently bullish.
Second, tech stocks tend to outperform the broader market. The Nasdaq’s three-month gains of 7.1%, 9.2%, and 13.1% significantly exceeded the Dow Jones’ 7.6%, 6.8%, and 7.5%, respectively.
Third, medium-term performance depends on the macro environment. Post-shutdown results over 1–3 months varied widely: 1996’s initial rise followed by pullback, 2013’s sustained gains, and 2019’s powerful rebound—all driven by their own macro narratives rather than the shutdown itself.
Gold Retrospective: Price Movements Are Not Driven by Shutdowns
When we turn to gold, a very different story emerges compared to equities.
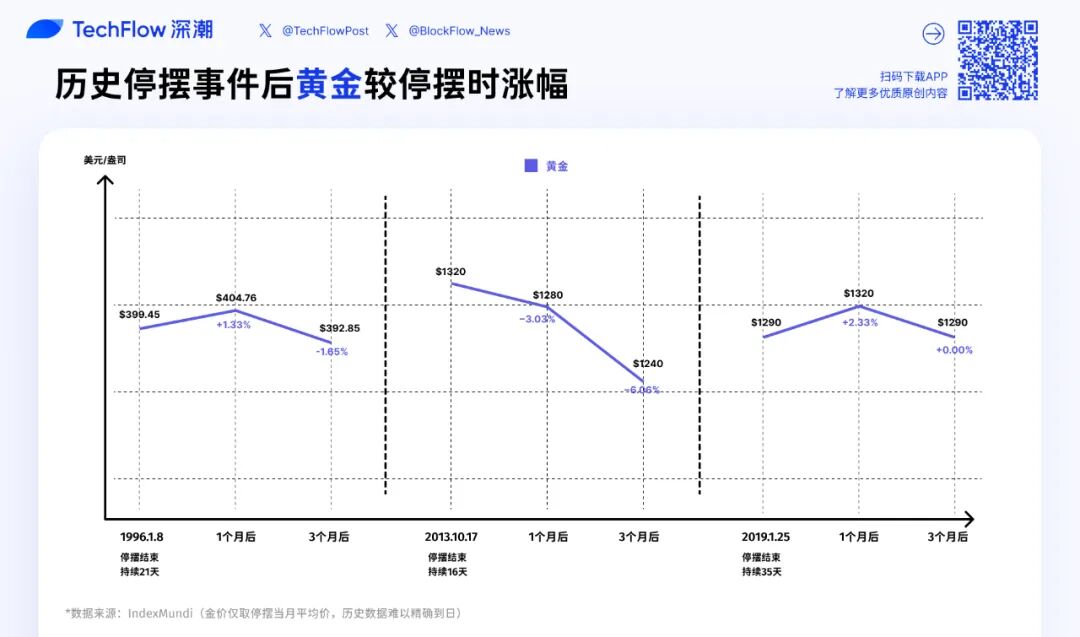
1. December 1995 Shutdown (21 days): Minor fluctuations
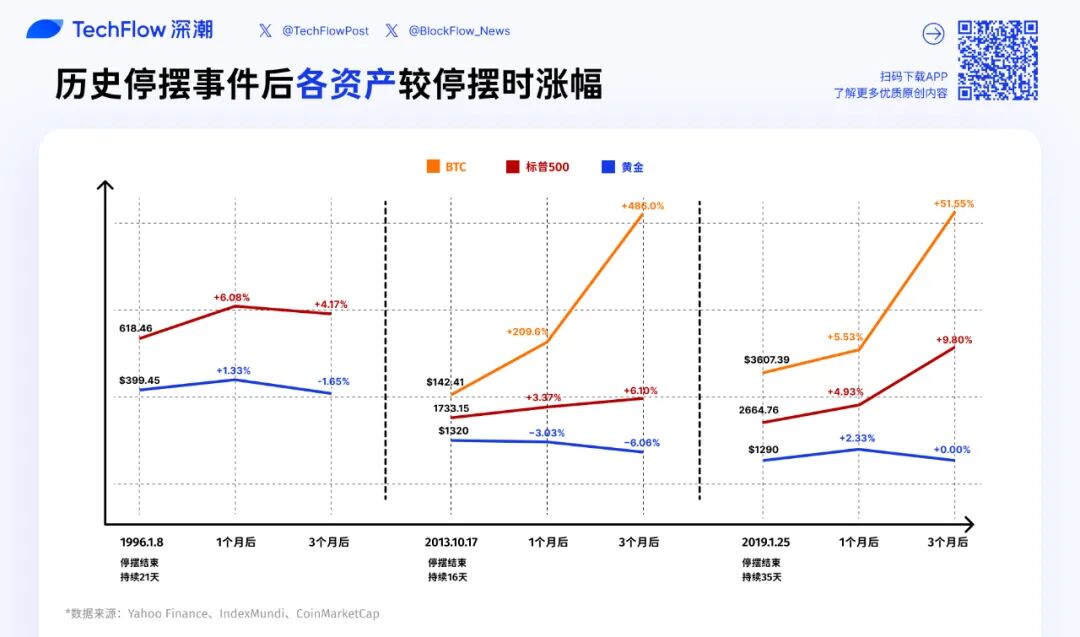
Gold price performance:
-
Shutdown end (January 1996): $399.45/oz
-
1 month later (February 1996): $404.76 (+1.3%)
-
3 months later (April 1996): $392.85 (-1.7%)
The political event had negligible impact on gold prices.
2. October 2013 Shutdown (16 days): Ongoing correction
Gold price performance:
-
Shutdown end (October 2013): $1320/oz
-
1 month later (November 2013): $1280 (-3.0%)
-
3 months later (January 2014): $1240 (-6.1%)
This was the weakest gold performance among the three shutdowns. 2013 was a bear year for gold, falling from $1700 at the start of the year to $1200 by year-end—a decline exceeding 25%.
The reason was the Fed beginning to discuss tapering QE, strengthening the dollar and suppressing gold prices. After the shutdown ended and uncertainty faded, gold’s safe-haven appeal weakened further, accelerating the price decline.
3. December 2018 Shutdown (35 days): Rise then retreat
Gold price performance:
-
Shutdown end (January 2019): $1290/oz
-
1 month later (February 2019): $1320 (+2.3%)
-
3 months later (April 2019): $1290 (0%)
During this shutdown, U.S. stocks suffered the late-2018 crash, pushing safe-haven demand and lifting gold from $1230 to $1290. After the shutdown ended, gold briefly spiked to $1320, but as equities rebounded and risk appetite returned, prices fell back to pre-rally levels—resulting in zero net change over three months.
In both the 2013 and 1996 shutdowns, equities rose 3–6% after reopening, while gold either declined (2013: -6.1%) or traded flat (1996: -1.7%).
This aligns with the general understanding that when uncertainty lifts and risk appetite returns, capital flows out of safe-haven assets and into risk assets.
If history repeats, the end of this 43-day shutdown could place gold in one of two scenarios:
Scenario 1: Rapid unwinding of safe-haven demand. If gold prices rose during the shutdown due to safe-haven buying, the end of the shutdown could trigger profit-taking, leading to a short-term 5–10% correction. This was most evident in the 2013 case.
Scenario 2: Macro risks remain unresolved. Even if the shutdown ends, if concerns about U.S. fiscal health, debt ceiling debates, or recession risks persist, gold could maintain strength or even continue rising.
After all, the shutdown is only temporarily over.
Based on current gold prices, the end of the shutdown may ease short-term safe-haven demand, but is unlikely to reverse gold’s long-term upward trend.
Bitcoin Retrospective: Limited Data, But Still Informative
Finally, the question most relevant to crypto investors: What happens to Bitcoin after a shutdown ends?
To be honest, historical data is extremely limited. Bitcoin did not exist during the 1996 shutdown, and during the 2013 shutdown, BTC’s market cap was tiny and amid a super bull run. The only truly meaningful reference is the 2018–2019 episode.
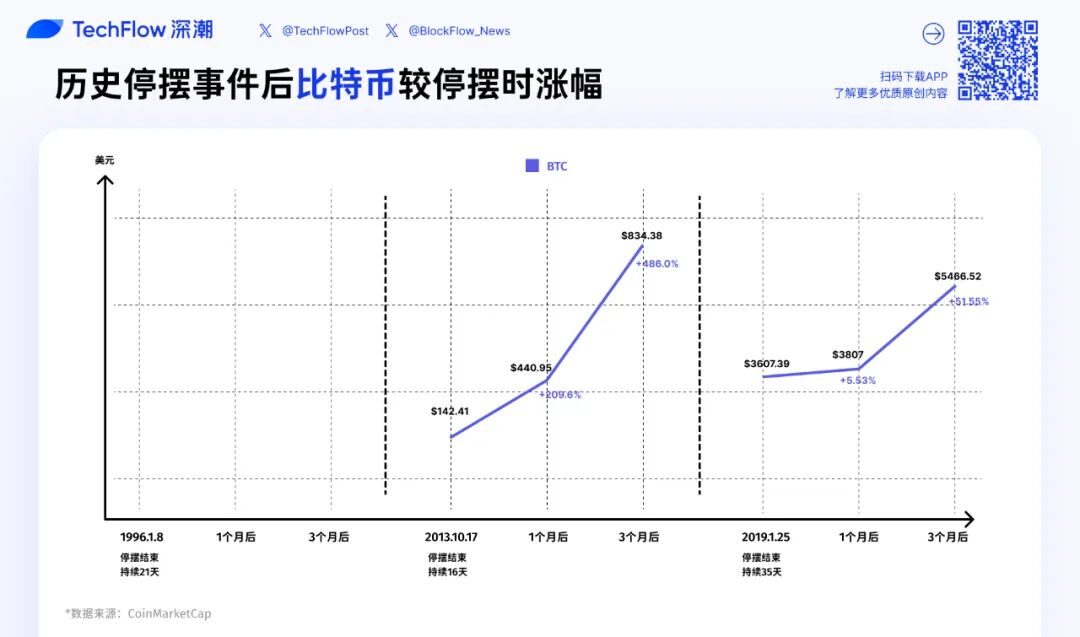
1. October 2013 Shutdown (16 days): Bull market blip, unrelated to shutdown
BTC price performance:
-
Shutdown end (2013-10-17): $142.41
-
1 month later: $440.95 (+209.6%)
-
3 months later: $834.48 (+485.9%)
This data looks extreme—tripling in one month, nearly six times in three months.
2013 was one of Bitcoin’s craziest bull years, surging over 5000% annually—from $13 at the start to a peak of $1,147 by year-end.
October marked the acceleration phase of this super bull run. BTC had just rebounded sharply after the FBI shut down Silk Road, and the market quickly resumed its most explosive upward move.
However, there is almost no causal link between this shutdown and BTC’s price action—government shutdowns are essentially noise-level events in Bitcoin’s pricing logic.
2. December 2018 Shutdown (35 days): Bear market bottom, key turning point
BTC price performance:
-
Shutdown end (2019-01-25): $3607.39
-
1 month later: $3807 (+5.5%)
-
3 months later: $5466.52 (+51.5%)
In December 2018, BTC was near the bottom of a prolonged bear market. From its December 2017 high of $19,000, BTC had crashed over 80%, hitting a low of $3,122 on December 15, 2018. The shutdown began (December 22) almost exactly when BTC found its bottom.
In the month following the shutdown end, BTC only saw a modest 5.5% rebound—far less than the 4.9–5.5% gains in U.S. stocks.
But by the three-month mark, BTC surged 51.5%, significantly outperforming the S&P 500’s 9.8% and the Nasdaq’s 13.1%.
Several key factors were at play:
First, BTC’s own bottom-reversal dynamics. Early 2019 saw growing consensus that “the worst is over”: miners capitulated, retail investors exited, but institutions began positioning.
Second, improving macro conditions. The Fed signaled dovishness in early 2019, improving global liquidity expectations—positive for high-risk assets like BTC.
Third, BTC’s market cap was around $60 billion at the time, much smaller than equities and with lower liquidity, resulting in higher volatility. When risk appetite returned, BTC naturally exhibited stronger elasticity.
Compared to gold and equities, Bitcoin appears to reflect a combination of macro beta and its own cycle.
In the short term, BTC behaves like a high-beta risk asset.
After the shutdown ended and uncertainty lifted, BTC’s rebound (+12%) over 1–3 months was similar to the Nasdaq (+5.4%) and far exceeded gold (+2.3%). This suggests that over a 1–3 month horizon, BTC’s pricing logic aligns more closely with technology stocks than with safe-haven assets.
But in the medium to long term, BTC follows its own cycle. After rising to $5,200 in April 2019, BTC continued climbing to $13,800 by June—outperforming any traditional asset. This surge was likely driven by the approaching four-year halving cycle, followed by increasing institutional and corporate adoption.
Whether the government was shut down became irrelevant.
Looking ahead, how might BTC react if this 43-day shutdown ends?
Short-term (1–2 weeks): If the end of the shutdown triggers a stock market "relief rally," BTC is likely to follow higher;
Medium-term (1–3 months): The key will be the macro backdrop. If the Fed remains accommodative, economic data holds up, and no new political crises emerge, BTC could sustain its rally.
But don’t forget: the crypto market currently lacks a breakthrough narrative. Expecting BTC’s price to be driven purely by internal momentum is unrealistic.
Shutdown Ends, But the Game Continues
The 43-day shutdown is ending—but this isn’t the end, it’s the beginning of a new market phase.
History shows that markets typically experience a short-term bounce after a shutdown ends, but the sustainability of such rallies should be viewed rationally.
When you see markets rise 5% post-shutdown, don’t rush in out of FOMO; when you see BTC pull back short-term, don’t panic-sell.
Stay rational, focus on fundamentals, manage risk—principles that don’t change because of a shutdown.
Events may close the chapter, but the game goes on.

Join TechFlow official community to stay tuned
Telegram:https://t.me/TechFlowDaily
X (Twitter):https://x.com/TechFlowPost
X (Twitter) EN:https://x.com/BlockFlow_News