Summarizing 35 Years of U.S. Interest Rate Cycle Patterns: Can a Rate Cut 42 Days Later Spark Bitcoin's Second Bull Run?
TechFlow Selected TechFlow Selected
Summarizing 35 Years of U.S. Interest Rate Cycle Patterns: Can a Rate Cut 42 Days Later Spark Bitcoin's Second Bull Run?
History is too similar; rate cuts are unlikely to become the fundamental driver for the crypto market's rise.
 Navigating Web3 tides with focused insights
Author: Nanzhi, Odaily Planet Daily
Since Bitcoin surpassed its previous high of $69,000 set three years ago, it has been trading in a wide range between $50,000 and $70,000 for several consecutive months. After the Bitcoin halving, the only remaining major anticipated narrative is Federal Reserve rate cuts.
The timing of this event is now all but certain. According to CME FedWatch data, the probability of a Fed rate cut on September 24 has risen to 100%, with only the magnitude in question—either 25 or 50 basis points. Currently, both scenarios are roughly equally likely.
Can such a rate cut spark a significant rally in Bitcoin and the broader crypto market? In this article, Odaily reviews the five major Fed easing cycles between 1989 and 2019 to explore whether any objective patterns exist.
Revisiting 2018–2020
The Fed's rate hiking cycle ended on December 19, 2018. The first cut occurred three quarters later, on July 31, 2019. This marked the first—and so far only—rate easing cycle experienced by Bitcoin and the crypto market. Below is a chart showing the price movements of Bitcoin, the Nasdaq Composite Index, and gold:
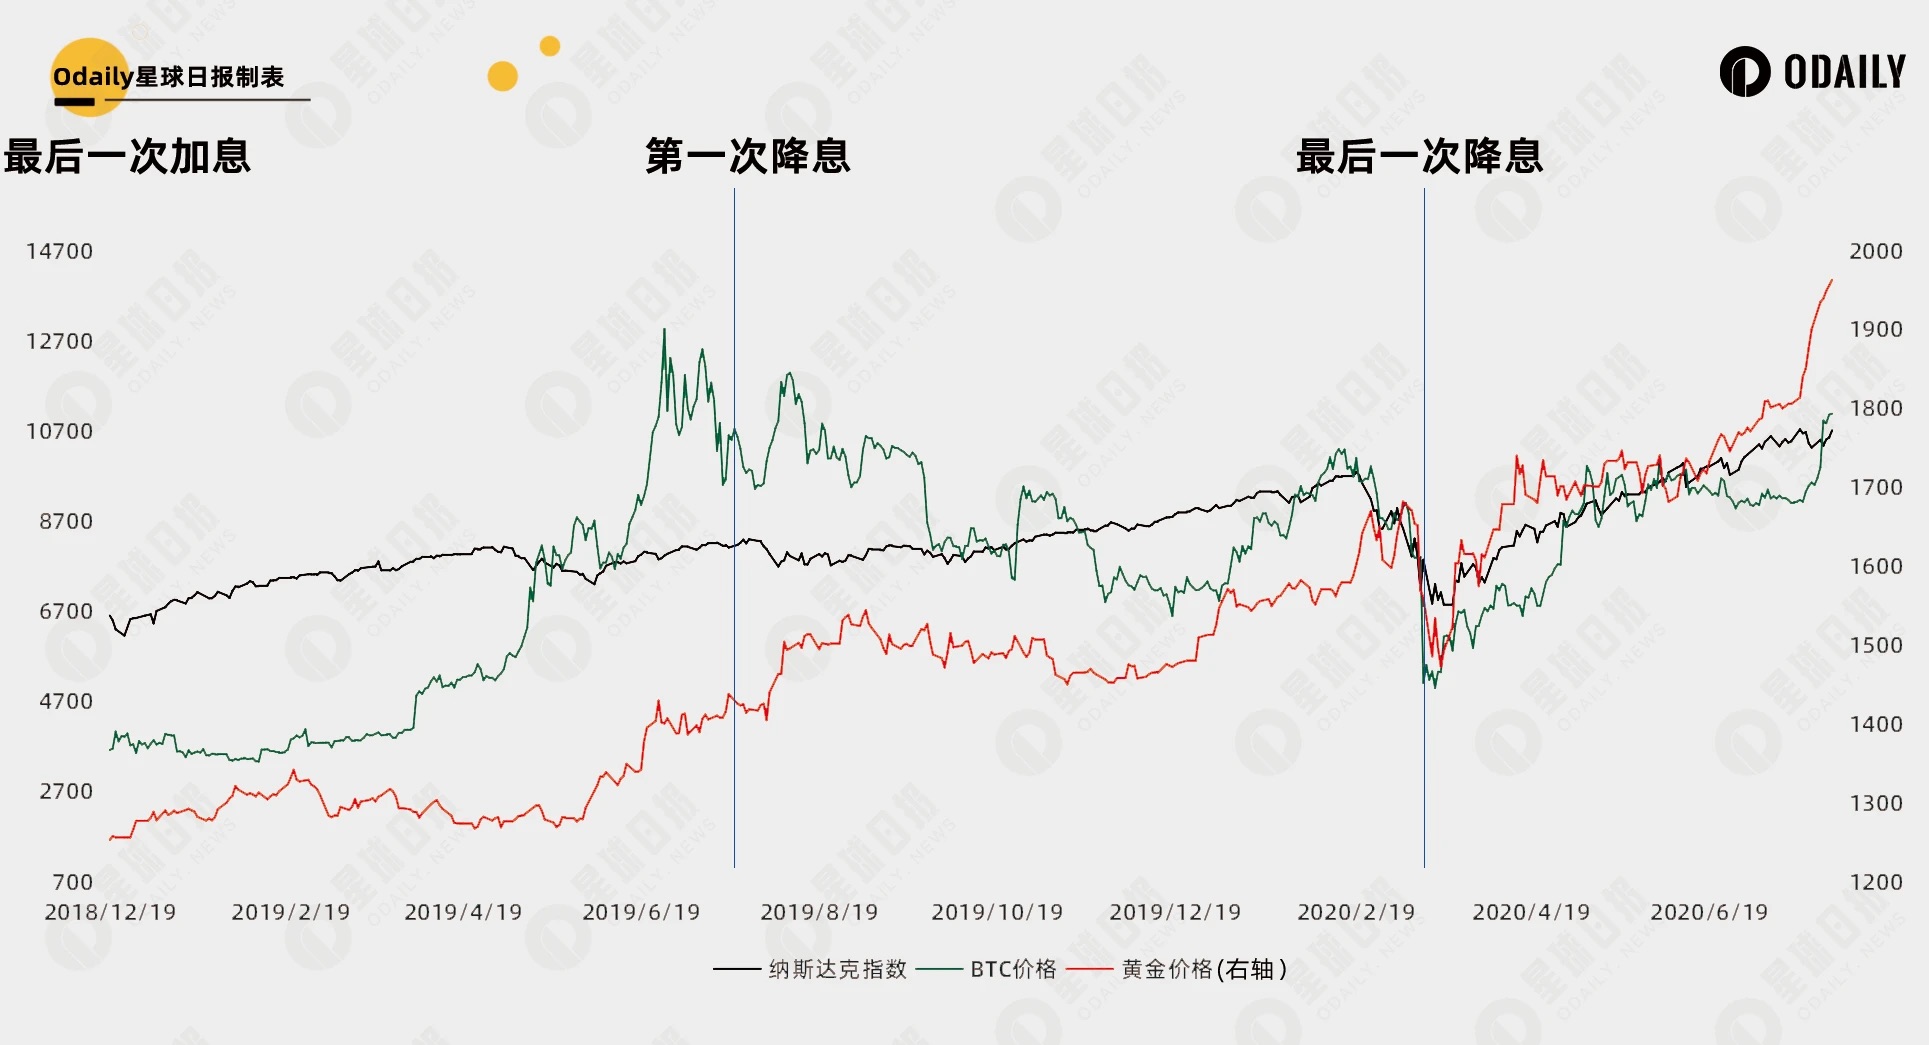
The chart clearly shows that rate cuts were already priced in well before they occurred, especially for Bitcoin, which had the largest lead. Between the final hike and the first cut, Bitcoin surged 161.7%, the Nasdaq rose 23.2%, and gold increased 13.7%. After the cuts began, only the Nasdaq and gold continued rising, while Bitcoin entered a prolonged period of wide-ranging volatility.
Prior to the last rate cut (March 15, 2020), Bitcoin suffered the well-known "Black Thursday" crash on March 12, amid global market turmoil. By then, the Fed had already lowered rates to 0.00%–0.25%, prompting massive quantitative easing. The resulting liquidity overflow eventually fueled the 2021 bull run in crypto.
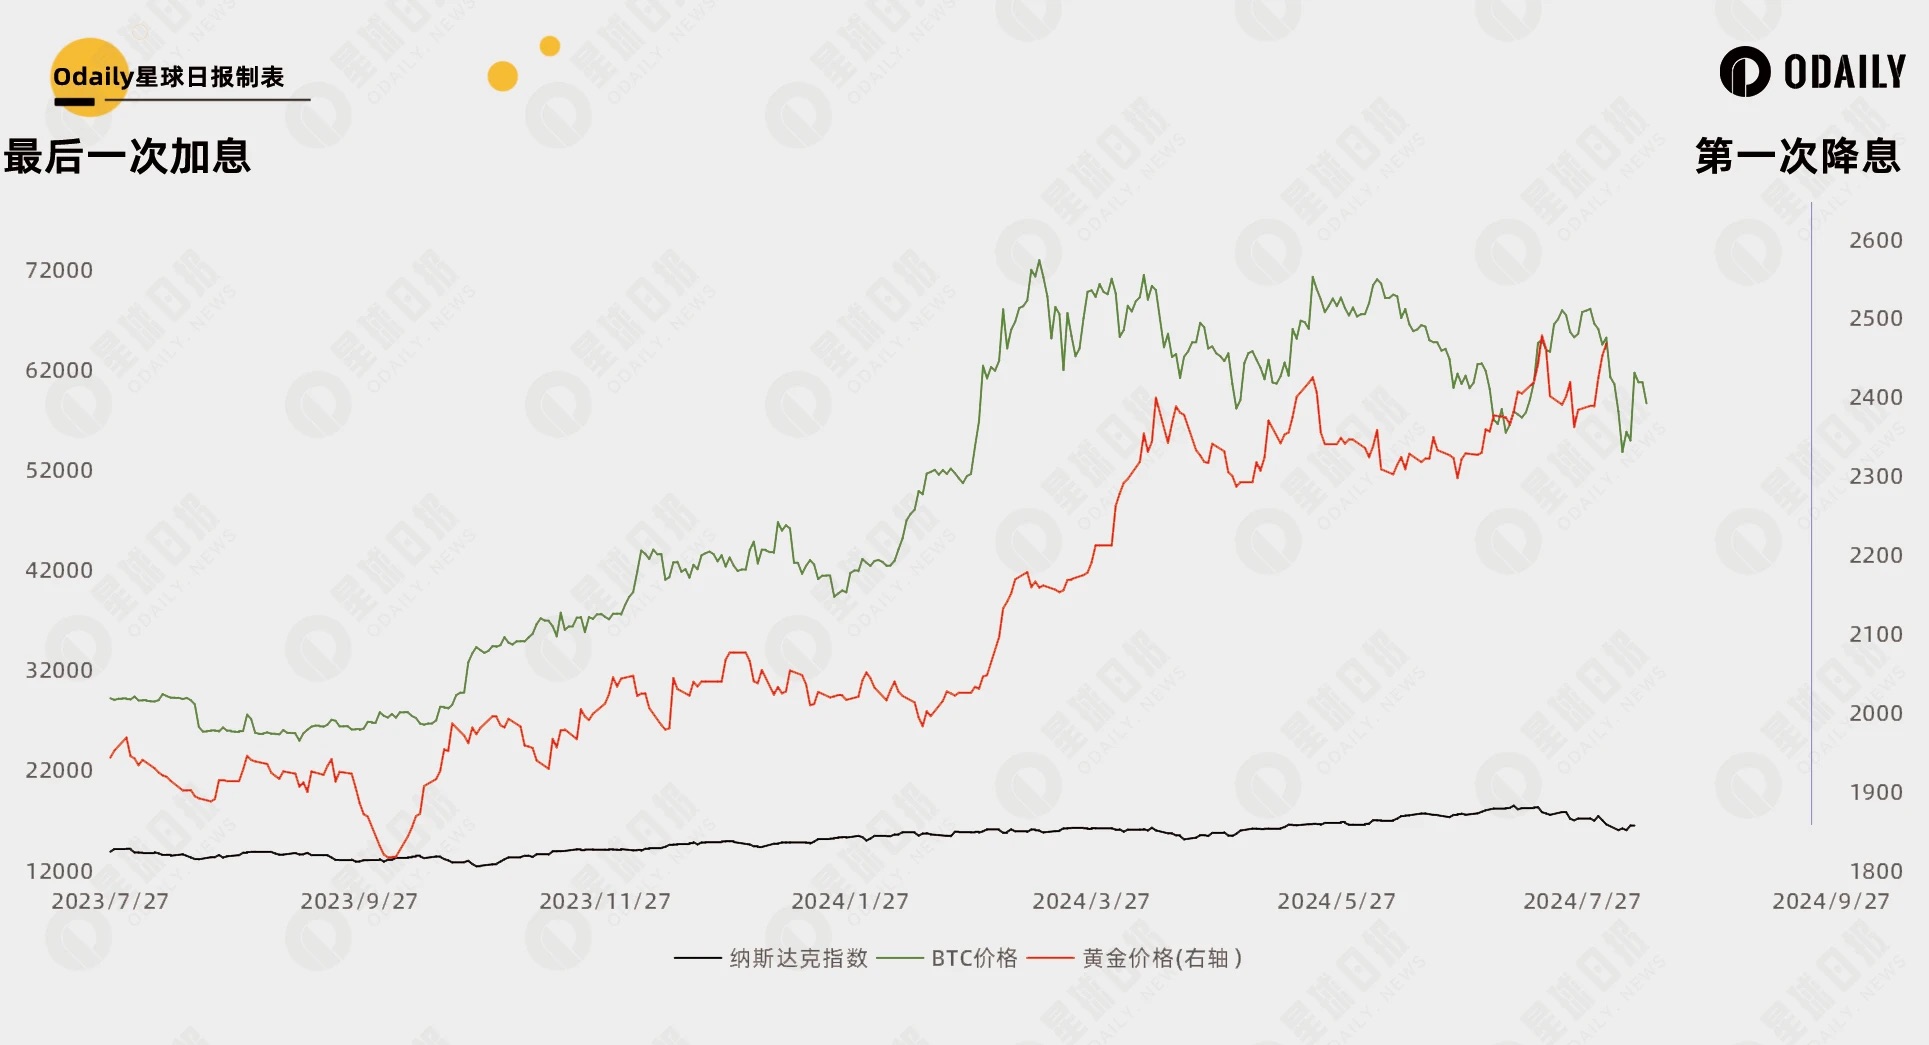
Below is a comparison of the three markets following the last rate hike on July 27, 2023. "Then" feels like "now." From the final hike to August 2 (the latest available date for gold data), Bitcoin rose 122.6%, the Nasdaq gained 19.4%, and gold climbed 27%. Bitcoin may have once again priced in the end of rate hikes.
Looking Back: 1989–2008
The prior U.S. easing cycles trace back to 2007, long before Bitcoin’s creation. However, since crypto markets are generally considered to be closely correlated with U.S. equities, we use the Nasdaq and gold prices as proxies to study the relationship between rate cuts and asset price movements.
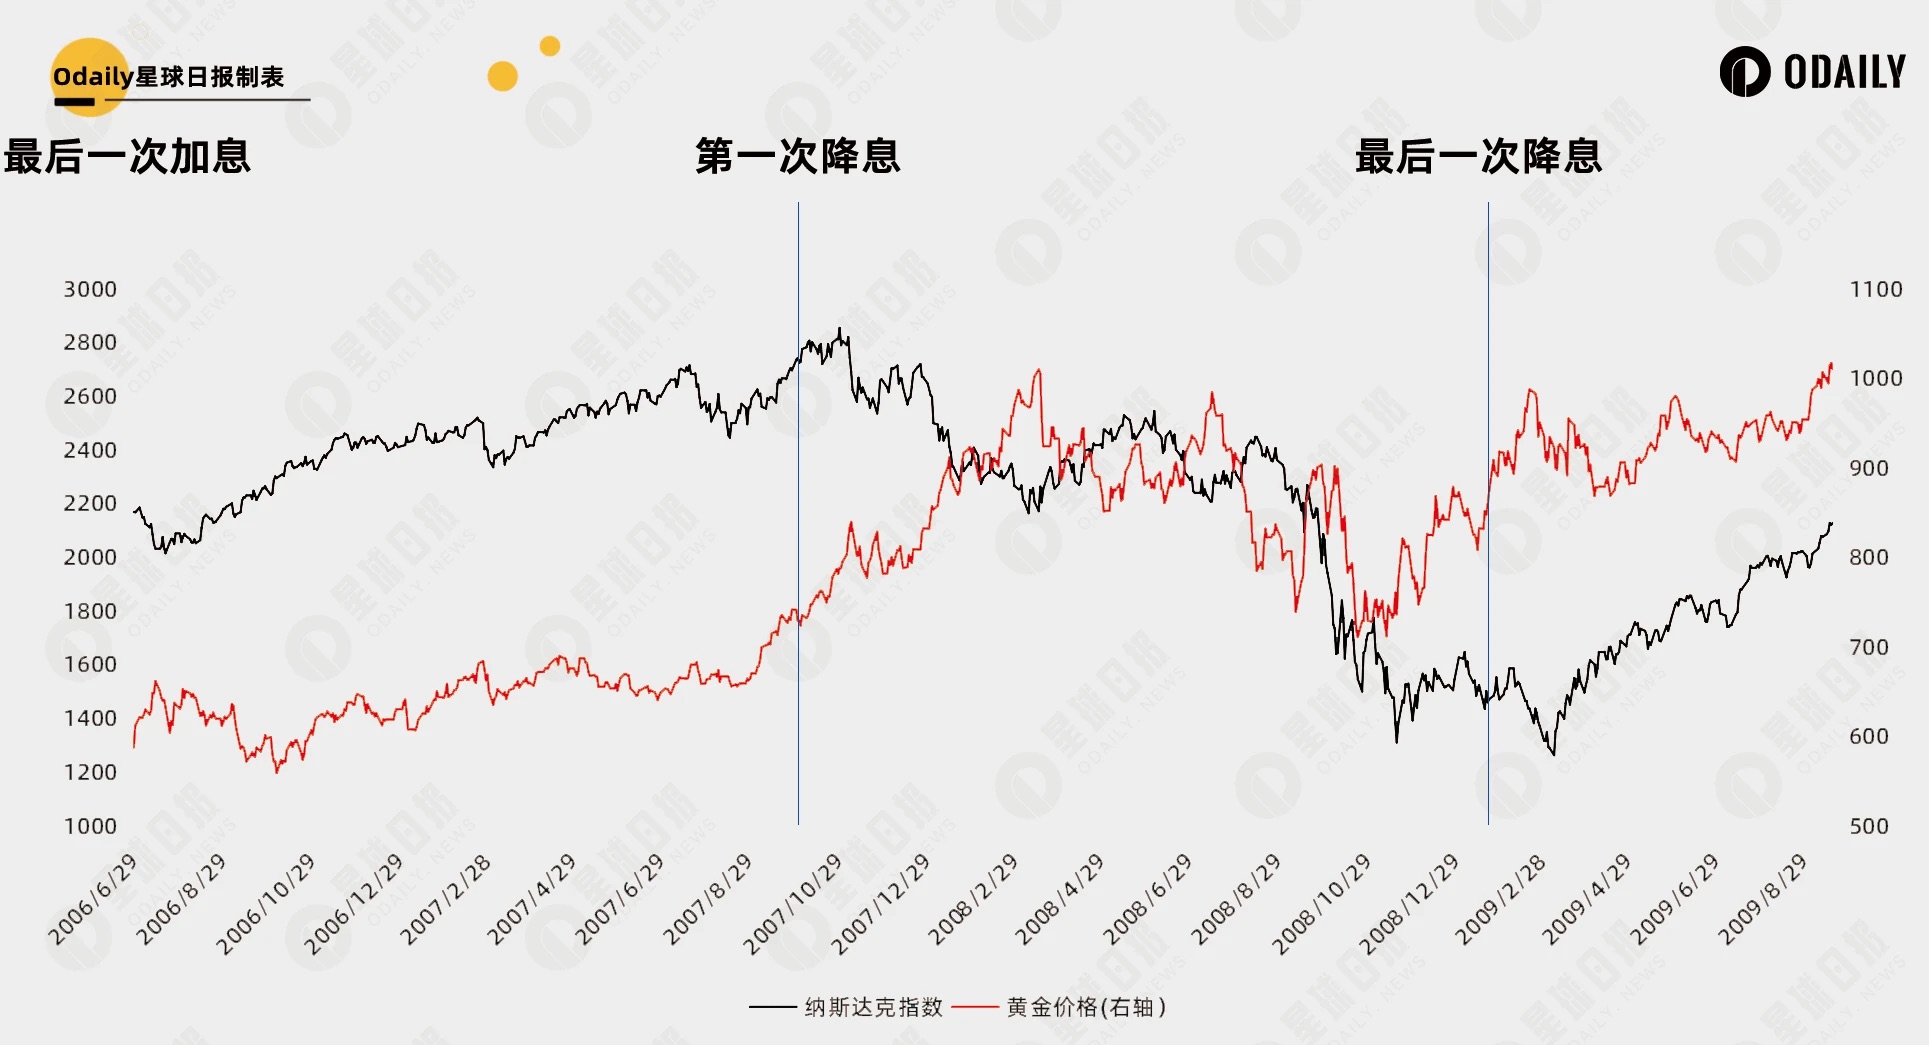
2006–2008: Hard Landing
In the 2006 cycle:
-
The final rate hike occurred on June 29, 2006, raising the federal funds rate to 5.25%.
-
The first rate cut came on September 18, 2007, reducing the rate from 5.25% to 4.75%.
-
The final cut was on December 16, 2008, bringing the rate down to 0%–0.25%.
Price trends:
-
Nasdaq rose before the cuts, declined during the easing phase, and rebounded around the end of the cycle.
-
Gold rose before the cuts and continued an upward trend with volatility afterward.
Historical context:
The subprime mortgage crisis erupted in 2007, leading to systemic financial collapse. The Fed began cutting rates in September 2007 to counter worsening financial conditions and economic slowdown. Bitcoin was later created in the aftermath.
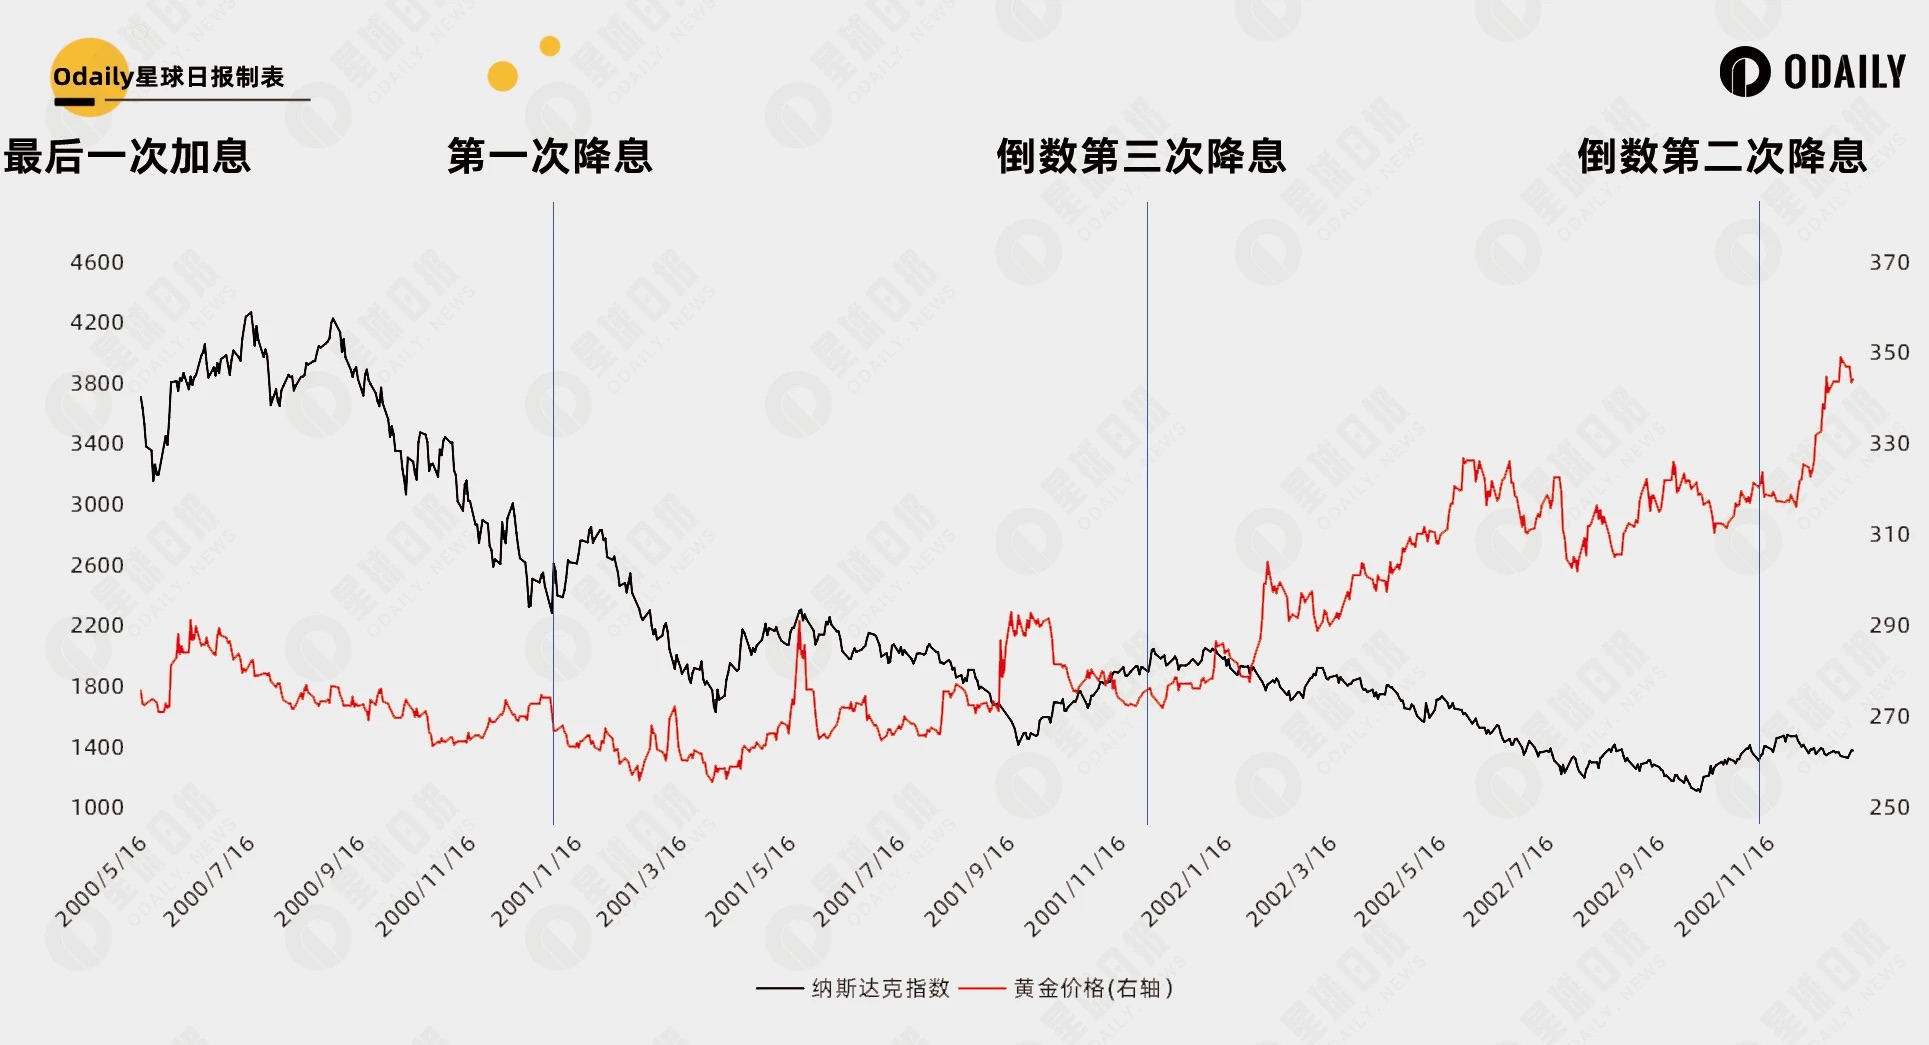
2000–2003: Hard Landing
In the 2000 cycle:
-
The final hike occurred on May 16, 2000, raising the rate to 6.50%.
-
The first cut was on January 3, 2001, lowering the rate from 6.50% to 6.00%.
-
The last cut took place on June 25, 2003, bringing the rate down to 1.00%.
Price trends:
-
Nasdaq rose before the cuts, fell during the easing period, and began recovering near the end (first peaking in June 2004, not shown in the chart).
-
Gold rose before the cuts and continued rising with volatility afterward.
Historical context:
The dot-com bubble burst in 2000, causing sharp declines in tech stocks and internet company valuations. The Fed initiated a series of rate cuts in early 2001 to ease recessionary pressure. However, the market collapse and plunging corporate earnings led to extremely pessimistic sentiment.
1995: Soft Landing
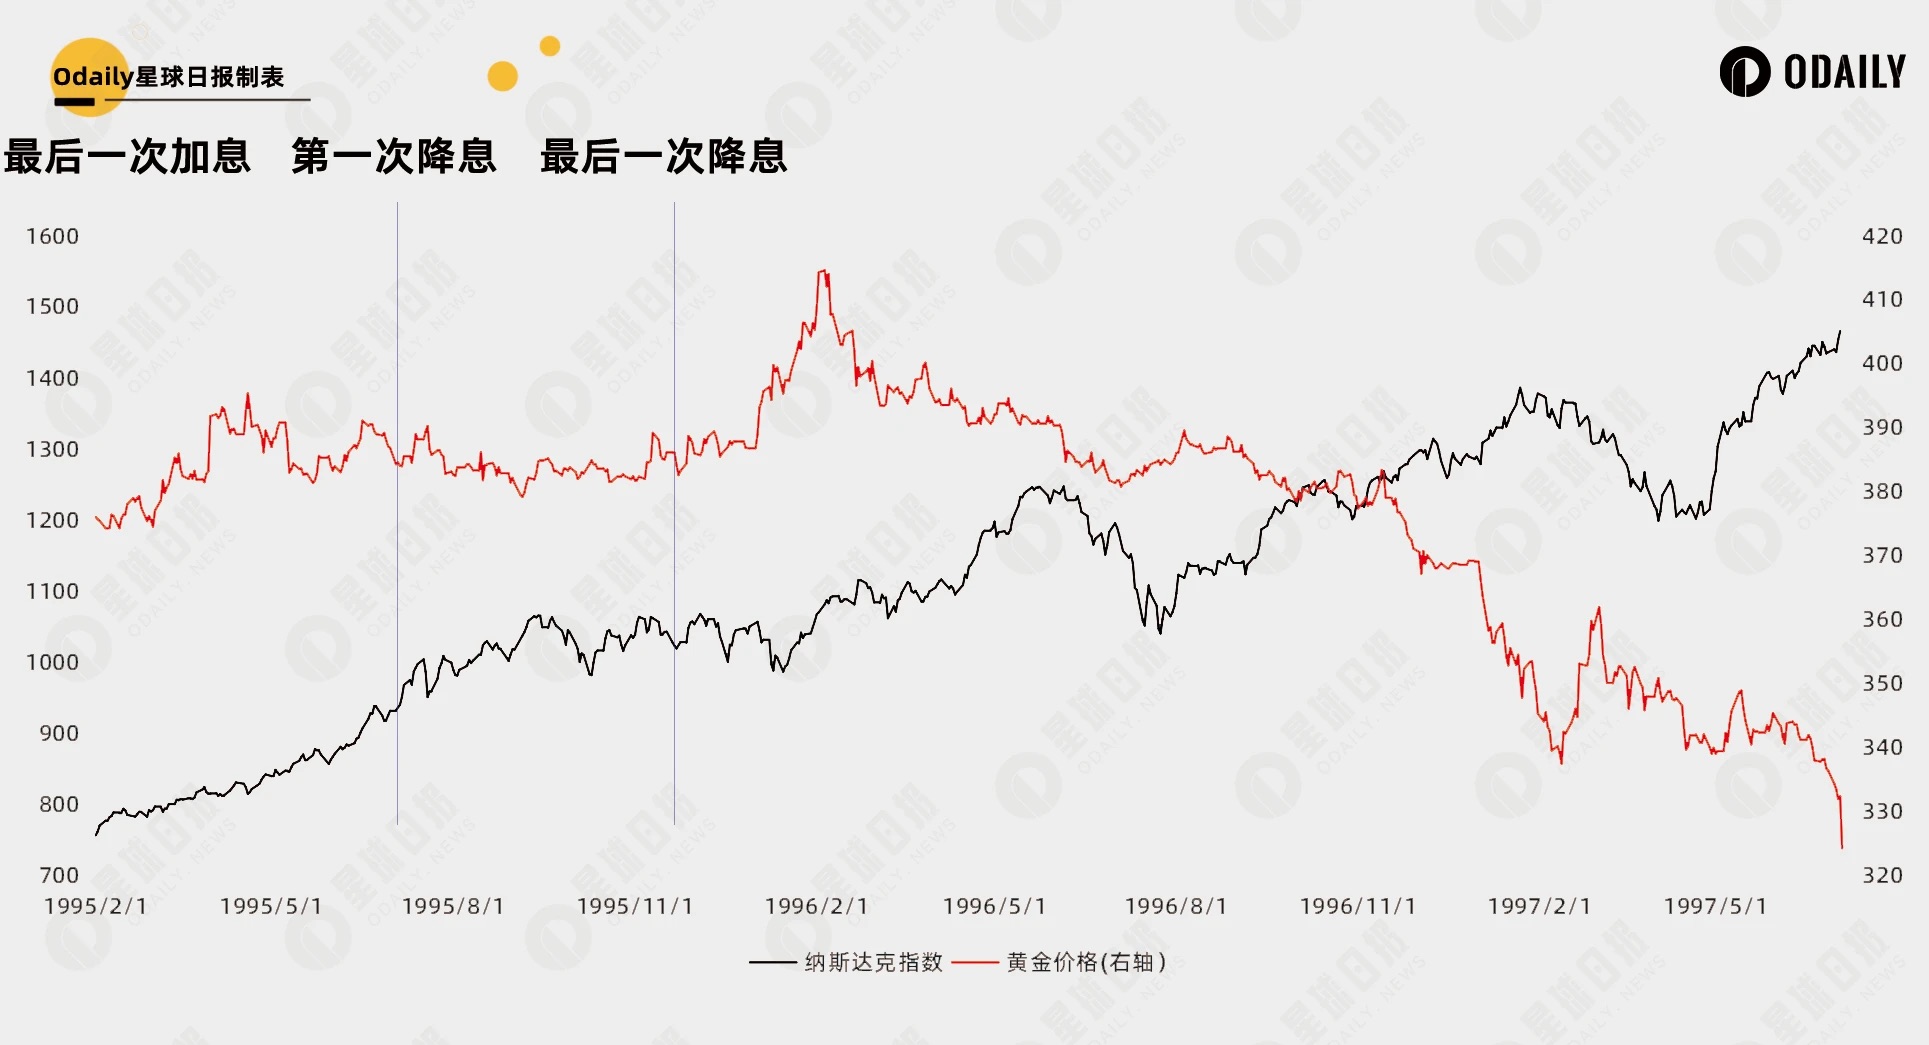
In the 1995 cycle:
The final rate hike occurred on February 1, 1995. The easing began on July 6 of the same year, with the last cut on December 19. This cycle was notably brief compared to others.
Price trends:
-
Nasdaq rose both before and after the rate cuts.
-
Gold fluctuated before the cuts and declined afterward.
Historical context:
The U.S. economy was relatively strong at the time, entering an early phase of technological innovation and internet development. The 1995 rate cuts were preventive measures aimed at supporting continued economic expansion, hence their short duration.
1989–1992: Soft Landing
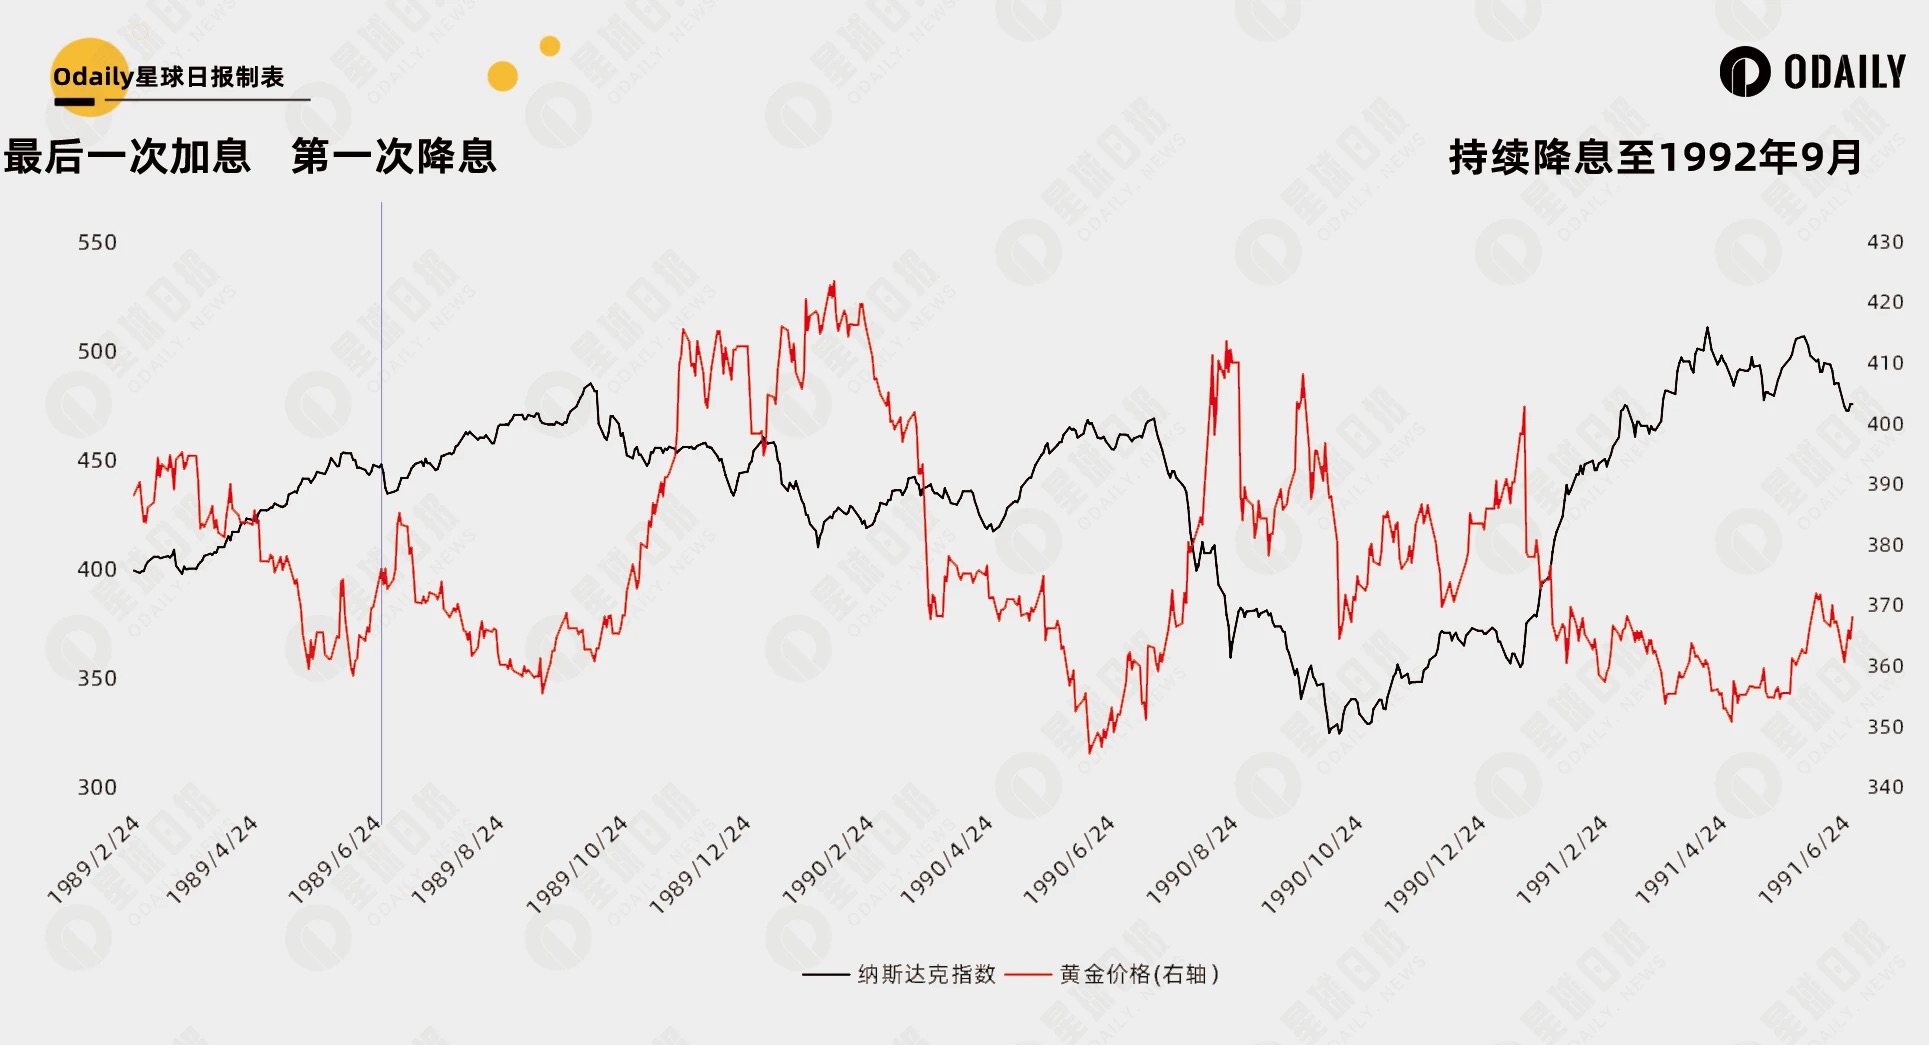
In the 1989 cycle:
-
Last hike: February 24, 1989, raising the rate to 9.75%.
-
First cut: June 28, 1989, lowering the rate to 9.5%.
-
Last cut: September 4, 1992, bringing the rate down to 3.00%.
Price trends:
-
Nasdaq rose before the cuts and traded sideways afterward.
-
Gold declined before the cuts and remained volatile afterward.
Historical context:
The U.S. economy underwent a prolonged expansion in the 1980s. By 1989, the expansion had lasted seven years—the longest post-war growth period at the time. Late in the decade, inflation pressures mounted, prompting the Fed to raise rates in 1988. These hikes, however, began to restrain growth by 1989.
Conclusion
In summary, several key conclusions emerge:
-
Rate cuts do not directly trigger bull markets in equities or major asset classes; their effects are often already priced in well in advance.
-
The impact of rate cuts on future markets depends on the overall economic backdrop—whether cuts are proactive (to support growth) or reactive (in response to black swan events). From the equity perspective, it reflects a tug-of-war between economic resilience and loose liquidity pricing.
-
Gold typically benefits from lower interest rates (and a weaker dollar), tending to rise, with stronger performance particularly evident during hard landings.
Therefore, based on historical patterns, rate cuts alone are unlikely to serve as the fundamental driver for Bitcoin and the crypto market. Since 2024, we've witnessed events like Bitcoin spot ETF approvals and the halving. What the market now needs is the next major narrative or fundamental shift.
Join TechFlow official community to stay tuned
Telegram:https://t.me/TechFlowDaily
X (Twitter):https://x.com/TechFlowPost
X (Twitter) EN:https://x.com/BlockFlow_News
 Odaily