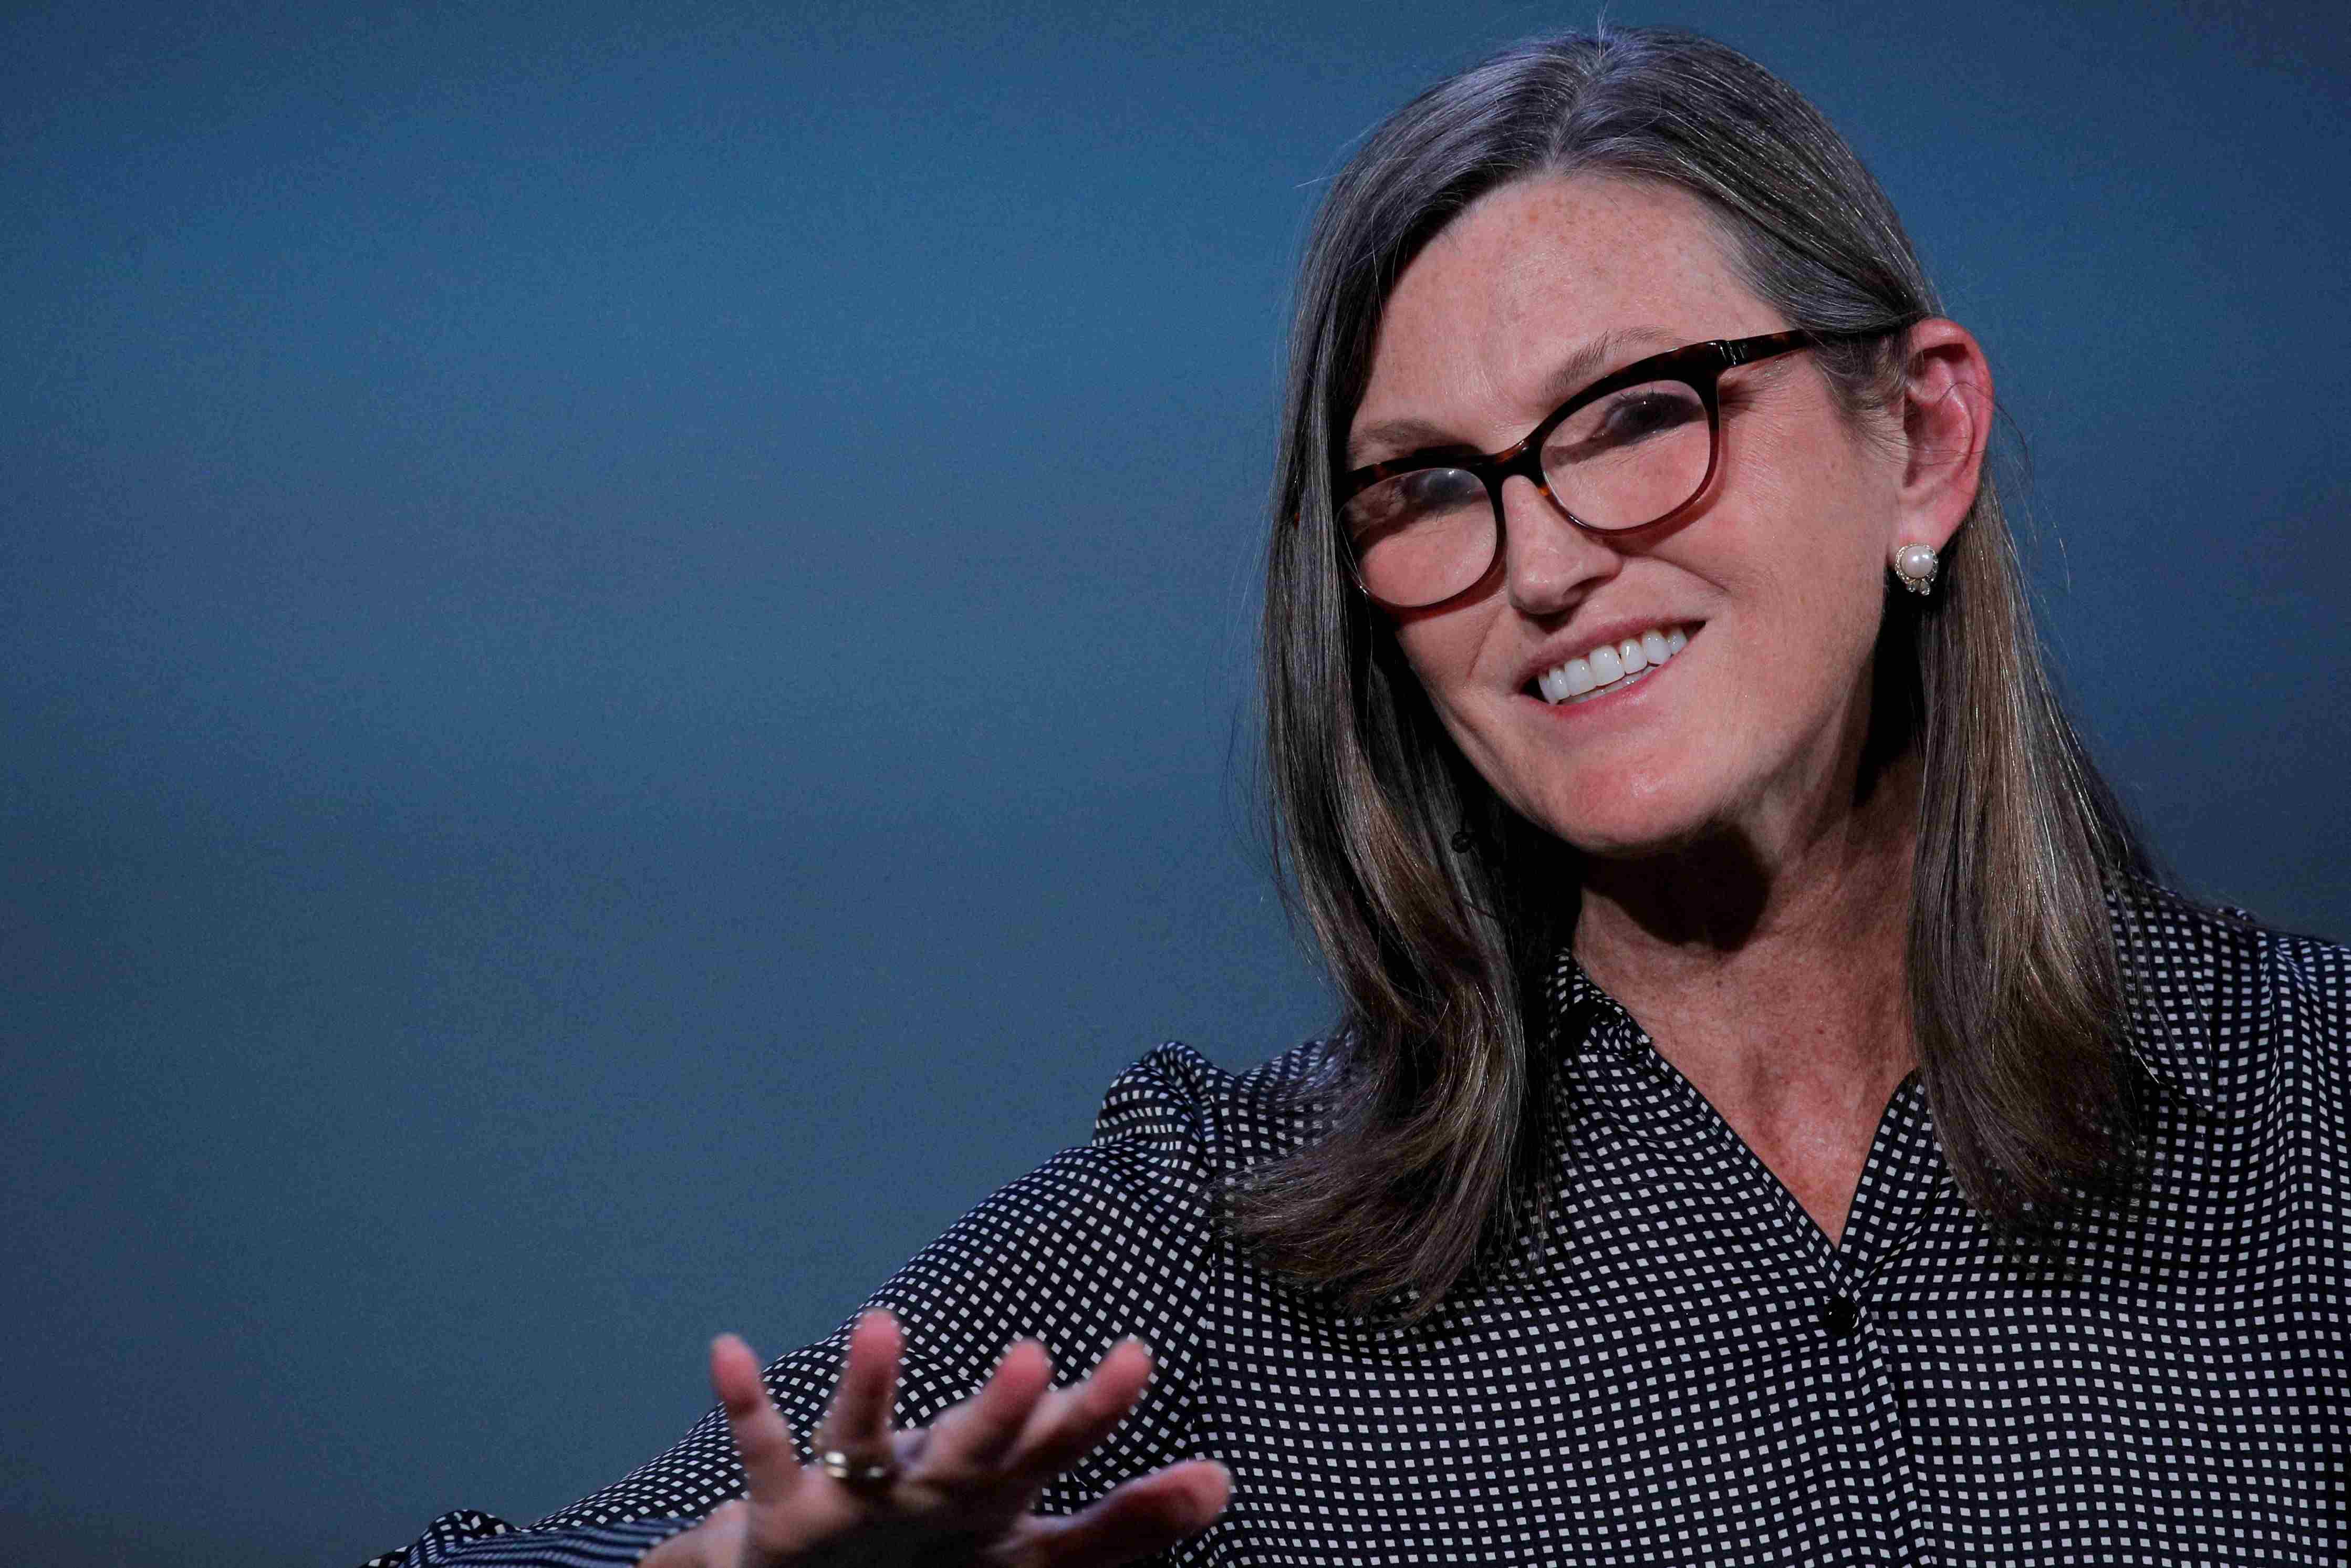
"Cathie Wood" Explains: ARK's Company Valuation Methodology, Using Tesla as an Example
TechFlow Selected TechFlow Selected
"Cathie Wood" Explains: ARK's Company Valuation Methodology, Using Tesla as an Example
Most of Tesla's commercial value comes from Robotaxi, which could launch a robotaxi network in the coming years.
 Navigating Web3 tides with focused insights
Author: Li Xiaoyin
Source: Wall Street Insights
On July 13, in the monthly series program "In the Know," renowned investor Cathie Wood, known as "ARK Lady," joined Tasha Keeney, Director of Investment Research and Institutional Strategy at her firm ARK Invest, and Sam Korus, Director of Autonomous Technology and Robotics Research, to discuss how ARK evaluates companies and makes investment decisions. Wood also shared her views on U.S. Treasury yields and stock market concentration.
Below are highlights from their discussion:
1. ARK uses a combined top-down and bottom-up valuation approach, assessing companies by business lines.
2. In ARK’s 1-to-10 scoring system for companies, if one category scores below 7, it warrants attention; if two categories decline, we seriously consider reducing portfolio risk.
3. Most of Tesla's commercial value will come from Robotaxi, which will transform its business model—from one-time revenue from EV sales to recurring revenue streams generated by Robotaxis.
4. We believe Tesla could be the first automaker to scale robotaxis widely, with per-mile costs potentially dropping as low as 25 cents after scaling.
5. Tesla’s volatility depends on execution, with key influencing factors including key personnel (Musk), staff turnover, moats, technological disruption/adoption, and battery costs.
6. Thanks to cash flow from autonomous driving technology and successful production scaling, Tesla is expected to grow annual vehicle sales from under 2 million today to between 6 million and 14 million.
7. We believe there is a high probability that Tesla will launch a robotaxi network within the next few years—very likely within the next two to three years.
8. By 2029, Tesla’s EV business enterprise value to EBITDA ratio is projected to compress from today’s 60x to 19x, while revenue growth and margin expansion remain strong.
9. Long-term, robotics, energy storage, artificial intelligence, blockchain technology, and multi-omic sequencing could push real GDP growth from 3% into the 6% range.
Following is the transcript of the discussion:
Cathie Wood: Hello everyone. Today we’re doing something a bit different—we’d like to introduce a new monthly segment where we bring to life some of the stocks and companies we focus on in innovation.
Today, we’ll specifically walk you through our bottom-up analysis. I think we're well known for using rights-based law to analyze markets top-down. But we want to highlight more of our analytical process—not just top-down, but also bottom-up, especially our scoring and valuation system. For this, I’d like to introduce Tasha Keeney and Sam Korus, who’ve done excellent work on Tesla. Tasha is our Director of Investment Analysis and Institutional Strategy, and Sam leads research on autonomous tech and robotics.
So we’d like to walk you through our valuation framework, using Tesla as an example since we've published extensively on it. While we haven’t released much yet on other stocks, we’ll cover NVIDIA in another webinar. Next Thursday is our quarterly webinar—stay tuned. After that, I’ll do a non-commercial case study each month. Now, Tasha, Sam, and I will walk you through our valuation system. Tasha?
Tasha Keeney: Thank you, Cathie. As many know, ARK is deeply focused on disruptive innovation, and our investment team is organized by technology. Sam and I have collaborated nearly a decade now, focusing on autonomous driving and electric vehicles. We start with all the top-down analysis we’ve done in these areas, which we’ll touch on later.
Then, once we identify potential portfolio candidates, we conduct bottom-up work. This includes both qualitative and quantitative metrics. On the quantitative side, you’re familiar with our Tesla blog post outlining our 2029 price target—a blend of top-down and bottom-up analysis. So Sam, why don’t you kick off by walking us through your top-down research on EVs?
Sam Korus: Sure. This ties back to what Cathie mentioned—really leveraging the rights-based law and cost trajectory models. Looking at declining battery costs, we assess when we expect EVs to reach price parity. This has already happened in China, where adoption rates far outpace those in the U.S., where such a shift hasn't occurred across many sectors. All of this feeds into our top-down forecasts: we project EVs growing from about 10 million units in 2023 to 74 million by 2030—potentially capturing nearly all auto market share. Then we layer in bottom-up analysis to arrive at differentiated insights.
Tasha Keeney: Regarding autonomous vehicles, we estimate the robotaxi industry could be worth $28 trillion by the end of the century. That’s why, when looking at our Tesla valuation, we believe most of its value will derive from this—it would fundamentally change the business model from one-off EV sales revenue to recurring revenue from Robotaxis.
Of course, we see robotaxis as disruptive because they could be cheaper than any current ride-hailing option and significantly less expensive than owning a personal car in the U.S. today (~70 cents per mile). At scale, robotaxi costs could fall as low as 25 cents per mile.
Initially, however, we set higher price targets. When evaluating companies like Tesla, we require a minimum 15% CAGR over five years in our valuation model. Our initial assessment of Tesla begins qualitatively. As you can see on the slide, we first examine management, people, and culture—our view of the leadership team. Sam, why don’t you start with Tesla?
Sam Korus: Yes, I’d emphasize that these qualitative scores are typically supported by quantitative measures. You’ll see robust debates within the investment team around them.
For people, management, and culture, we evaluate through the lens of disruptive innovation. We prefer a founder-CEO willing to make long-term bets—even if short-term investments aren’t favored by the market or short-term-focused investors.
For Tesla, having Elon Musk—a visionary who’s laid out multiple master plans and is willing to sacrifice near-term profits for massive opportunities like autonomy—is a major positive. While Elon’s visionary leadership is valuable, we also monitor talent retention and hiring ability. Cathie, you were part of the Tesla team discussions reviewing such conversations.
Cathie Wood: Yes, key personnel departures come up frequently. For example, after JB Straubel left (note: Tesla co-founder and longtime CTO), many asked who was truly leading Tesla’s battery and powertrain strategy. His departure raised concerns because he was central to the story. Interestingly, JB left after completing his core mission—the battery and drivetrain chapters were settled. The strategic focus is now shifting toward autonomy. Andrej Karpathy (note: Tesla AI lead) previously worked at Tesla, departed, and has now returned. It’s a tough environment; many are burned out.
We do see people come and go, and we understand that. But Elon is clearly the visionary. He surrounds himself with some of the world’s best engineers who want to tackle extremely hard projects—the hardest on Earth—which is the AI pillar of this strategy. As you’ve heard us say, Tesla is the largest AI project on the planet, attracting top global talent.
Sam Korus: Actually, in annual surveys of graduating students’ dream employers, SpaceX and Tesla consistently rank at the top—that speaks volumes.
Tasha Keeney: We’ve discussed this before—our view is that Musk leading multiple companies actually helps recruitment. As Cathie noted, while it’s a demanding workplace, it’s also highly desirable. That’s why rumors circulate about Andrej Karpathy returning.
Cathie Wood: I’d add another point here. From a risk management perspective, you can see what affects our scores.
I just gave an example—key personnel leaving. JB opened the door, so to speak; his exit came during acceleration of the EV narrative. Another risk area is governance, particularly with Tesla. We evaluate governance for every company. To illustrate, recall when Elon tweeted he was considering taking the company private, saying funding was secured. That angered the SEC. There were lawsuits. When that happened, we learned the SEC was investigating whether funding was truly secured and whether the tweet accurately reflected internal developments. We knew this would distract the company, so we lowered our score accordingly.
So yes, when we perceive risks, we adjust scores. But interestingly, shortly after lowering that score, Tesla unveiled specs for its in-house AI chip. We looked at them and said, “Wow, this is far more advanced and earlier than we expected,” so we raised the “moat” score.
You can see the dynamism in our scoring system. In our 1-to-10 scale, if one category falls below 7, it draws attention. Governance didn’t drop below 7 then, and the moat score improved. But if two scores decline, we seriously consider reducing portfolio exposure. So Tasha?
Tasha Keeney: Thanks, Cathie. Now let’s turn to “moat.” One thing we’ve long considered is Tesla’s vertical integration advantage. We believe they’re years ahead of peers in batteries, AI, and data. As Cathie mentioned, they design their own hardware, chips, and inference chips. Sam, tell us about Tesla’s battery integration.
Sam Korus: Especially when a company is at the frontier of a new revolution, supply chains may not exist. Tesla’s investments in battery chemistry and power inverters differentiate its performance. Today, only one or two competitors match Tesla’s efficiency, but none integrate vertically as quickly.
Tasha Keeney: In autonomy, Tesla accesses billions of miles of driving data—orders of magnitude more than Waymo’s millions. This data trains neural networks, enabling layered autonomy features that we believe will eventually produce a fully self-driving car—where you can literally take your hands off the wheel. That’s the foundation of a robotaxi network.
Another point: the Supercharger network provides Tesla with a powerful moat. It’s now the North American charging standard, and many other automakers have signed on.
Cathie Wood: Consider the risk of emerging disruptive technologies. How many times have we heard, “Oh no, a new battery type—Tesla will be left behind because it’s locked into its current strategy”? We know battery tech is hard, and Tesla is highly likely to adopt new technologies because its entire growth hinges on batteries—so of course it wants to stay ahead. We definitely factor in the risk of new technologies. We talk to Tesla about emerging tech, and each time we’re reassured they deeply understand developments, especially in batteries.
Tasha Keeney: Yes. Execution is another critical qualitative score we assign. Sam, tell us about “production hell”—give us the background.
Sam Korus: I think Tesla’s ups and downs hinge on execution. During Model 3 ramp-up, Tesla was dubbed “production hell.” We vividly remember that period—when deliveries missed by X thousand units, the stock plunged, and people thought, “They missed a few thousand this quarter.” But we asked: Does this matter? Is there a crack in the long-term story? Are they still expanding?
With Tesla, we’ve seen real momentum in execution—they endured tough periods, and now even Toyota says they build one of the world’s best cars. That’s high praise from a company regarded as one of the world’s top manufacturers. With help from China, Tesla built factories faster than anyone else on Earth.
So in EVs, we see sustained improvement in execution. Yet it remains a topic of ongoing debate—ups and downs. Maybe I’ll throw it back to you, Tasha, because one area certain to have starts and stops is autonomy—claims it’ll happen this year. What are we seeing on execution there?
Tasha Keeney: Tesla plans to launch a robotaxi network—an exploration of the next major milestone. It’s not easy—building a fully autonomous car is extremely difficult. We know it’s possible; competitors like Waymo have launched small-scale services. But we believe Tesla could be the first automaker to deploy at scale. Tesla has released the most advanced driver-assist features to date, and we believe they can stack these to create a fully autonomous vehicle.
Returning to Sam’s point about qualitative and quantitative interplay, when we discuss these execution metrics, they inform our modeling of Tesla. We believe that due to cash flows from autonomy and successful production scaling, Tesla could grow from under 2 million vehicles sold annually today to 6 million in our bear case—and up to 14 million in our base case. So again, we incorporate all these metrics when modeling the company.
Sam Korus: I’d also highlight Optimus—one more area of execution, combining autonomy and manufacturing tech. It’s true convergence. Their execution speed has surprised everyone. Just a few years ago, people laughed at someone dancing in a robot suit onstage. Now, Tesla has several robots operating fully autonomously in factories. Seeing this unfold is astonishing.
Cathie Wood: I want to emphasize one aspect of execution, especially related to Tesla. We know Elon champions his vision, often communicating timelines in “Elon Time,” which we all have to adapt to. Why does he do this? Not only to signal suppliers—“Hey, this is my schedule”—getting them ready, but also to motivate employees to focus intensely and achieve goals quickly. Another thing to watch in execution: we look closely at R&D underinvestment or declines.
We look at this two ways: R&D as 1% of sales—where are they spending it? Because sometimes we disagree with the direction. I recall when Toyota shifted from electric to hydrogen fuel cells—we owned the stock and saw R&D funds moving toward hydrogen. We studied how much more expensive hydrogen infrastructure would be, especially versus electric. Based on that, we sold the stock.
Tasha Keeney: Great. We’ve touched on some points, but let’s move to product leadership. In EVs, Tesla offers ample evidence.
Sam Korus: Again, this sparks continuous debate—both qualitative and quantitative. As other automakers roll out products, Tesla’s market share in various regions, especially the U.S., is certainly being challenged. But comparing to Apple’s profitability, we see that as the industry evolved, Apple’s sales declined but profits rose. These are ongoing internal debates. People love discussing them on Twitter. Wherever Tesla’s stock dips, you’ll see these discussions. So it’s something we watch closely.
Cathie Wood: One recent development is GM and Ford exiting EVs because they don’t see a path to profitability. Ford reportedly loses $100,000 per vehicle. Perhaps Tesla’s U.S. share will be higher than we thought. Of course, it will eventually drop from 90% or 95%, just as Apple did in smartphones.
But what signals are we getting from other automakers about their commitment? Their pullback is very telling. The only path to profitability is scale. So from a market share standpoint, this is a fascinating moment for us.
Sam Korus: Then, Tasha, you mentioned autonomy. I know this morning we had a big debate comparing Waymo and Tesla on leadership in autonomous products.
Tasha Keeney: Yes, building on Cathie’s point, when we look at traditional automakers like GM and Ford, they’ve pulled back from autonomy—Ford sold its autonomous unit, GM’s Cruise paused operations (though trying to restart).
So in the U.S. competitive landscape, only Waymo and potentially Tesla remain. Waymo has hundreds of cars on the road; Tesla has millions, which they believe can become autonomous. As I noted, their data advantage gives them greater scale, which we believe translates to AI superiority on the roads—enabling a robotaxi network in many cities, not just the select few where Waymo currently operates.
My final point is theoretical risk. We’ve discussed key aspects here. In valuing theoretical risk, we conducted a Monte Carlo analysis for Tesla (assessing potential risk impacts across various realistic scenarios). We have many variables and adjust upper/lower bounds based on appropriate probabilities. For example, we believe it’s highly probable Tesla launches a robotaxi network within the next few years—at least very likely within the next two to three years.
We also account for timeline delays we’ve discussed. Elon has repeatedly promised a fully autonomous car, but it hasn’t happened. Crossing this threshold is incredibly difficult. So we can’t pinpoint the launch date—July 9 or otherwise. But we use our research to define a plausible timeframe.
Cathie Wood: I’d add regulatory risk. When we began our Tesla journey, we saw regulatory risk as very high. But over the past decade since we started this research, U.S. traffic fatality rates have sharply risen after decades of decline. U.S. auto deaths hit a low of about 30,000 around 2014. They’ve since risen to 45,000. That’s caught regulators’ attention. Now they’re looking at data. Tesla can provide vast safety data.
Tasha, I’ll hand it to her—she’s done extensive research on safety. It’s surprisingly underappreciated, given Volvo built its brand on safety. Some numbers she found are striking.
Tasha Keeney: Yes, again, this is quantifiable in our analysis. Years ago, we estimated autonomous vehicles could be 80 times safer than manual driving in terms of accident rates. We actually have data supporting this. We’ve seen Waymo is already safer than the national average. Looking at Tesla, FSD-enabled Teslas are about five times safer than manually driven ones—based on the latest available data.
Elon has said they expect visibility improvements of four to five times. Compared to the national average, that makes them roughly 14 times safer. So we already see evidence that autonomous vehicles are safer than human-driven ones. We believe that’s exactly what regulators seek before allowing them on public roads.
Another point: Tesla is discussing FSD rollout in China, though nothing decided. If true, that would be a significant step forward. Sam, why don’t you discuss key person risk? It’s another crucial component of theoretical risk.
Sam Korus: Certainly. We’ve discussed Elon’s central role, especially in motivating teams to pursue the autonomy vision. We do consider this, and the importance of his role in launching Robotaxi. Even he’s said there will come a time when it no longer makes sense for him to serve as CEO in a visionary or product-driven capacity. But as we’ve discussed, pushing the autonomy team toward commercial launch remains critical.
Cathie Wood: Tasha, let’s wrap up the valuation discussion and bring our valuation exercise into reality.
Let me set the stage. Our metric is enterprise value to adjusted EBITDA. We adjust EBITDA in two ways:
First, stock-based compensation. We believe strongly in incentivizing employees (including Elon)—aligning them directly with shareholders. Second, we normalize R&D expenses. Our companies typically spend heavily on R&D, and we want them to. We want them to sacrifice short-term profitability because, especially in the AI world, it’s winner-take-all.
Our assumption is that over the next five years, Tesla’s EV business EV/EBITDA multiple will decline—converging toward market multiples. But our analysts believe the combination of revenue growth and margin expansion will outweigh multiple contraction. Tasha, could you elaborate?
Tasha Keeney: Looking at Tesla’s EV business, EBITDA is about $57 today and approaches $60 in the final year of our model. We apply separate valuation multiples to each business line. By 2029, the largest slice of value comes from autonomy, with the EV business trading at 19x EBITDA—down sharply from today’s ~60x, as Cathie mentioned.
For other segments including EVs, we assume lower multiples—around 12–13x. So the blended average is slightly below 19x. Thus, in valuing Tesla’s business, we treat it essentially as a mature business. Yet we believe Tesla will still maintain substantial growth rates in year five of our model. So our five-year valuation is actually a relatively conservative assumption.
Cathie Wood: Again, we set a minimum 15% annualized return over five years. So when I say it drops from 60x to 19x, our revenue growth and margin assumptions must offset that. Everyone knows in our rights-based framework, we’re rigorous in modeling long-term cost declines and scale expansion. So I think we’ll discuss this here—perhaps a condensed version of the Global Report. No, we won’t dwell on fiscal or monetary policy this time. Fiscal policy is gridlocked in Washington for obvious reasons.
Chair Powell, in his latest testimony, seemed to emphasize monetary policy and is now focusing on employment. He reviewed recently published stats and acknowledged inflation continues to ease. This week, Austin Goolsbee—likely the Fed’s biggest dove—said after the CPI report, “Aha, this is what I’ve been waiting for.” So we’ll stick to economic indicators. Last week’s jobs report came in stronger than consensus—weaker than I expected. I thought consensus was 190,000. It was 206,000. But adjusting for another downward revision, net additions were 95,000. Household employment rose by 116,000 after falling 408,000 last month. So household employment is weak, flat or down year-over-year, while nonfarm payrolls are still up slightly over half a percent. Temporary help jobs fell sharply by 49,000—a significant number. I think Chair Powell appropriately noted this.
Of course, another variable the Fed watches is inflation. This week’s CPI came in below expectations—not surprising to us. As I mentioned last time, we’re seeing actual price declines, not just disinflation. Walmart, Costco, Best Buy, McDonald’s, Wendy’s, even Starbucks—all running promotional bundles, which is very unusual. So headline CPI actually dropped 0.1%, bringing the year-over-year rate to 3%—not yet at 2%, but we believe it’s coming. Core rose slightly—yes, 0.1%, slightly below expectations after rising 0.2% last month—now at 3.3% YoY. We again believe this will reach 2%, or close to it. PPI came in hotter than expected.
What does that tell us? It signals margin compression. Many observers feared cost-push inflation—like in the 70s—with rising costs forcing price hikes that consumers reject. We saw some companies, even PepsiCo, announce a 4% sales decline in North America this week—very unusual for a consumer staples company.
Something unusual is happening—maybe pandemic-related, but we think economic factors play a role too. Perhaps it’s half-and-half—who knows. We believe PepsiCo will have to respond with lower prices.
I won’t list all economic stats. Let me say, upon close review, I believe nearly all came in weaker than expected—especially housing and capex. Both carry high multipliers.
Interestingly, one number came in stronger: personal income rose 0.5%, but spending grew only 0.2%. What does that tell us? Consumer saving rates are starting to rise. When does that happen? Typically when people worry about jobs and the economy.
So I’ll show you a chart on this. Let’s jump into the charts. Okay, here you see the issue markets are grappling with.
This is a long-term chart of the 10-year U.S. Treasury yield since the early 1960s. You can see an upward trend from the 1960s to the early 1980s, rising from low-to-mid single digits to over 15%.
Since then, we’ve been in a downtrend. You can see the downtrend appears to have ended—that’s where much debate lies. One reason it rose: the Fed hiked 22 times to fight inflation, feeling behind and opting for aggressive action. That’s one reason long-term yields rose. Without that, the yield curve would have inverted by about 500 basis points (5 percentage points)—a very unusual situation.
Now the question: Have we broken that downtrend? Probably yes, because approaching zero, negative rates aren’t good—they often accompany severe economic distress. We expect the near-term economy to be weaker than most anticipate, possibly due to consumer spending. Long-term, the economy we foresee is priced far below expectations.
In fact, cyclical forces are brewing deep disinflation in the near term—pricing went too far due to supply shocks. Consumer goods companies capitalized on that and will now have to cut prices—this is cyclical. Long-term, deflation has a structural cause: innovation, true disruptive innovation, which is inherently deflationary.
It follows learning curves. We see rising efficiency and productivity, reflected in declining tech costs—creating mass-market opportunities. So we’ll see tech prices fall while unit volumes surge. Nominal GDP could be in the 5% to 10% range. Historically, long-term Treasury yields align with nominal GDP growth. So we believe cyclical forces will push Treasury yields lower in the near term.
Yes, long-term, we believe the long-standing decline in Treasury yields has been broken because we expect substantial unit growth from these new technologies—potentially pushing real GDP growth to surprising levels. In past webinars, we’ve shared that with multiple innovation platforms advancing simultaneously, real GDP growth over the next 10–15 years could exceed the 3% range seen over the prior 125 years. In the early 1900s, with telephone, electricity, and internal combustion engine, GDP growth rose from 0.6% to 3%. Long-term, we believe robotics, energy storage, AI, blockchain, and multi-omic sequencing could lift real GDP growth from 3% into the 6% range.
The next chart covers the cyclical part of the economy. We’re closely watching the metals-to-gold ratio. You can see how closely correlated it’s been since 0.8. When the metals-to-gold price ratio falls, they mirror each other—until recently, when Treasury yields didn’t follow. Metals-to-target price ratio dropped—by 0.8, 0.9 levels—but yields haven’t fallen, and we believe they will.
As I mentioned earlier, cyclical signals from the metals-to-gold ratio haven’t triggered a directional shift. That hasn’t happened. So we believe 10-year Treasury yields will fall. Recall we’re in a long-term downtrend—the real decline started after energy prices peaked at $0.80, oil spiking to the $47 range. Since then, the trend has been down. Covid pushed it to very low levels. Supply shocks flared again, and now it’s trending down. Today’s commodity prices match early 1980s levels. That’s meaningful.
The next chart shows what I described earlier—here finalized—as the yield curve. Measured by the 10-year U.S. Treasury yield relative to the 2-year, you see the 10-year below the 2-year. This typically precedes recessions. Shaded areas on the chart are recessions. When the yield curve inverts, we usually enter recession within 18 months. That hasn’t happened yet, though I believe NBER might retroactively date a recession to late last year, given all the downward revisions in jobs and other indicators.
You can also see the downtrend in the yield curve since the global financial crisis. I think during Covid, you see it steepened—meaning it rose from ~0% to 1% and a half. I thought it would go higher, like during the global financial crisis. Why didn’t it? Every government worldwide, via monetary or fiscal policy, tightened financial conditions aggressively—but the curve didn’t return to the 200–300 bps range it should have. Why not? We see clear deflation in commercial real estate, office space, and increasingly multifamily housing. That’s one source of cyclical deflation.
I mentioned another issue earlier—consumer-facing companies cutting prices. Here we’re inverted—you see we’ve been inverted for a long time. In fact, Chair Volcker fought double-digit inflation in the late 70s/early 80s—longer than anytime since. We haven’t hit double digits, but Fed policy now looks just as tight. That’s why I keep circling back to downside risks and the Fed needing to pivot.
The Fed has four meetings left this year—end of July, September, November, and December after elections. We wouldn’t be surprised by three rate cuts. Deflationary forces are accumulating over the coming months.
On the next page, I want to show adjusted corporate tax rates from GDP accounts. You can see profit margins have risen since the early 90s and now appear to have peaked. We believe margins will fall further—companies will be forced to cut prices to maintain unit volume. So we think margins could fall below 2014 levels.
That said, overall, we believe due to all the new technologies—especially AI and the productivity boom we foresee—the upward trend, or at least high levels, will persist. So margin declines will be more cyclical. But long-term, we expect profitability to remain elevated. Maybe we won’t keep rising. By historical standards, it’s already quite high, but all these new technologies will boost margins.
Next page just shows how low consumer savings rates are historically. You see it spiked to ~32% during Covid—no one was spending. Fiscal stimulus helped. People saved initially, but it’s now fully depleted. By historical standards, savings rates are at the low end. Shaded areas show savings rising during recessions.
We just got another reading on savings—now up to 3.9%. I recall 3.6. As I mentioned, the reason is spending growth lagging income growth. So it’s a cautionary signal on the next chart.
Now to market indicators. This chart from Goldman Sachs measures market concentration. You may have heard of the “Magnificent Seven” tech stocks—now called the “Fab Five” or “Mag Six.” When Tesla underperformed this year, those naming the group dropped it. So Mag Six led us to record market concentration. Many say, “I’m safe with Mag Six,” citing strong cash flows and prime positioning in AI. But we’d say, the more concentrated the market, the higher the risk in these stocks.
When we first saw this chart, I thought, wow—when concentration reaches such highs, I looked at two points: 1973 and 2000, which I lived through. 2000 was the tech/internet peak, followed by a bear market. Such concentration is a bear market precursor. Back to 1973—I wasn’t in markets then, but read about it. When I entered the industry, it was folklore. That was the end of the Nifty Fifty. Markets concentrated in 50 stocks, resulting in a terrible bear market and the worst recession since the Great Depression.
So I look at these and say, if you examine past concentration peaks, they often coincide with bull markets fueled by intense fear of missing out.
Let me illustrate. By 1932, the Depression had begun in 1929. Unemployment hit 25%, not today’s 4.1%. Real GDP fell 30%. Consumer and producer prices deflated—real prices down 25–30%. Companies with large cash buffers generating steady cash flow even in depression dominated, capturing disproportionate capital flows. Then what happened? A bull market emerged.
I believe markets rose over 50–60% in the next three and a half years. The rally broadened dramatically—small-, mid-, and even large-caps outperformed mega-caps. Large-caps had done much of the work and then stagnated. Others, crushed in the first three years of the Depression, performed better. We believe it’s similar now. Of course, this benefits strategies like ours, which overlap little with broad benchmarks, while Mag Six and stocks like ours are disproportionately weighted. All our stocks focus on disruptive innovation. So as rates fall, our long-duration holdings should be primary beneficiaries of the broadening bull market.
As you know, we believe inflation will continue cooling beyond expectations, and consumers are essentially filling the rolling recession that began when the Fed started hiking—housing markets have fallen almost randomly and continue to weaken, with signs of recurrence. We see slowing in housing, commercial real estate, autos, and now broader consumption.
This chart shows how fast mean reversion can occur. You see value stocks outperformed growth for a long time during the tech/internet era. Then suddenly, the bubble burst—in less than a year, value went from underperforming by over 3,000 bps to outperforming by nearly 5,000 bps. As we neared the bubble’s end, many portfolios shifted to internet stocks. Those who did may have lost significant value. Strategies sticking to their style endured huge shifts, mean-reverted, and then outperformed. Interestingly, as the internet bubble burst, we saw reversal again—back to mean reversion.
As you see here, value stocks have underperformed recently, as have long-duration strategies like ours. We believe both will mean-revert as rates fall.
Finally, I’ll show a stock from Mag Six—Apple. You can see, remarkably, Apple’s valuation is now much higher—three times higher, I believe—than when the iPhone launched, when its valuation should have surged. Instead, recently, its cash flows became attractive amid rising rates. I’ve never seen the market pay for cash flow like this, but it is—because Apple’s revenue growth is zero. Currently, Apple’s revenue growth is very low, near zero over recent years.
Now, through collaboration with OpenAI—or at least opening up to OpenAI and other foundational LLMs—it’s gaining some momentum. We do believe in a refresh cycle. AI will add nice features and functionality. But we believe this multiple rerating—driven purely by cash—will fade in the coming years, especially as rates fall, as we expect. So Mag Six’s valuation boost in recent years was due to cash. It tells us there’s significant market anxiety—capital is disproportionately reallocating to safe stocks with high cash balances. We believe as rates fall in the coming years, we’ll see mean reversion again.
Now, through collaboration with OpenAI—or at least opening up to OpenAI and other foundational LLMs—it’s gaining some momentum. We do believe in a refresh cycle. AI will add nice features and functionality. But we believe this multiple rerating—driven purely by cash—will fade in the coming years, especially as rates fall, as we expect.
So Mag Six’s valuation boost in recent years was due to cash. It tells us there’s significant market anxiety—capital is disproportionately reallocating to safe stocks with high cash balances. We believe as rates fall in the coming years, we’ll see mean reversion again.
Join TechFlow official community to stay tuned
Telegram:https://t.me/TechFlowDaily
X (Twitter):https://x.com/TechFlowPost
X (Twitter) EN:https://x.com/BlockFlow_News