
Rollup token overvalued or undervalued? We conducted a revenue and cost structure analysis of Rollup
TechFlow Selected TechFlow Selected
Rollup token overvalued or undervalued? We conducted a revenue and cost structure analysis of Rollup
The diversity of business models and the adaptability of different rollups under varying market conditions reveal deep strategic considerations in the Ethereum L2 rollup ecosystem.
 Navigating Web3 tides with focused insights
By IOSG Ventures
Background
The Ethereum Rollup L2 ecosystem is now taking initial shape, with total daily TVL exceeding $37 billion—more than three times that of Solana and over one-fifth of Ethereum's. From a user perspective, major L2s recently averaged around 158k daily active users, surpassing Solana’s ~100k.
However, the short-term price performance of Rollup tokens has fallen short of expectations. In terms of market cap, among mainstream Rollups, Arbitrum stands at $7.8 billion, Optimism at $7.3 billion, Starknet at $6.9 billion, while zkSync (just post-airdrop) has an FDV of $3.5 billion—far below Solana’s $74 billion FDV. The recent launch of zkSync did not meet market expectations due to weak market performance.
From a revenue standpoint, Ethereum generated $2 billion in income in 2023. In the same year, top-performing Arbitrum and Op Mainnet earned $63 million and $37 million respectively—still significantly behind Ethereum. Newly prominent entrants Base and zkSync generated $50 million and $23 million respectively in the first half of 2024, whereas Ethereum produced $1.39 billion during the same period. The gap remains wide. Rollups have yet to match Ethereum’s revenue scale.
Low activity levels on some Rollups are certainly part of the issue—a challenge shared across most public blockchains. But we aim to understand how well Rollups are fulfilling their mission as mass adoption infrastructure, and whether their current low activity masks underlying undervaluation.
Ultimately, this traces back to the original rationale for Rollups: Ethereum’s growing congestion and transaction fees reaching unacceptable levels. Thus, Rollups were inherently designed with the goal of reducing transaction costs. Beyond the widely recognized benefit of inheriting Ethereum L1-level security, Rollups also introduce a revolutionary cost structure—“the more users, the cheaper the Rollup.”
If this promise can be fully realized, we believe Rollups possess irreplaceable value. A more rational cost structure would also enhance resilience against market fluctuations. Sustained investment fueled by healthy cash flow becomes a source of competitiveness, and protocols with superior profit margins naturally command higher valuations and long-term advantages.
This article offers a brief analysis of current Rollup economic structures and explores future possibilities.
1. Rollup Business Model
1.1 Overview
Rollup protocols use Sequencers as financial hubs, charging users fees for transactions executed on the Rollup to cover both L1 and L2 operational costs and generate additional profits.
On the revenue side, fees collected from users include:
-
Base fees (including congestion fees)
-
Priority fees
-
L1-related cost fees
Potential fees that the protocol may capture through its own policy decisions include:
-
MEV fees
On the cost side, expenses consist primarily of L1 costs—with smaller contributions from L2 execution costs—including:
-
Data Availability (DA) costs
-
Verification costs
-
Communication costs
What distinguishes Rollups from other L2 solutions is their cost structure. DA costs—the largest component—are treated as variable costs dependent on data volume, while verification and communication costs are largely seen as fixed costs necessary to maintain Rollup operations.
From a business model perspective, we aim to clarify the marginal cost of Rollups—how much the incremental cost of an additional transaction is less than the average per-transaction cost—to assess the extent to which “more users make Rollups cheaper” holds true.
The reason lies in Rollups’ ability to batch process data, compress information, and aggregate proofs—resulting in high efficiency and lower marginal costs compared to other chains. In theory, fixed costs can be effectively amortized across each transaction, becoming negligible at sufficiently high volumes—though this requires validation.
1.2 Rollup Revenue
1.2.1 Transaction Fee Revenue
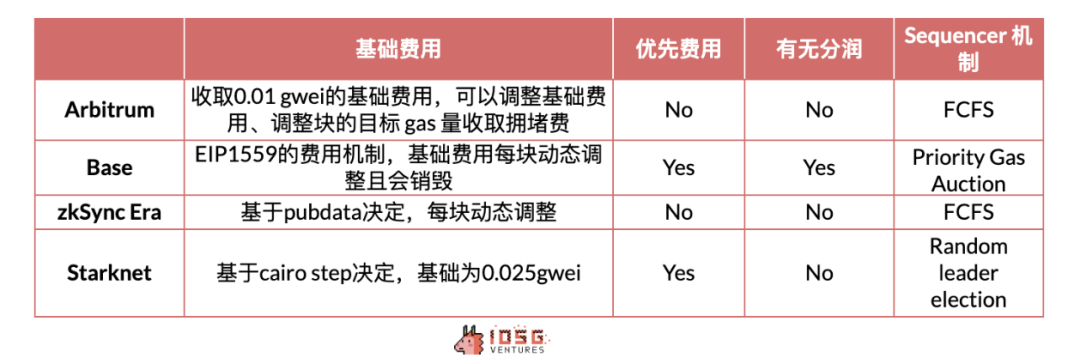
Rollups primarily earn revenue from transaction fees (gas), which serve to cover operational costs and generate profit. This profit helps hedge against risks associated with long-term fluctuations in L1 gas prices. Some L2s charge priority fees to allow urgent transactions to jump the queue.
Arbitrum and zkSync follow a First-Come-First-Served (FCFS) model, processing transactions in arrival order without supporting "jumping the line." OP Stack handles this differently, allowing users to pay priority fees to expedite transactions.
Source: IOSG Ventures
For users, L2 fees on Rollups are determined by a base minimum fee during periods of low chain activity. During busy times, congestion fees are applied based on each Rollup’s assessment of network load—often increasing exponentially.
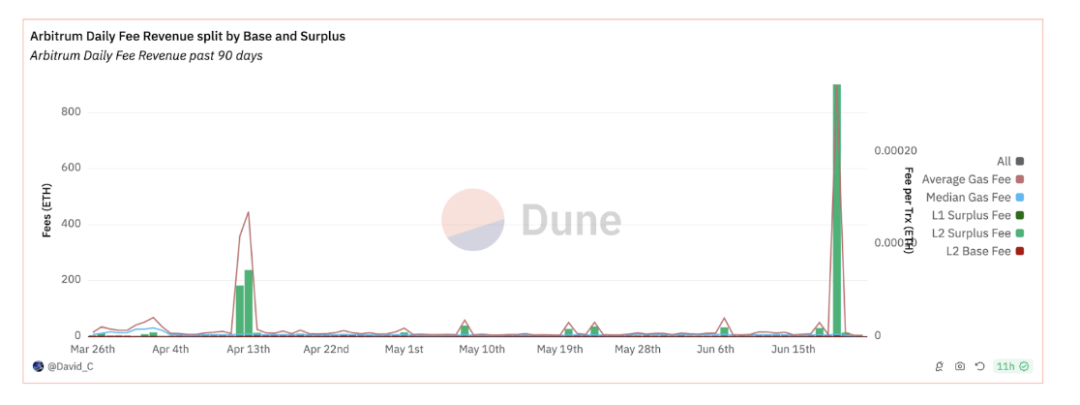
Given that L2 overhead is minimal (limited to off-chain engineering and maintenance), and that execution fee collection is highly discretionary, nearly all user payments for L2 fees become protocol profit. With centralized Sequencer operation, Rollups control parameters such as base fee floors, congestion pricing, and priority fees—making L2 execution fees essentially a “parameter game.” As long as the ecosystem remains vibrant and pricing doesn’t alienate users, these fees can be freely tuned.
Source: David_c @Dune Analytic
1.2.2 MEV Revenue
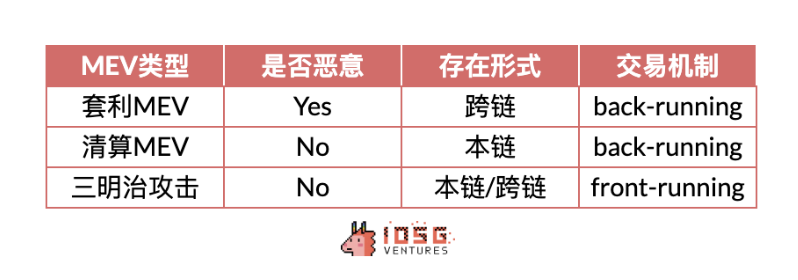
MEV transactions fall into two categories: malicious and non-malicious. Malicious MEV includes front-running attacks like sandwich trades, where attackers exploit user transactions to extract value—for example, inserting trades before a user’s swap to force them into buying at a higher price or selling lower, commonly known as being “sandwiched.”
Non-malicious MEV includes back-running activities such as arbitrage and liquidations. Arbitrage helps balance prices across exchanges, improving market efficiency; liquidations remove bad leverage and reduce systemic risk, making them beneficial forms of MEV.
Source: IOSG Ventures
Unlike Ethereum, Rollups do not expose a public mempool. Only the Sequencer can view pending transactions before finality, giving it exclusive access to L2 MEV opportunities. Given that most L2s currently operate with centralized sequencers, malicious MEV is unlikely to occur. Therefore, current MEV revenue should focus on arbitrage and liquidation types.
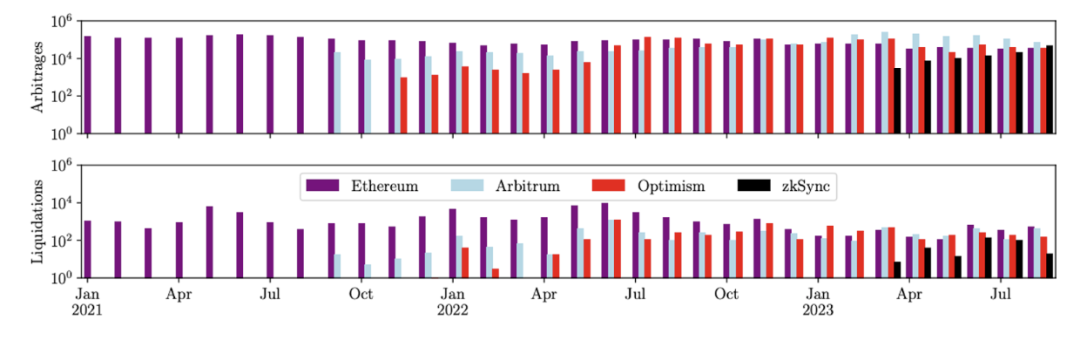
According to research by Christof Ferreira Torres et al., who replayed transactions on Rollups, Arbitrum, Optimism, and zkSync exhibit on-chain non-malicious MEV activity. These three chains have collectively generated $580 million in MEV value—an amount significant enough to be considered a meaningful revenue stream.
Source: Rolling in the Shadows: Analyzing the Extraction of MEV Across Layer-2 Rollup
1.2.3 L1-Related Cost Fees
These fees are charged by Rollups to cover L1-related costs, whose components will be detailed later. Different Rollups employ varying methods. Beyond predicting L1 gas costs to cover data submission expenses, Rollups often add buffer fees to prepare for future gas volatility—effectively representing another source of protocol revenue. For instance, Arbitrum adds a “Dynamic” fee, while OP Stack applies a “Dynamic Overhead” multiplier. Prior to EIP-4844, these buffers amounted to roughly 1/10 of DA costs.
1.2.4 Revenue Sharing
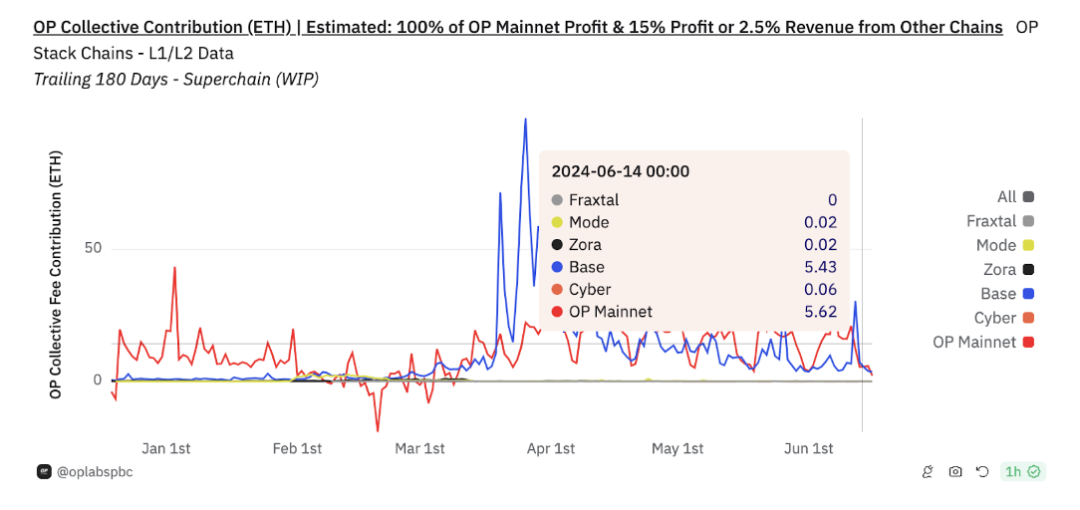
Base is somewhat unique due to its use of the OP Stack, involving a revenue-sharing mechanism. Base commits to contributing either 2.5% of total revenue or 15% of profits after deducting L1 data submission costs—whichever is higher—to the OP Stack. In return, Base participates in OP Stack and Superchain governance and receives up to 2.75% of the total OP token supply. Based on recent data, Base contributes approximately 5 ETH per day to Superchain.
We observe that Base provides a substantial portion of Optimism’s income. Beyond direct cash inflows, this healthy network effect enhances the attractiveness of the OP Stack ecosystem to users and markets. Despite Arbitrum outperforming Base and Optimism in certain metrics like TVL or stablecoin market cap, it now lags behind in transaction volume and revenue. This is reflected in their P/S ratios: when including Base’s contribution, $OP’s PS ratio exceeds $ARB’s by 16%, highlighting the added value brought by the ecosystem to $OP.
Source: OP Lab
1.3 Rollup Costs
1.3.1 Ethereum L1 Data Costs
While specific cost structures vary between chains, they broadly fall into three categories: communication costs, DA costs, and ZK-specific verification costs.
-
Communication costs: include state updates and cross-chain interactions between L1 and L2.
-
DA costs: involve publishing compressed transaction data, state roots, and ZK proofs to the DA layer.
Before EIP-4844, DA costs dominated L1 expenses—accounting for over 95% for Arbitrum and Base, over 75% for zkSync, and over 80% for Starknet.
After EIP-4844, DA costs dropped dramatically, though the degree varied across L2s—generally seeing reductions of 50% to 99%.
1.3.2 Verification Costs
Primarily applicable to ZK Rollups, these cover the computational expense of verifying transaction validity using zero-knowledge proofs.
1.3.3 Other Costs
Includes off-chain engineering and operational expenses. Given current Rollup architectures, node operating costs are comparable to cloud server costs and remain relatively low (similar to enterprise AWS usage).
1.4 Profit Comparison Between L2s and Alternative L1s
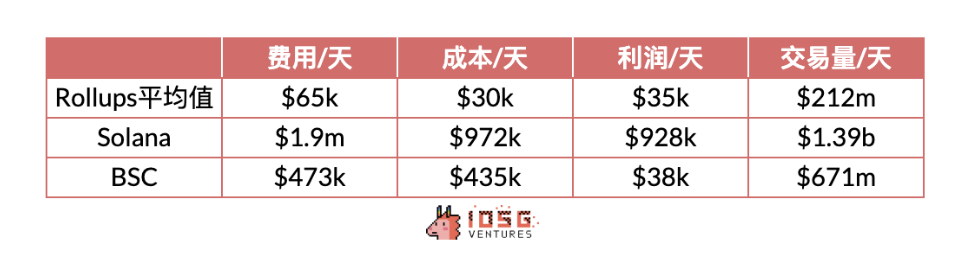
At this point, we have a general understanding of the overall revenue-expenditure structure of Rollup L2s, enabling comparison with alternative L1s. Here, we use weekly average data from Arbitrum, Base, zkSync, and Starknet as representative Rollups.
Source: Dune Analytic, Growthepie
It’s evident that Rollups' overall profit margins are close to Solana’s and clearly superior to BSC’s, demonstrating strong profitability and cost management inherent in the Rollup business model.
2. Rollup Cross-Comparison
2.1 Overview
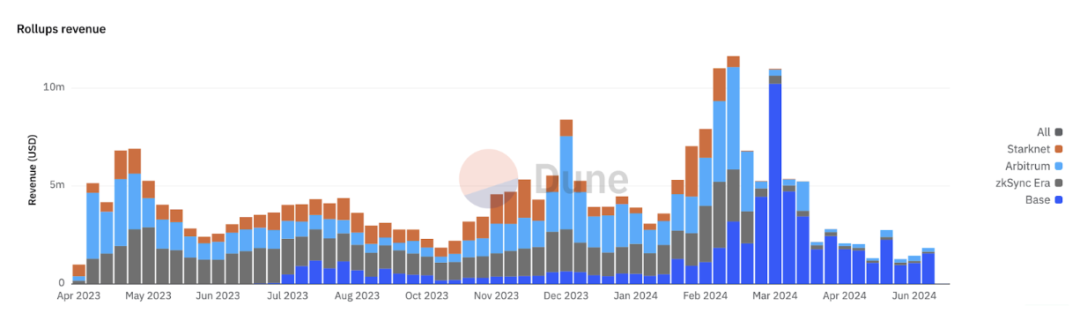
Fundamental performance varies significantly across different stages of Rollup development. For instance, when token distribution is anticipated, Rollups often experience sharp increases in transaction volume, leading to corresponding spikes in fee income and expenditure.
Source: IOSG Ventures
Most Rollups remain in early stages, where absolute profitability matters less than maintaining breakeven operations for sustainable growth. This aligns with Starknet’s stated philosophy of not charging extra fees beyond cost recovery.
Yet since March, Starknet has operated at a sustained loss. While its on-chain activity is indeed weak, what exactly causes this deficit—and will it persist?
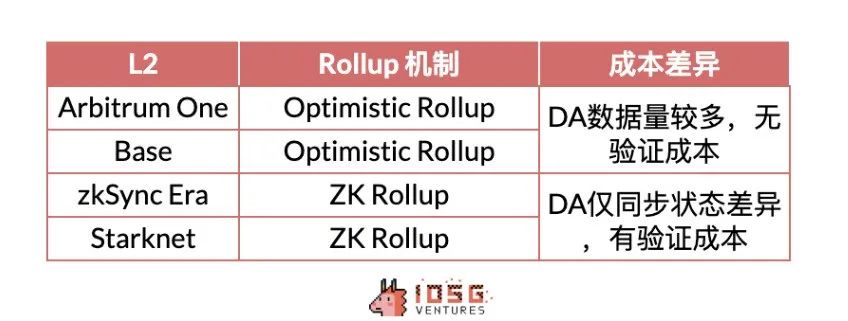
Let’s delve deeper. In reality, Rollup revenue models are relatively similar, but differences in marginal cost structures stem from variations in Rollup mechanisms, data compression techniques, and computation designs.
Source: IOSG Ventures
We aim to compare Rollup costs to better understand the distinct characteristics of different Rollups.
2.2 Cost Structures of Different L2 Types
ZK Rollup
ZK Rollups differ mainly in verification costs, which act as fixed costs difficult to recover via fee allocation—often the root cause of deficits.
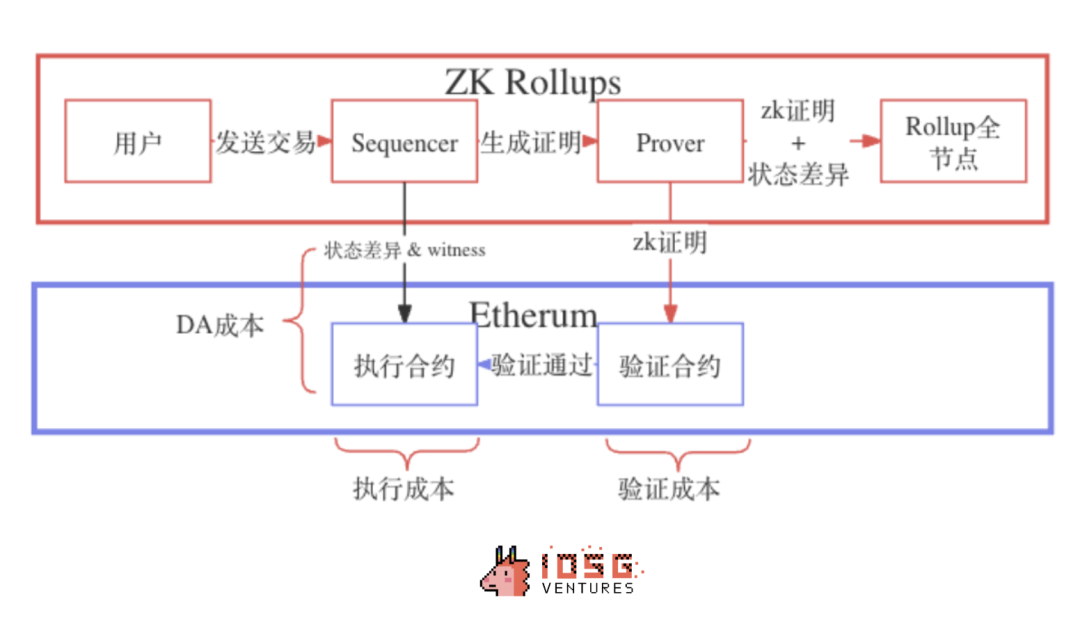
Source: David Barreto @Starknet, Quarkslab, Eli Barabieri, IOSG Ventures
This article focuses on two relatively mature, high-volume ZK Rollups.
Starknet
Starknet uses its shared proving service SHARP. After transaction sequencing, confirmation, and block production, batches are sent to SHARP to generate proofs, which are then submitted to an L1 contract for verification before being passed to the Core contract.
In Starknet, fixed costs for verification and DA arise from blocks and batches.

Source: Starknet community - Starknet Costs and Fees
Variable costs in Starknet increase with transaction count, primarily consisting of DA costs. Theoretically, these shouldn’t incur extra spending. In fact, the opposite occurs: Starknet charges per write operation, but its DA cost depends only on the number of updated memory units—not update frequency. Hence, Starknet previously overcharged for DA.
Timing differences between fee collection and cost payment may lead to temporary losses or gains.
Thus, as long as transactions continue, Starknet must keep producing blocks and paying fixed costs per block and batch. More transactions mean higher variable costs. Fixed costs do not significantly raise marginal costs.

Source: Eli Barabieri - Starknet User Operation Compression
Due to computational limits per block (Cairo Steps), Starknet calculates gas fees based on both computation resources and data size, covering fixed and variable costs separately. Since block/batch costs cannot be easily allocated per transaction, but blocks close once a certain resource threshold is reached (triggering fixed costs), part of the fixed cost can be recovered via resource-based charging.
However, due to time-based block closure, if transaction volume is insufficient (low computation per block), resource usage poorly reflects actual cost distribution, leaving fixed costs under-recovered. Additionally, “computation limits” are affected by network upgrades—Sharp losses shortly after EIP-4844 illustrate this, easing only after adjusting fee parameters.
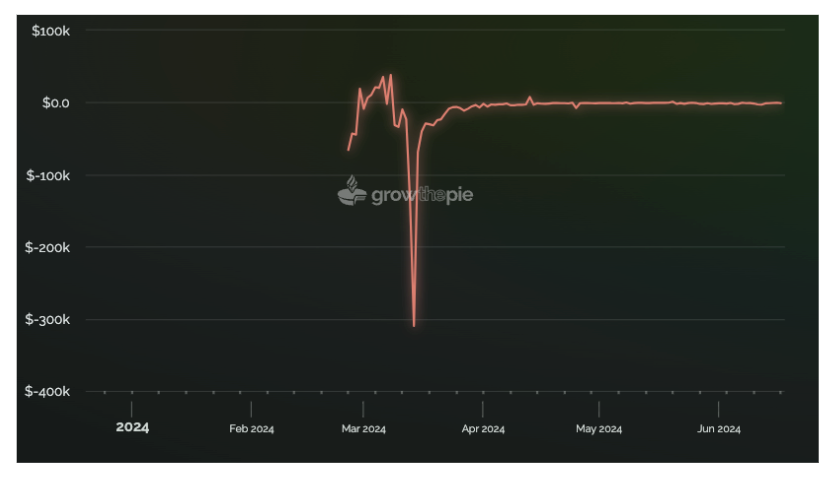
Source: Growthepie
Starknet’s pricing model fails to adequately cover fixed costs per transaction, resulting in negative revenue when mainnet upgrades coincide with extremely low transaction volumes.
zkSync (zkSync Era)
After the Boojum upgrade, zkSync Era shifted from block-level to batch-level verification and stores state diffs, effectively lowering both verification and DA costs. The process resembles Starknet: the Sequencer submits batches to the Executor contract (with state diff and DA commitment), proof nodes submit ZK proofs, and batches execute upon validation (once every 45 batches). Unlike Starknet, which incurs verification costs per block and batch, zkSync only pays per batch.
Cost Comparison: zkSync vs. Starknet
Starknet’s batch sizes are far larger than those of zkSync Era. zkSync Era caps each batch at 750–1,000 transactions, while Starknet imposes no such limit.
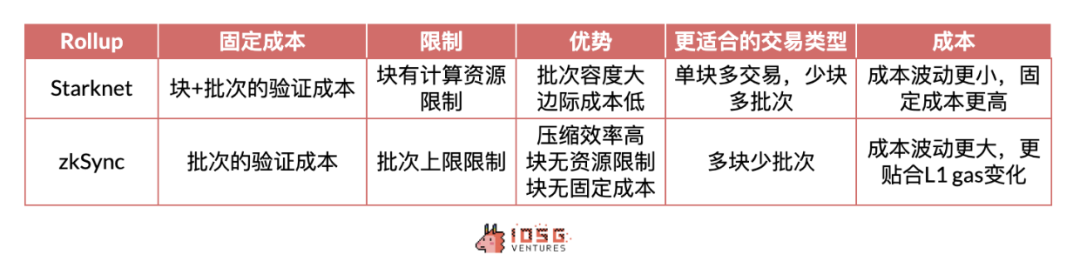
Source: IOSG Ventures
Thus, Starknet scales better, handling more transactions per block thanks to computational limits—ideal for high-frequency trading and large volumes of simple operations—but suffers from high fixed costs at low volumes. zkSync’s efficient compression and flexible block resources give it an edge in fluctuating L1 gas prices or low on-chain activity, albeit with limitations on block speed.
For users, Starknet’s pricing is more predictable and less tied to L1, with stronger economies of scale. zkSync is more efficient but more sensitive to L1 fluctuations.
For protocols, Starknet’s high fixed costs lead to greater losses during low-activity phases, making zkSync more suitable in such scenarios. During high-activity phases, Starknet excels at managing high-volume, low-cost operations, while zkSync’s current design may slightly lag under heavy load.
2.3 Optimistic Rollup
Optimistic Rollups have simpler cost structures. Without verification costs, users only pay for L2 computation and L1 DA costs. State root publication, linked to block creation, behaves more like a fixed cost, while uploading compressed transactions represents a predictable, allocatable variable cost.
Compared to ZK Rollups, Optimistic Rollups have lower fixed costs, making them better suited for moderate transaction volumes. However, requiring signatures per transaction leads to higher DA (variable) costs, diminishing marginal cost advantages at massive scale.
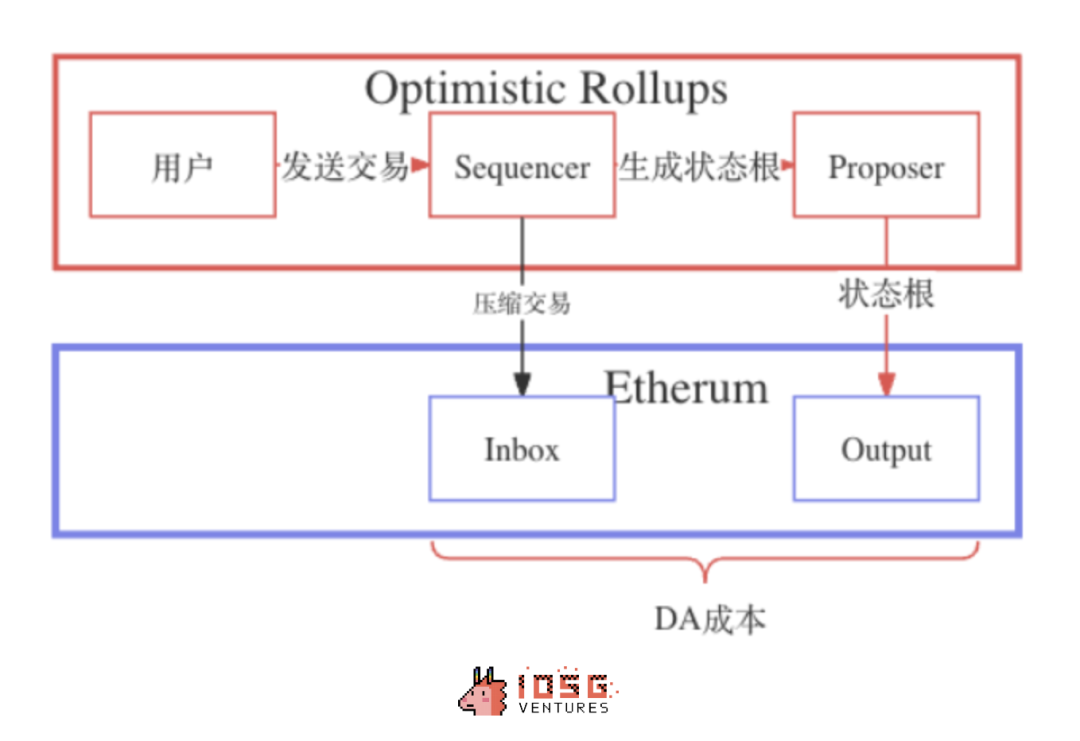
Source: IOSG Ventures
At current adoption levels, ZK Rollups’ fixed costs may result in higher minimum fees than OP Rollups, disadvantaging users. Yet ZK’s strength lies in scalability:
High transaction volume and proof aggregation spread verification costs, eventually saving more on L1 marginal costs than Optimistic Rollups. Support for Validiums/Volitions, state-diff-only DA, faster withdrawals, etc., better suits large-scale economic demands and RaaS ecosystems.
2.3 Data Comparison
Revenue
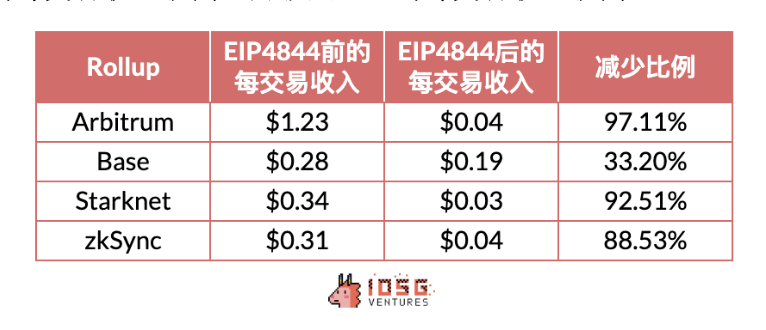
Looking at gas fees charged to users, Base shows higher revenue, Starknet lower, with Arbitrum and zkSync comparable. Differences in transaction volume explain both horizontal and vertical gaps. Calculating revenue per transaction reveals that pre-EIP-4844, Arbitrum had higher per-transaction revenue; post-upgrade, Base leads.
Source: IOSG Ventures
Costs
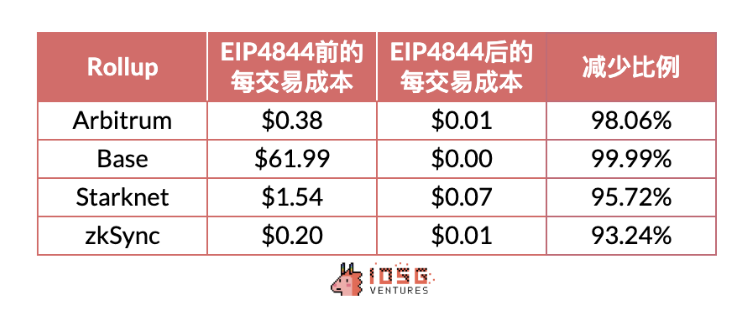
Per-transaction cost analysis shows that before EIP-4844, Base suffered from excessively high DA costs, placing it in a high marginal cost regime where economies of scale weren’t visible. Post-EIP-4844, with DA costs plummeting, Base’s per-transaction cost dropped sharply, now being the lowest among all Rollups. Comparing OP and ZK Rollups, OP Rollups benefited more from the upgrade. StarkNet’s actual L1 DA cost decreased by ~4–10x, slightly less than the order-of-magnitude improvement seen in OP Rollups. This aligns with theory: ZK Rollups gained less from EIP-4844 than OP Rollups. ZK Rollup post-upgrade fee trends reflect the impact of fixed costs.
Source: IOSG Ventures
Profit
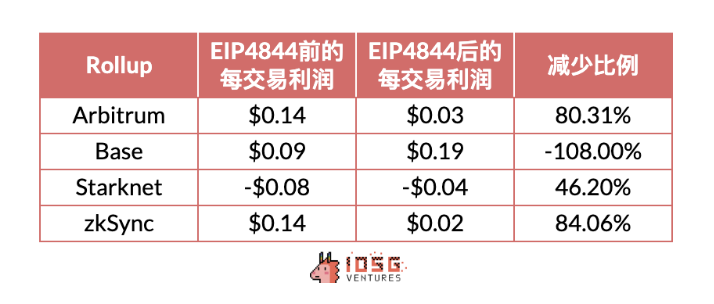
Data indicates Base enjoys the highest gross margin due to scale effects, far exceeding Arbitrum despite both being Optimistic Rollups. Among ZK Rollups, Starknet’s low transaction volume prevents coverage of fixed costs, resulting in negative gross margins. zkSync maintains positive margins but is still constrained by fixed costs, trailing OP Rollups. The EIP-4844 upgrade did not directly improve profit margins—the primary beneficiaries were users, whose costs dropped significantly.
Source: IOSG Ventures
3. Conclusion
3.1 Cost Side
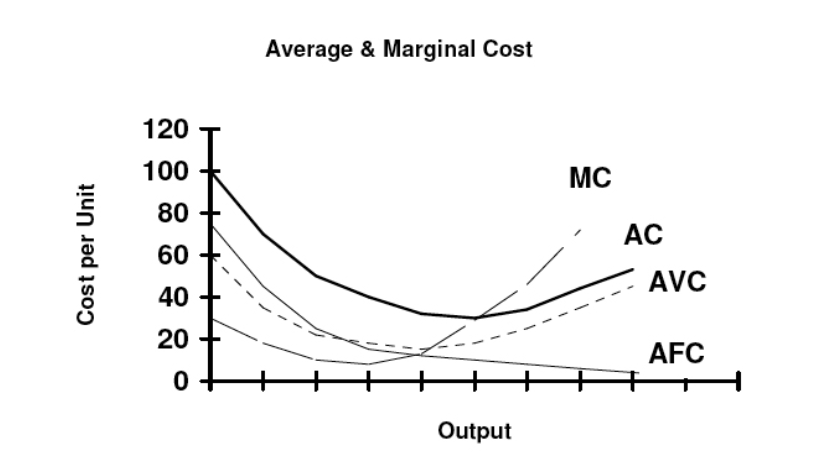
Currently, most Rollups remain in the early phase of their marginal cost curve, where increasing transaction volume reduces marginal costs and significantly lowers average fixed costs. However, as Ethereum L1 or broader L2 ecosystems grow, network capacity constraints may push average transaction costs upward, causing marginal costs to rise gradually (as seen in Base’s performance from March to May)—a long-term challenge Rollups cannot ignore. While monitoring short-term cost shifts due to adoption, we must also evaluate Rollups’ efforts toward optimizing long-term cost curves.
Source: Wikipedia - Cost curve
In the near term, minimizing marginal costs remains the best way for Rollups to build defensibility, with adaptive adjustments to income and cost models offering promising solutions.
3.2 Revenue Side
To maintain long-term competitiveness, protocols may avoid charging users extra fees—or even subsidize them—to keep user costs low and stable, as seen in Starknet’s current approach. Priority fees can boost revenue, but only if the chain maintains sufficient activity.
Post-EIP-4844, some Rollups saw sharp revenue declines (e.g., Arbitrum), as a key profit source—the implicit income from DA data fees—was largely eliminated. Rollup revenue models are becoming more homogeneous, relying increasingly on L2 fee extraction. As volume grows, priority and congestion fees will become crucial revenue drivers. On the proactive side, MEV extraction via Sequencers will also emerge as a key future revenue stream for Rollups.
Overall, Rollup business models do offer economies of scale, especially ZK Rollups. Current market conditions aren’t ideal for showcasing these advantages—they require moments like Base’s surge from March to May. The diversity of business models and adaptability of different Rollups across market conditions reveal deep strategic thinking within the Ethereum L2 Rollup ecosystem.
Join TechFlow official community to stay tuned
Telegram:https://t.me/TechFlowDaily
X (Twitter):https://x.com/TechFlowPost
X (Twitter) EN:https://x.com/BlockFlow_News
 IOSG Ventures