What was the most profitable crypto sector in the first half of 2024?
TechFlow Selected TechFlow Selected
What was the most profitable crypto sector in the first half of 2024?
Meme coins led the cryptocurrency market in the first half of 2024, delivering the highest returns.
 Navigating Web3 tides with focused insights
Author: Viee, Core Contributor of Biteye
Editor: Crush, Core Contributor of Biteye
The first half of the year is almost over. After BTC broke through its previous bull market high and reached $70,000, it hasn't delivered any more exciting surges.
Market movements have been volatile over recent months, and the resolution to "earn well" at the beginning of the year has begun to waver. That said, the main bullish wave has certainly not arrived yet—there will still be times when opportunities are everywhere. Don’t rush.
This moment is ideal for reflection and review. This article presents a statistical comparison of returns across various crypto sectors from 2024 to date. We’re no longer in an era of “picking up money”—so which sector is the most profitable? Read on to find out.
01 How Have Different Crypto Sectors Performed Year-to-Date?
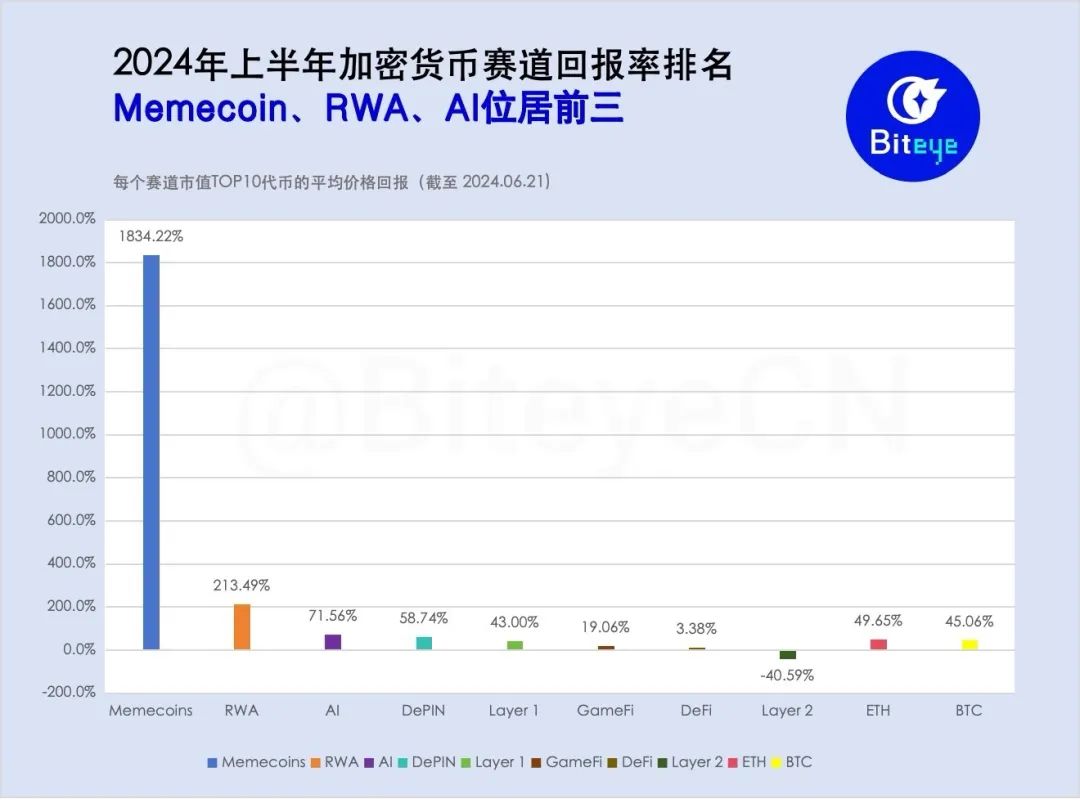
Ranked by the average YTD (January 1, 2024 – June 21, 2024) price return of the top 10 tokens in each sector, with data sourced from CoinGecko. The performance of cryptocurrency sectors in the first half of 2024 is shown below.
Meme Coins Emerge as the Most Profitable Sector
Over the past few months, the saying “value investing leads nowhere; go all-in on MEME to live in a palace” has gradually become one of the core mantras of this bull cycle.
Statistics confirm that meme coins have been unquestionably the most profitable sector so far in 2024, achieving the highest average return of 2,405.1%. As of June 19, three of the top 10 meme coins by market cap were newly launched between March and April: Brett (BRETT), BOOK OF MEME (BOME), and DOG•GO•TO•THE•MOON (DOG).
Among them, BRETT achieved the highest return, increasing 14,353.54% from its launch price. dogwifhat (WIF) surged 933.93% YTD, triggering a full-blown meme coin frenzy.
Notably, meme coins’ profitability is 8.6 times that of the second most profitable sector, RWA, and a staggering 542.5 times that of the lowest-performing DeFi sector.
(Note: The Layer 2 sector, ranked last, had negative returns and was excluded from multiplier comparisons.)
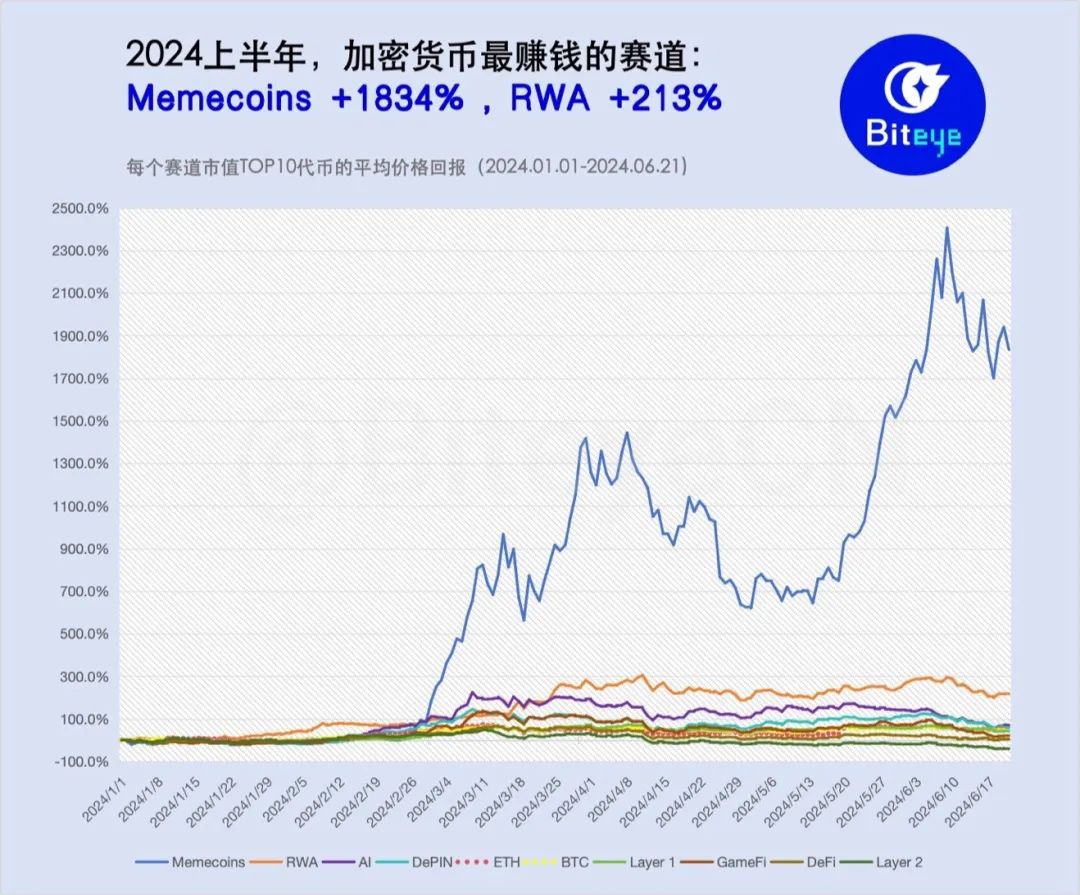
The Second Most Profitable Sector, RWA, Achieved a YTD Return of 213.5%
RWA (Real World Assets) has drawn significant attention recently, with major institutions like BlackRock actively investing in the space.
As a result, RWA briefly became the top-performing sector in February, leading in returns before being overtaken by meme coins and AI. It regained momentum by late March, surpassing AI narratives again, and performed well in early June.
Among large-cap RWA tokens, MANTRA (OM) and Ondo (ONDO) posted the highest gains, rising 1,123.8% and 451.12% YTD respectively. XDC Network (XDC) performed the worst, dropping 44.38%. Beyond established DeFi projects, most RWA initiatives remain early-stage—worth close monitoring.
AI Sector Follows Closely with a 71.6% Return
By the end of 2023, the AI sector had already featured prominently in annual outlooks from major investment firms. As Messari predicted in its 2024 investment forecast, AI has become the new darling of the tech world. True to expectations, the AI sector has delivered an average YTD return of 71.6%, ranking third.
Arkham (ARKM) led the pack with a 215.50% gain, followed by AIOZ Network (AIOZ) at 192.19%. High-profile tokens Render (RNDR) and Fetch.ai (FET) returned 57.47% and 116.00% respectively—solid performances.
DePIN and Layer 1 Achieve Steady Growth
DePIN’s returns were largely negative in the first half of Q1 but turned positive from March onward, reaching a YTD return of 58.7%.
Among large-cap DePIN tokens, JasmyCoin (JASMY) performed best with a 323.42% gain, followed by Arweave (AR) and Livepeer (LPT) at 174.07% and 116.06% YTD respectively.
In contrast, Helium (HNT) underperformed significantly, the only large-cap DePIN token down over 50%, with a return of -50.94%.
DePIN remains one of the sectors heavily backed by capital in this bull market. If DeFi’s total market cap grows tenfold and DePIN reaches half of DeFi’s market cap, DePIN could hit $500 billion—representing at least 20x growth potential.
The Layer 1 (L1) sector achieved a YTD return of 43.0%. Although Solana (SOL), the blockchain hosting many high-potential memes, attracted widespread attention with a 22.91% YTD gain, this is notably lower than its mid-March peak return of 85.05%.
The best-performing large-cap L1 cryptocurrencies were actually Toncoin (TON) and Binance Coin (BNB), rising 204.72% and 86.10% respectively.
In comparison, Bitcoin (BTC) rose 45.06% from年初 despite hitting new highs, while Ethereum (ETH), despite strong ETF approval expectations, gained only 49.65% YTD—roughly on par with BTC.
GameFi, DeFi, and Layer 2 Lag Behind
The GameFi sector returned 19.1%, among the least rotated sectors since年初. Despite substantial funding, no breakout hits have emerged.
Top performers among large-cap GameFi tokens include FLOKI (FLOKI) at +362.79%, Ronin (RON) at +21.16%, and Echelon Prime (PRIME) at +5.27% YTD. All other large-cap tokens posted negative returns, including GALA (GALA) at -13.43% and Immutable (IMX) at -32.02%.
The DeFi sector performed decently in Q1, boosted by Uniswap’s (UNI) fee switch proposal in late February, but showed signs of weakness in Q2, with YTD returns falling to just 3.4%. Among large-cap DeFi tokens, Maker (MKR) stood out with a 49.88% YTD gain.
Layer 2 (L2) was the worst-performing sector, returning -40.59%—nearly halved. Among large-cap L2 tokens, AEVO (AEVO) and Starknet (STRK) fared worst, with returns of -85.40% and -63.16% respectively.
Mainstream Ethereum L2s also underperformed: Optimism (OP) returned -54.64%, Arbitrum (ARB) -53.71%. Notably, Mantle (MNT) stood out, posting a YTD return of 26.09%.
02 Methodology
This study analyzes the performance of major cryptocurrency sectors from January 1 to June 21, 2024, using data from CoinGecko. Returns are calculated based on the average daily price change relative to the starting price at the beginning of the period. For tokens launched during the quarter, their first-day price is used as the baseline.
Representative tokens in each sector (the top 10 by market cap) were selected based on market cap rankings on the final day of the quarter.
To better serve the research objective, niche categories such as chain-specific subsectors, sectors with few large-cap tokens, or those highly overlapping with others were excluded.
Join TechFlow official community to stay tuned
Telegram:https://t.me/TechFlowDaily
X (Twitter):https://x.com/TechFlowPost
X (Twitter) EN:https://x.com/BlockFlow_News
 @BiteyeCN