

Crypto Market Insights for May: Increasing Impact of Policy Factors, Buying Pressure Builds as Market Seeks Breakout Point
TechFlow Selected TechFlow Selected
Crypto Market Insights for May: Increasing Impact of Policy Factors, Buying Pressure Builds as Market Seeks Breakout Point
Everything seems accidental, yet appears to be inevitable.
Author: 0xWeilan, EMC Labs
*The market, projects, cryptocurrencies, and other information, opinions, and judgments mentioned in this report are for reference only and do not constitute any investment advice.
After 15 years of development, the BTC and crypto industry has transitioned from technological research and niche-market validation to a phase of broad adoption. From obscure and notorious beginnings to sudden storms and unexpected breakthroughs, its path and form have often been surprising.
Everything seems accidental, yet appears inevitable.
Following the approval of BTC ETFs in January, the U.S. SEC unexpectedly announced on May 23 the approval of eight ETH ETFs—contrary to market expectations that ETH ETF approvals would be delayed until the second half of the year. This surprise利好 drove BTC and ETH, both in weak positions, to rebound by over 11.4% and 24.83%, respectively.
Throughout the long journey toward mass adoption of BTC and cryptocurrency, shifts within traditional finance and regulatory bodies have become powerful catalysts for industry and market growth. In the crypto space, the Democratic Party’s "unexpected" reversal reflects not only the growing influence of America’s 50 million crypto holders but also the policy impact brought by traditional financial institutions like BlackRock entering the sector en masse.
U.S. Policy
On the same day, May 23, the U.S. House of Representatives passed the Financial Innovation and Technology for the 21st Century Act (FIT21) with strong bipartisan support. In the long term, FIT21’s passage will have a far greater impact on the crypto industry than the approvals of BTC and ETH ETFs.
For the crypto industry, FIT21 brings profound institutional validation and protection. The bill provides a clear pathway for blockchain projects to launch safely and efficiently in the U.S.; clarifies the regulatory boundaries between the Securities and Exchange Commission (SEC) and the Commodity Futures Trading Commission (CFTC) based on whether an asset is classified as a security or commodity; and establishes targeted regulation for cryptocurrency exchanges, including trading rules designed to protect American investors.
After passing the House, FIT21 will now go to the Senate for review. If approved, it will then proceed to the President for final consideration. While the enactment of FIT21 will take time, its symbolic breakthrough is already evident—signaling institutional recognition and encouragement for the long-term development of the crypto industry in the U.S., confirming that crypto, having overcome legitimacy concerns, has become one of the nation’s priority industries.
Macroeconomic & Finance
At the beginning of May, the U.S. released April economic data—unemployment and non-farm payroll figures came in significantly below expectations, boosting rate-cut anticipation, weakening the U.S. dollar index, and fueling a strong rebound in the three major U.S. stock indices, which had sharply declined in April. Supported further by Nvidia’s earnings report that vastly exceeded expectations, the Nasdaq Composite rose 6.88% for the month, recovering all April losses and reaching a new all-time high.
In May, the Nasdaq surged 6.88%, fully recovering April’s losses and hitting a record high.
Mid-month, the Federal Reserve maintained hawkish rhetoric, tempering expectations for the timing and frequency of rate cuts, causing market volatility. However, signs of mild economic slowdown in parts of the U.S. economy have led market participants to believe further rate hikes are unlikely, and rate cuts are merely a matter of time. Goldman Sachs has pushed its expected start date for rate cuts from July to September, and current market movements appear to reflect this revised outlook.
Unless abnormal economic data emerges, the bullish trend in U.S. tech stocks is expected to persist.
Crypto Market
In May, BTC opened at $60,621.20 and closed at $67,472.41, rising $6,850.31 (11.3%) for the month, with a volatility range of 25.54%.
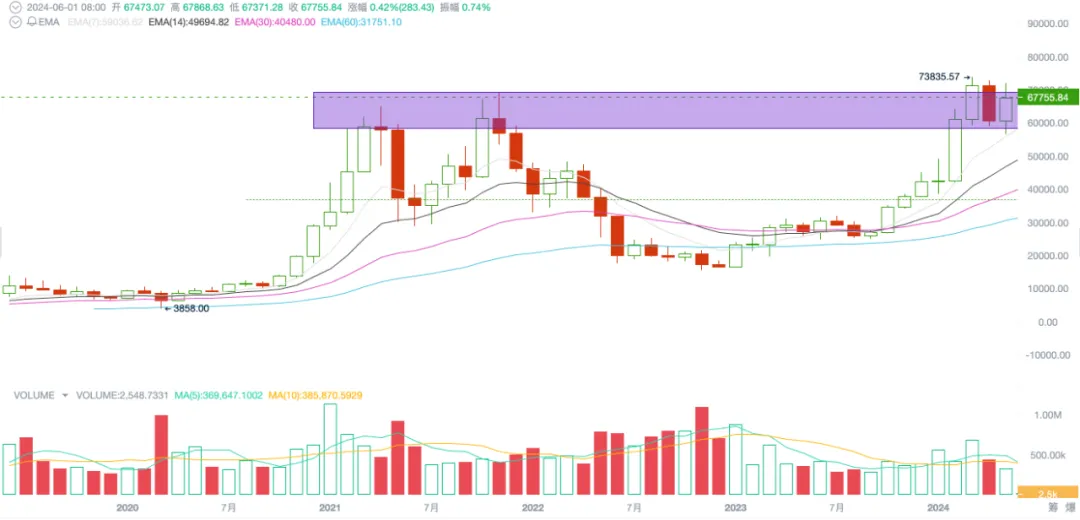
BTC Monthly Chart
Unlike the Nasdaq, BTC failed to strongly recover April’s losses. After significant volatility, trading volume failed to expand sustainably, leaving long upper and lower wicks on the price chart. Its biggest achievement was regaining ground after briefly breaking below its prior top range at the start of the month, re-entering the $58,500–$69,500 consolidation zone.
Although on-chain fundamental activity continues to deteriorate, the effective price recovery—supported by macroeconomic, industrial, and capital inflows—has temporarily eased concerns about the end of the bull market.
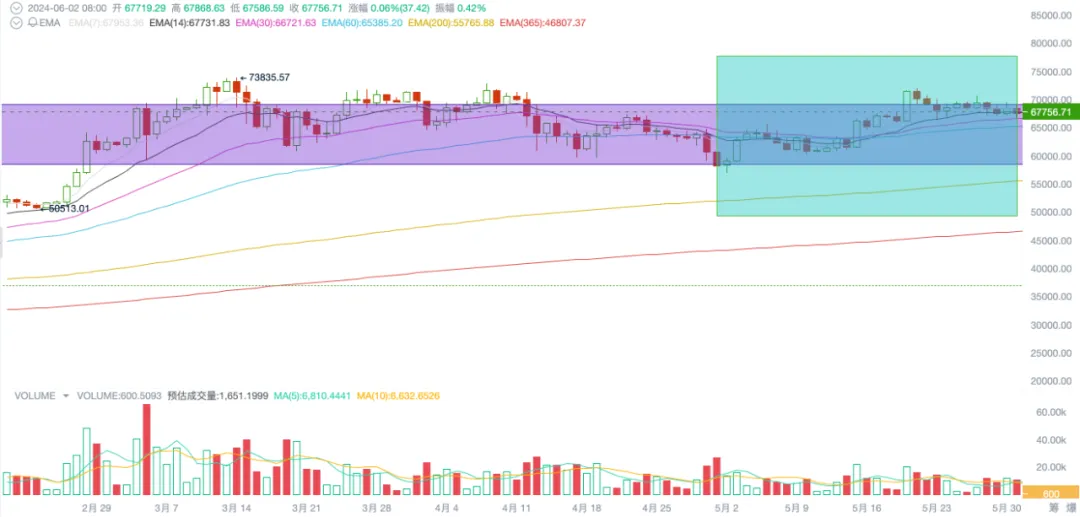
BTC Daily Chart
In this cycle, BTC’s upward momentum has progressed through three stages: inventory replenishment, speculation around BTC ETF approval, and capital inflows following ETF operations. As of the end of May, aside from ETF channels, on-exchange capital inflows have slowed significantly. EMC Labs assesses that BTC’s price rebound in May was primarily driven by the strong upward momentum in ETH.
There are signs of capital shifting from BTC to ETH within the industry. This is confirmed by the significantly increased trading volume in the ETH/BTC pair after May 15.
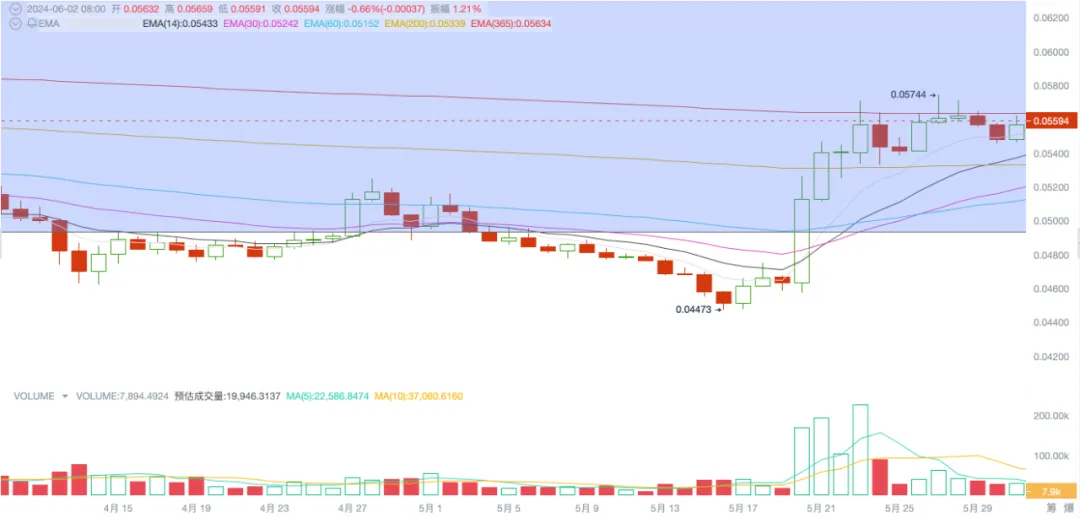
ETH/BTC Pair Shows Noticeable Volume Increase
This reverse flow of industrial capital suggests that future BTC price discovery will depend mainly on inflows through the BTC ETF channel and whether existing on-market capital participates.
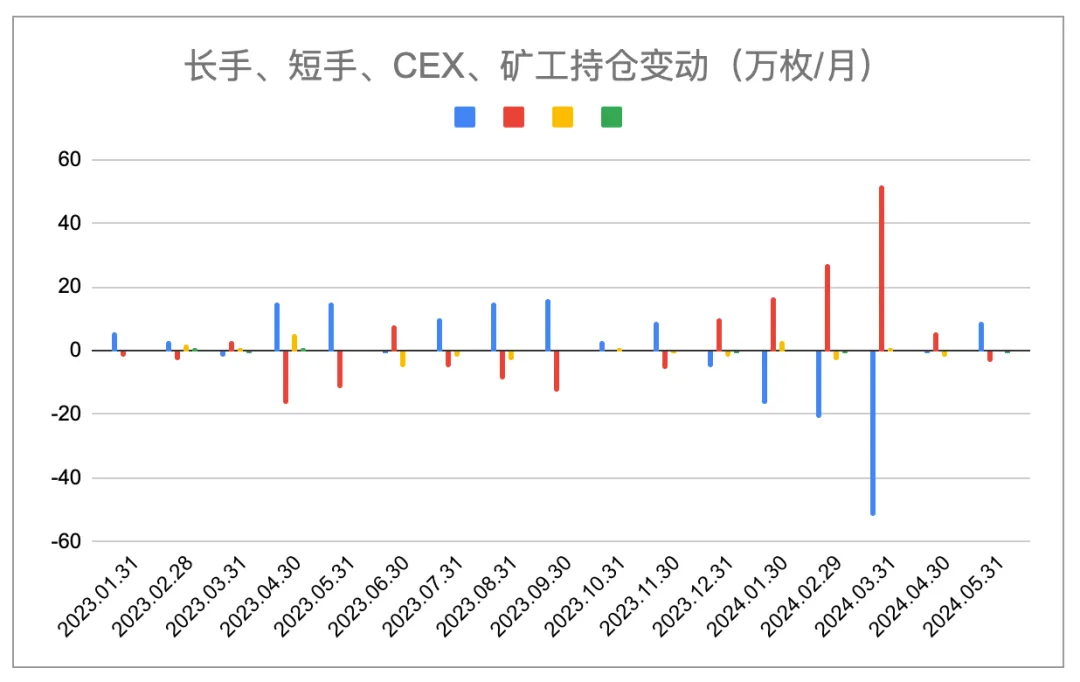
During the bull market, long-term holders gradually sold portions of their BTC holdings into the market, while short-term traders aiming to outperform in the near term increased their positions.
Since December, this “from-long-to-short” trend persisted until reversing in May. This month, long-term holders shifted from net sellers to net accumulators, adding 93,400 BTC, while short-term holders began reducing positions, selling off 38,200 BTC.

Holdings of Long-Term Holders, Short-Term Holders, CEXs, and Miners (Chart by EMC Labs)
Entering the first month post-halving, miners saw declines in both block rewards and transaction fee income, resulting in a sharp drop in revenue to $963 million (per The Block). EMC Labs found that under this financial pressure, miners took two actions this month: selling 6,000 BTC from reserves into the market and reducing hash rate supply.
As prices fell, Bitcoin network hash rate dropped by up to 28% from its peak on April 23.
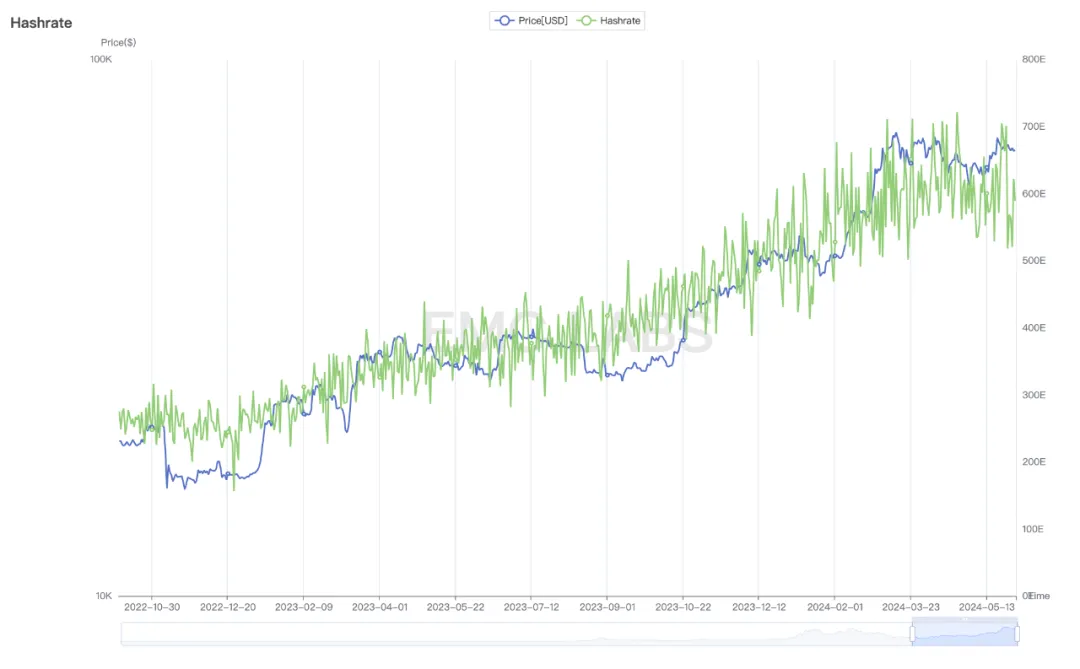
Bitcoin Network Hash Rate Statistics
Miners currently hold 1.8 million BTC and have not engaged in large-scale selling during this bull run. If the market declines further, miners may sell to sustain operations, potentially pushing the already fragile market equilibrium downward.
Market Supply
During the bull market, long-term holders gradually sold portions of their BTC holdings into the market, while short-term traders aiming to outperform in the near term increased their positions.
Since December, this “from-long-to-short” trend persisted until reversing in May. This month, long-term holders shifted from net sellers to net accumulators, adding 93,400 BTC, while short-term holders began reducing positions, selling off 38,200 BTC.
Holdings of Long-Term Holders, Short-Term Holders, CEXs, and Miners (Chart by EMC Labs)
Entering the first month post-halving, miners saw declines in both block rewards and transaction fee income, resulting in a sharp drop in revenue to $963 million (per The Block). EMC Labs found that under this financial pressure, miners took two actions this month: selling 6,000 BTC from reserves into the market and reducing hash rate supply.
As prices fell, Bitcoin network hash rate dropped by up to 28% from its peak on April 23.

Bitcoin Network Hash Rate Statistics
Miners currently hold 1.8 million BTC and have not engaged in large-scale selling during this bull run. If the market declines further, miners may sell to sustain operations, potentially pushing the already fragile market equilibrium downward.
Capital Flows
Since this cycle began, stablecoins have driven market recovery starting October 2023 through net inflows. Inflows reached cycle highs in March and April, serving as a critical buffer against liquidity shocks caused by large-scale BTC profit-taking (the other being fiat inflows via BTC ETFs).
By May, amid massive position swaps and intense market volatility—and with rate cuts delayed—capital inflow velocity through stablecoin channels slowed dramatically. EMC Labs estimates that stablecoin inflows totaled only $341 million in May, far below the $8.9 billion in March and $7.0 billion in April.
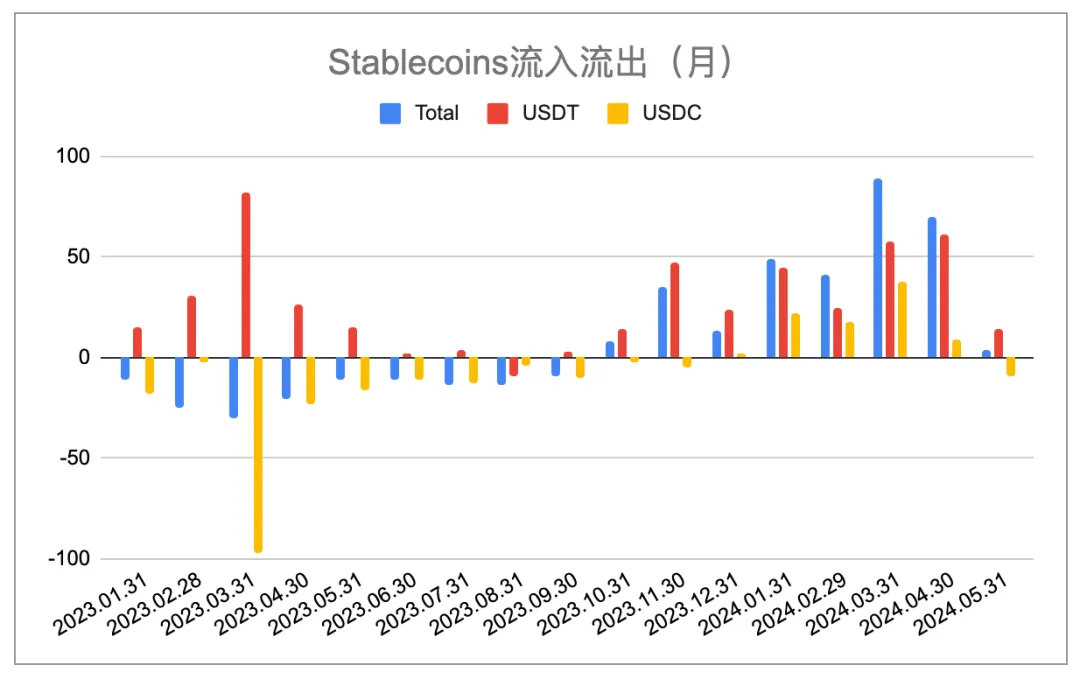
Monthly Changes in Major Stablecoin Supply (Chart by EMC Labs)
Comparing the two major stablecoins, USDT saw inflows of $1.394 billion, while USDC recorded outflows of $973 million—the first such outflow in five months—indicating that U.S.-based stablecoin flows are more sensitive to trends than those in Asia.
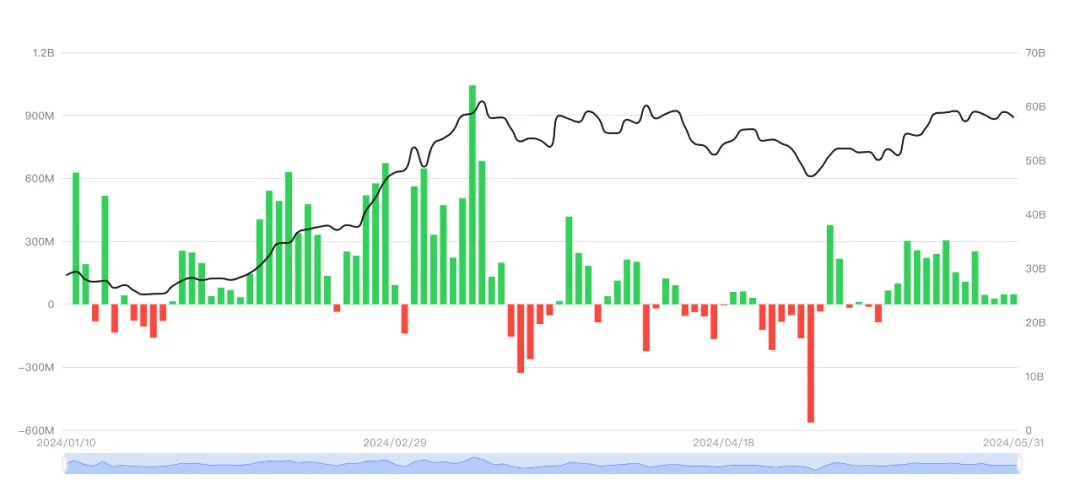
Flows of 11 BTC ETFs in May (Chart by SoSo Value)
EMC Labs observes that across the 22 trading days in May, fiat inflows via ETFs were positive on 17 days and negative on 5, resulting in a total net inflow of $1.905 billion—far exceeding the $341 million inflow through stablecoin channels.
As of the end of May, the 11 U.S. BTC ETFs held assets totaling $58 billion, representing 852,256 BTC or 4.32% of the total supply—emerging as a key force influencing BTC’s price.
Conclusion
In our April report, we judged that the market had entered an intermediate bull phase, with the first wave of large-scale position exchange (March–April) already completed. Throughout May, both long- and short-term trading volumes declined sharply, market supply reverted to “from short to long,” and BTC holdings on exchanges resumed outflows—marking the BTC market’s entry into a state of subdued equilibrium following emotional release.
We maintain our view that capital is shifting from BTC to ETH, suggesting that the “Ethereum moment” will continue. BTC’s future trajectory will depend on U.S. macroeconomic data and Fed communications.
BTC, in its current state of weak equilibrium, does not require substantial capital to move upward. Potential buying pressure may come from spillover enthusiasm following ETH ETF approvals or from fiat inflows via the BTC ETF channel. As this channel grows in scale and aligns rhythmically with the Nasdaq, BTC ETF fiat inflows may evolve into an independent force shaping BTC’s price.
Join TechFlow official community to stay tuned
Telegram:https://t.me/TechFlowDaily
X (Twitter):https://x.com/TechFlowPost
X (Twitter) EN:https://x.com/BlockFlow_News


