

The "Statistical Significance" of the Halving: Is Bitcoin Bullish a Tradable Event?
TechFlow Selected TechFlow Selected
The "Statistical Significance" of the Halving: Is Bitcoin Bullish a Tradable Event?
While it's difficult to make any high-confidence judgments based solely on the halving, it may indeed carry structural bullish factors.
Translation: Frank, Foresight News
Summary:
-
On the surface, the long-anticipated Bitcoin halving has historically been bullish;
-
However, given the limited number of prior halvings available for analysis and a closer look at Bitcoin’s performance within broader market conditions, it is difficult to make any high-confidence assertions based solely on the halving event itself;
-
Overall, from a supply perspective, the Bitcoin halving may not be a directly tradable event, but it introduces structural bullish factors that could support another post-halving rally—if backed by favorable macroeconomic tailwinds.
The consensus around the Bitcoin halving is bullish, and it is widely regarded as a tradable event—but is this really true? In this report, we analyze past halving events and conduct supply- and macro-focused research on the 2024 halving to gain a more comprehensive understanding of what this widely anticipated event might mean for investors.
What Is the Bitcoin Halving?
The halving is a pre-programmed event in the Bitcoin network that cuts the reward for mining Bitcoin in half. It is a key mechanism in Bitcoin’s monetary policy, designed to ensure that only 21 million BTC will ever enter circulation, preventing inflation and progressively slowing the issuance rate of new bitcoins.
This protocol update occurs approximately every 210,000 blocks—roughly every four years. When Bitcoin launched in 2009, the mining reward was set at 50 BTC per block. With today’s being the fourth halving, following previous ones in 2012, 2016, and 2020, the block reward has now decreased to 3.125 BTC per block.
Bitcoin uses the Proof-of-Work (PoW) consensus mechanism to validate and secure transactions on the blockchain. Under PoW, miners compete to solve complex mathematical problems, and the first miner to solve it successfully adds the next block of transactions to the blockchain.
As compensation for validating transactions and adding blocks to the blockchain, the winning miner receives newly minted bitcoins as a reward—the very reward that gets “halved” during today’s halving event.
The Harsh Historical Reality of the 'Halving'
At first glance, the halving has historically proven beneficial for BTC.

The chart above shows BTC's historical price action before and after each halving date (spanning one year before and after the event). The red dashed line represents the volume-weighted average of all past halvings, while the black line reflects current BTC data.
The table below summarizes the data in tabular form. Note: Day 0 on the horizontal axis = halving date; Day 0 on the vertical axis = 100. This analysis uses price data as of April 17.
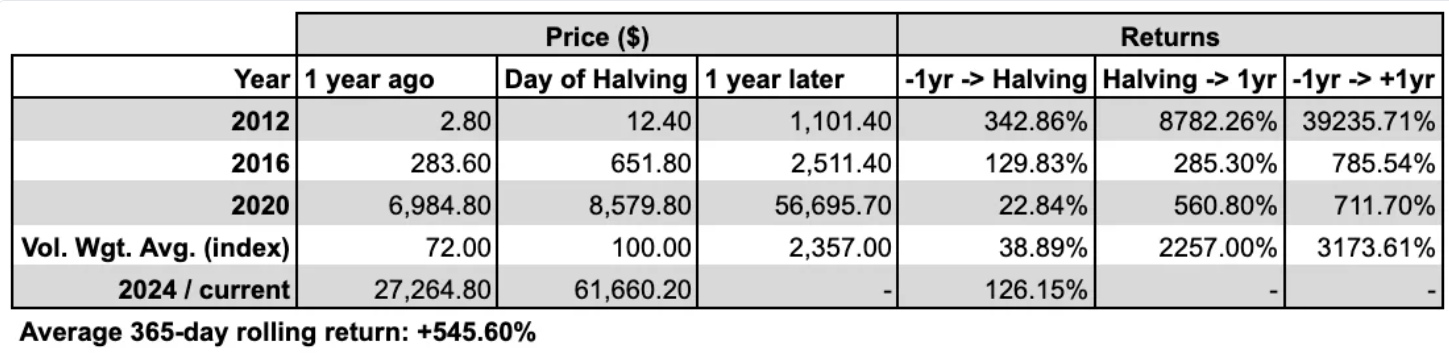
The logarithmic Y-axis in the first chart suggests that halvings act as bullish catalysts. However, with only three observations—and considering the first occurred when BTC was just $12.80, and the third took place in May 2020 amid a broad-based rebound across all risk assets due to the Covid recovery—it seems prudent to approach any interpretation of this data with skepticism.
Moreover, when examining BTC’s average one-year return since mid-2011, aside from the first halving in 2012, the one-year returns following subsequent halvings appear less than impressive.
Additionally, the 2020 halving raises an interesting question about overall market conditions at the time. In the chart below, we compare BTC against equities—specifically the S&P 500 index—as a benchmark for risk assets.
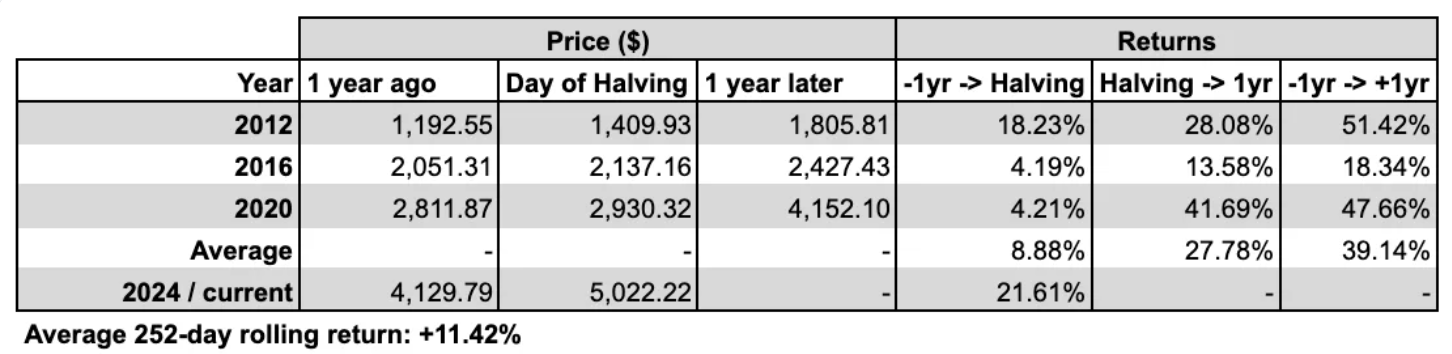
While the SPX has delivered an average rolling one-year return of +11.42% since mid-July 2011 (aligned with BTC’s historical price data), its average performance starting one year after each Bitcoin halving exceeds +27%—more than double the average!
This highlights an important reality often overlooked by popular narratives. Just as we cannot conclude that "a programmed update in the Bitcoin network that halves miner rewards is highly beneficial for the S&P 500," we also cannot draw definitive conclusions from BTC’s past performance alone.
In fact, using certain metrics such as outperformance hit rates, one could even argue that Bitcoin halvings have historically benefited the S&P 500 more than Bitcoin itself!
Meanwhile, for those interested in volatility, the data shows no clear relationship between volatility and the halving date or cycle. The chart below displays 30-day realized volatility around the halving dates (±365 days):

2024 Halving Theme #1: Long-Term Holders
Here, we examine the total amount of BTC held by long-term holders, adjusted for Bitcoin’s circulating supply.
Since Bitcoin’s circulating supply continues to grow until it reaches the hard cap of 21 million BTC, we divide the holdings of long-term holders by the current circulating supply to express ownership as a percentage:

Despite the nuances in 2020, Figure 5 indicates that long-term holders tend to take profits ahead of the halving, with a similar dip observed in 2024. This selling dynamic is often attributed to miners; since the halving effectively reduces income per block by 50%, miners typically sell part of their reserves upon reward reduction to upgrade hardware for more efficient mining. This structural selling pressure may already be underway, with the 2024 halving just days away.
Although the situation in 2020 was nuanced, the chart above suggests that long-term holders may cash out before the halving—a trend also visible in 2024.
This type of sell-off is usually attributed to miners—since the halving effectively cuts block income by 50%, miners often sell portions of their BTC reserves when rewards decrease in order to upgrade their hardware for more efficient mining. This kind of structural selling pressure may currently be taking place.
2024 Halving Theme #2: Exchange BTC Balances
Although exchanges themselves do not take directional bets, we still examine BTC reserve holdings on exchanges (and possibly their internal market makers) to identify any discernible patterns around halving dates:
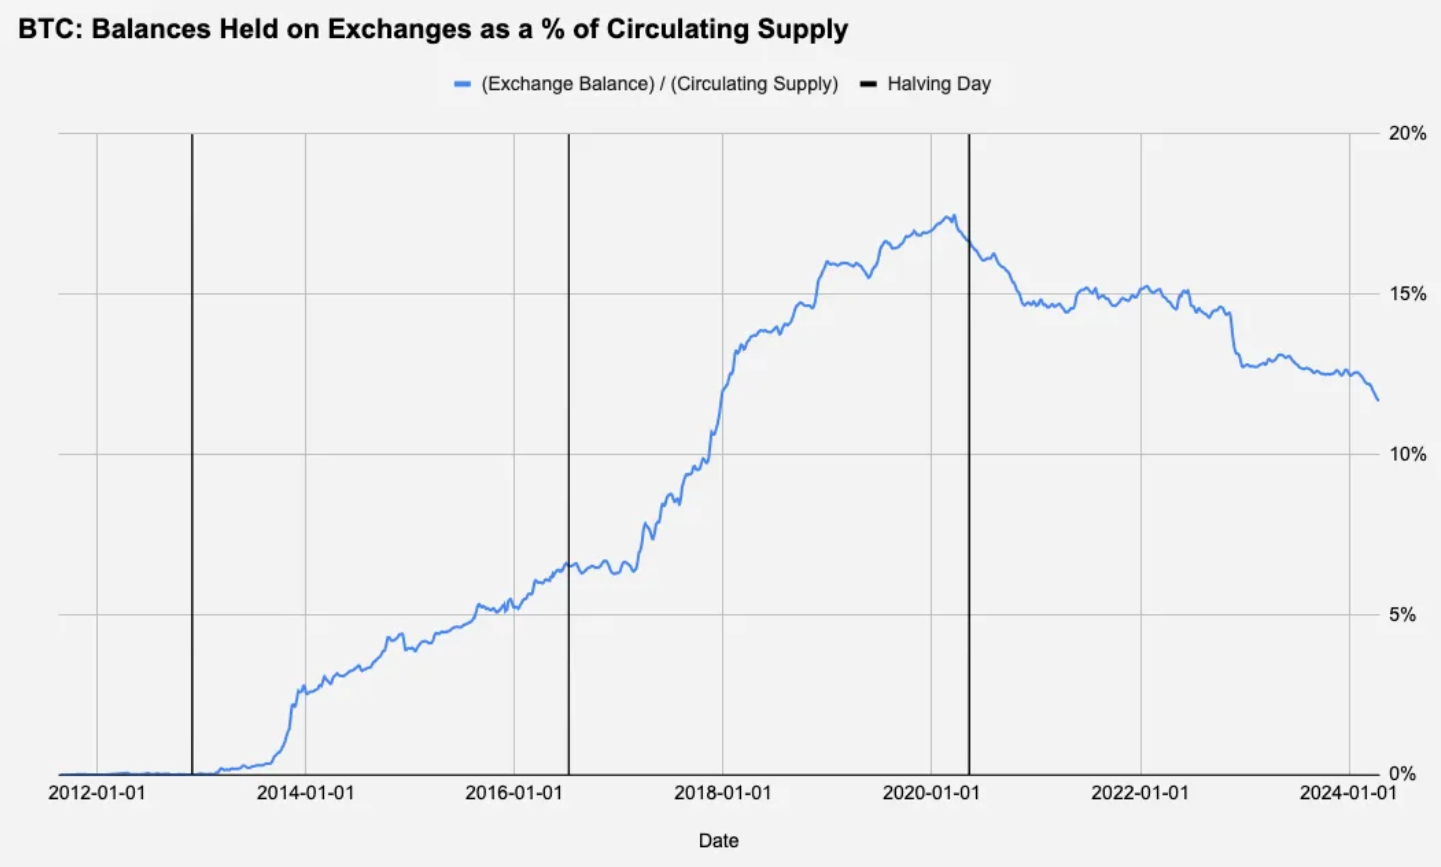
The chart above divides the total BTC supply held by cryptocurrency exchanges by the current circulating supply, revealing little of note. The only observable trend is a long-term one—exchanges underwent roughly six years of accumulation, followed by a steady decline in BTC holdings coinciding with the start of the last bull market.
2024 Halving Theme #3: Macro Context
The correlation between macro conditions and Bitcoin is frequently debated, yet macro cycles—particularly dollar liquidity (as a function of monetary policy, interest rates, risk appetite, etc.)—remain primary drivers of asset prices over medium to long-term horizons. With that in mind, we closely examine forward market pricing of the federal funds rate over the 12 months following each halving, shown in the chart below:

It is clear that the 2024 halving stands out as an outlier, with nearly three rate cuts priced in—or put simply, the market already anticipates some form of rate movement.
Rate cuts are generally positive for risk assets, but for price movements, what matters most is not what is already priced in, but rather the degree of deviation from market expectations—whether through inflation data or statements by the Fed Chair. In the chart below, we compare the difference between actual settled implied rates and market expectations on each halving date to assess the accuracy of the forward-looking pricing shown above.
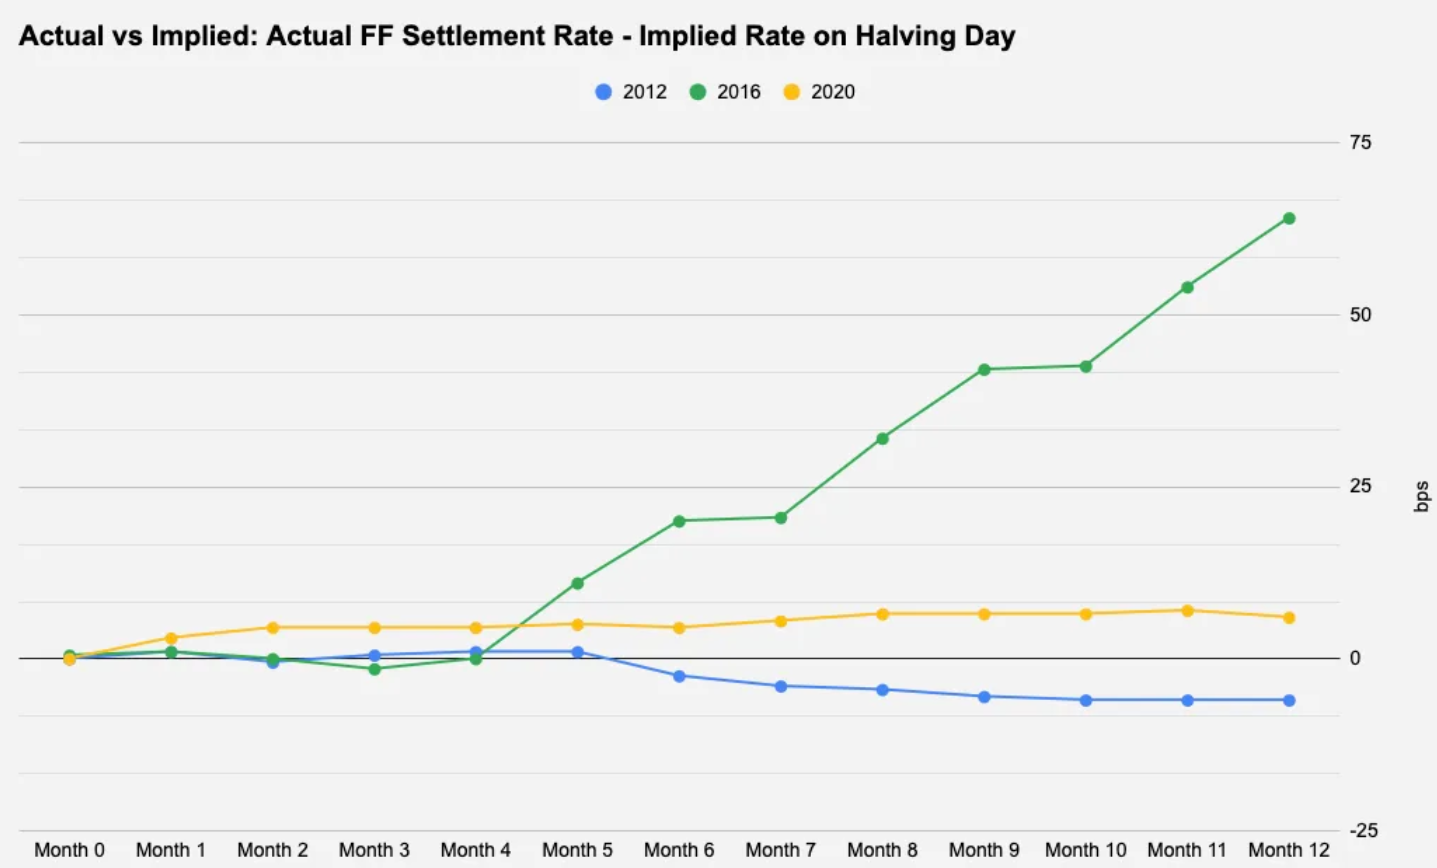
Data for 2012 and 2020 is relatively uneventful, differing by only ±10 basis points from initial expectations. However, 2016 warrants closer examination, as the Federal Reserve raised rates twice despite no market expectation for such moves.
Interestingly, Figures 1 and 2 above show that the 12 months following the 2016 halving marked BTC’s weakest performance among the first three halvings and the only period where it underperformed its average one-year return. Therefore, with more than two rate cuts already priced in over the next 12 months, the key driver post-halving may instead be persistent U.S. inflation or any other factor that leads the Fed to maintain its current stance without cutting rates.
Conclusion
We briefly explored the unique macro backdrop of this halving, though other factors—such as the recent launch of spot BTC ETFs—were not covered in this report. With all the attention BTC has recently garnered, this is undoubtedly the most anticipated halving to date. The growing institutionalization of Bitcoin has introduced new participants that may alter supply-demand dynamics and price behavior. Notably, newly launched ETFs hold over 4.1% of BTC’s circulating supply, while MicroStrategy holds more than 1%.
Given that there have only been three prior halvings, it is difficult to draw statistically significant conclusions from past performance to determine whether this is truly a tradable event. However, structurally speaking, from a supply standpoint, it is undoubtedly a bullish development.
Join TechFlow official community to stay tuned
Telegram:https://t.me/TechFlowDaily
X (Twitter):https://x.com/TechFlowPost
X (Twitter) EN:https://x.com/BlockFlow_News


