

March Crypto Market Report: After the Big Sell-Off, the Bull Market Continues
TechFlow Selected TechFlow Selected
March Crypto Market Report: After the Big Sell-Off, the Bull Market Continues
First major sell-off in the bull market as sellers locked in $63.1 billion in profit through BTC transactions.
Author: 0xWeilan
Global financial markets remained calm in March.
Both the Nasdaq and Dow Jones indices reached new rebound highs without surprise. The Nasdaq has now risen for five consecutive months, indicating that bullish capital is increasingly tolerating delayed U.S. rate cuts.
Several factors have contributed to the delay in rate cuts.
The U.S. CPI rose slightly from 3.1% to 3.2%, the U.S. manufacturing PMI rebounded to 50.3%, signaling expansion, and Japan ended its eight-year negative interest rate era with its first rate hike.
The probability of a U.S. rate cut in April has significantly decreased, and the likelihood for May has also dropped below 50%.
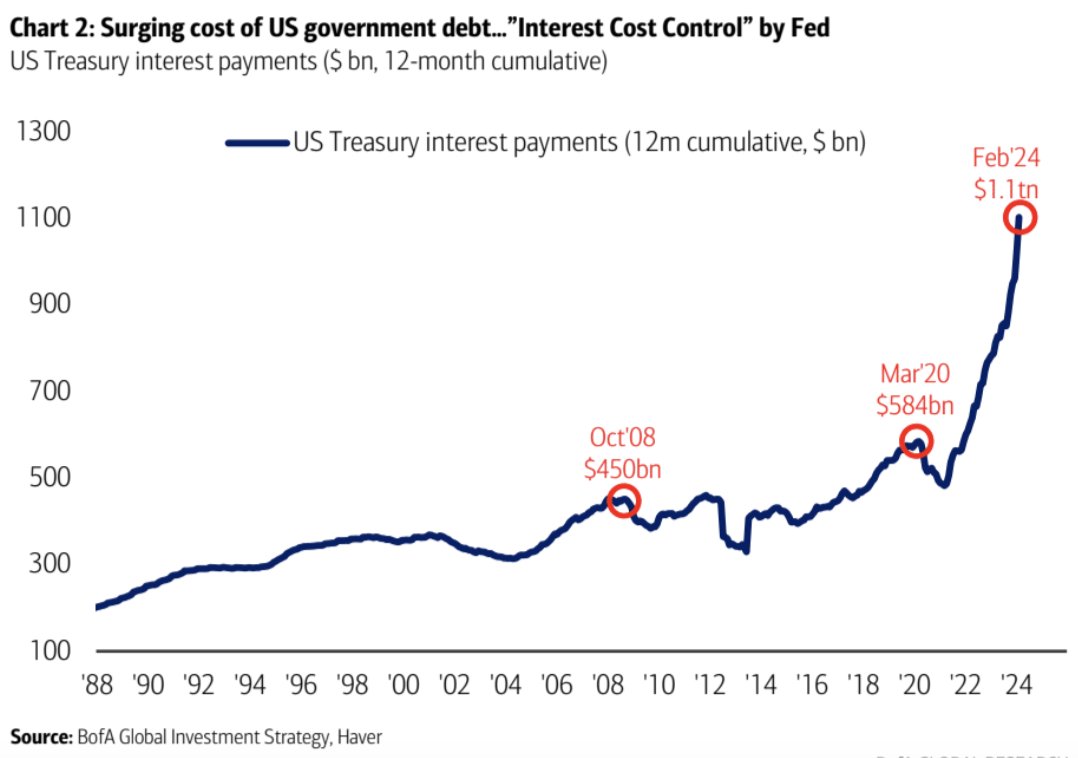
U.S. Treasury Interest Expense (Chart by Bank of America)
The U.S. Dollar Index continued to rebound in March, rising to 104.49 by month-end.
Gold prices hit a record high, as did BTC prices.
Capital repatriation to the U.S. simultaneously boosted both risk-on and safe-haven assets.
Meanwhile, U.S. government spending on Treasury debt over the past 12 months has reached $1.1 trillion—doubled since the pandemic. Bank of America noted in its report: if the U.S. government does not cut rates by 150 basis points within the next 12 months, interest costs will rise to $1.6 trillion. By year-end, Treasury interest payments will become the largest expenditure item for the U.S. government.
This is the cost of increased Treasury issuance and delayed rate cuts—and one deep reason why markets are betting the U.S. government will cut rates soon.
A U.S. rate cut would usher macro finance into an easing cycle, launching equities and crypto markets into a new upward phase.
This is what global investors are most closely watching—and it is deeply tied to the crypto asset market.
Currently, markets are pushing rate cut expectations into the second half of the year. Whether in U.S. equities or crypto, some capital is beginning to lock in profits and exit.
Crypto Market
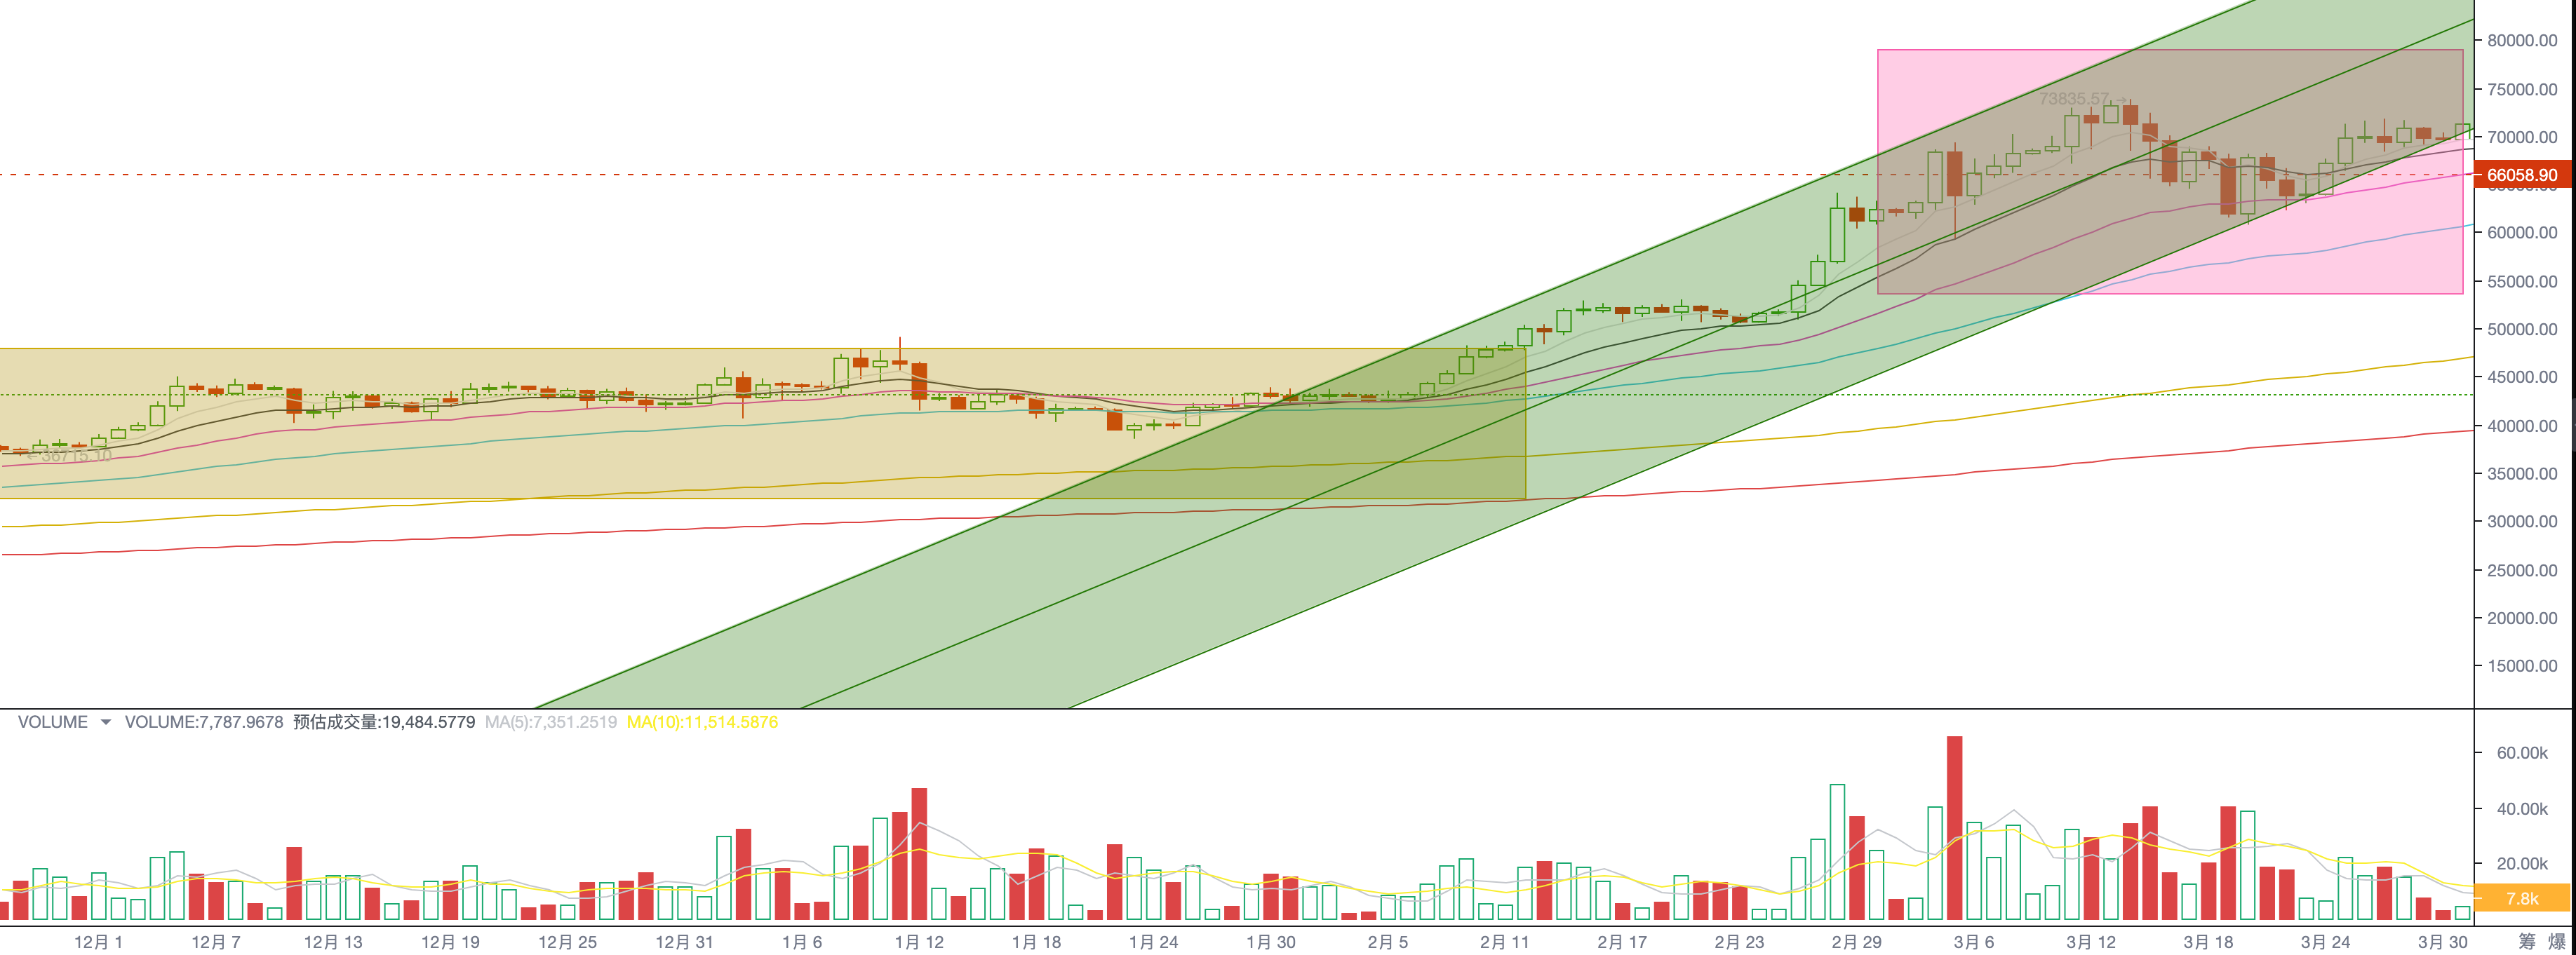
BTC Daily Chart
In March, BTC opened at $61,179 and closed at $71,289, rising 16.53% for the month with a volatility of 23.88%. It achieved seven consecutive monthly gains—the highest volume in seven months.
Throughout March, BTC stayed within its “bull run” ascending channel. March 13 marked a mid-term trend inflection point when BTC hit its bull market high. Afterward, trading volume generally declined. After touching the 30-day moving average on March 20 and rebounding, volume failed to re-activate, indicating a stalemate between bulls and bears. As of April 2, when this report was written, BTC had fallen for two consecutive days, testing the 30-day MA again, with volume starting to expand.
BTC’s seven-month rally ties the historical record. Both long-term holders (“long hands”) and short-term traders (“short hands”) have accumulated substantial unrealized profits. As prices climb, profit-taking sell-offs are becoming a key market focus.
The battle between inflowing capital and BTC selling pressure is now the dominant force shaping BTC’s price in the short-to-medium term.
Large-Scale Selling
We view a bull market as a phenomenon where, under loose liquidity, new participants enter with capital to buy assets, prompting existing holders to sell. For long-term BTC investors, a bull market is a time for strong selling.
In this cycle, December 3, 2023, marked the all-time high for long-hand holdings, totaling 14,916,832 BTC. Since then, as the bull market gradually launched, long hands began their once-every-four-years cyclical large-scale sell-off, offloading 897,543 BTC by March 31.
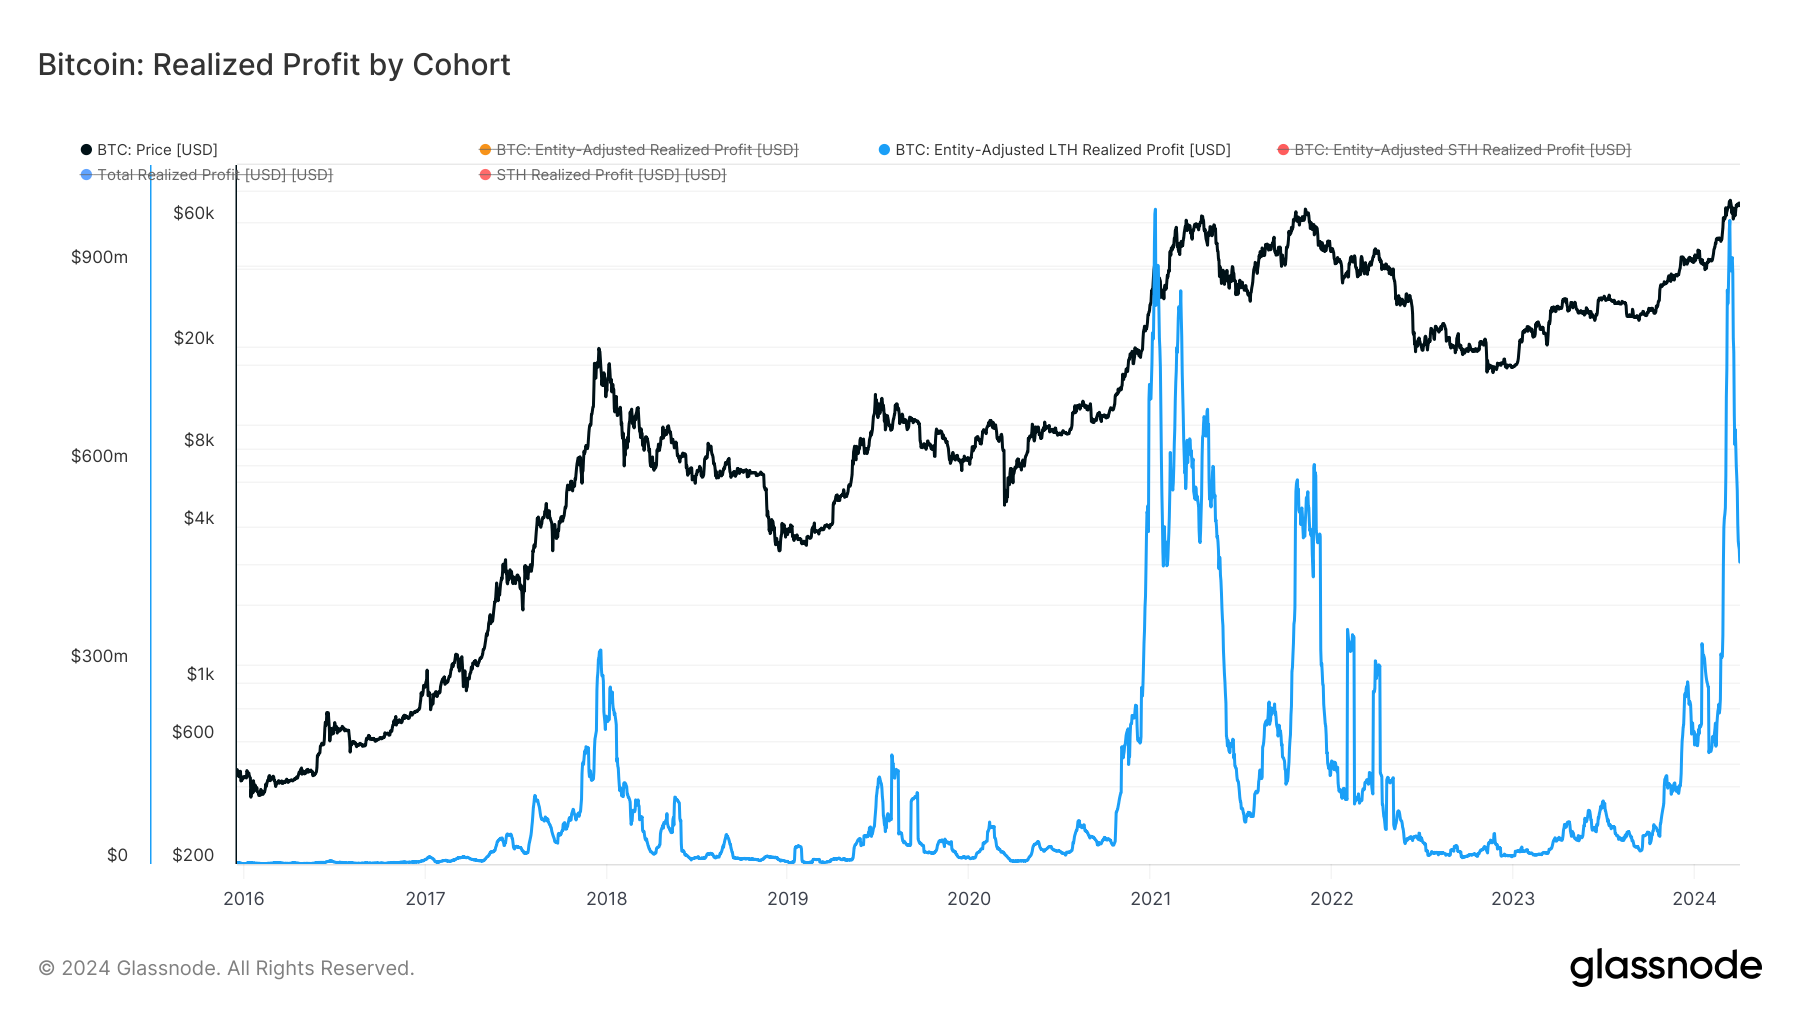
Long-Hand Profit Taking
The process begins with long-hand selling and ends with short-hand absorption—a dynamic equilibrium.
During uptrends, incoming capital controls pricing, driving prices up through dominant buying volume to maintain balance.
When long hands dominate selling during uptrends, dominant sell volume drives prices down to restore equilibrium.
Another important participant—the profitable short hand—also becomes a key downward force during rallies.
Observing March’s sell-offs, we found synchronized selling by both long and short hands.
On February 26, both groups began large-scale transfers to exchanges, peaking on March 12 before declining steadily.
On March 12, transfer volumes peaked; the next day, BTC fell from its high of $73,835.57, bottoming at $60,771.14 on March 20.
After March 20, bulls pushed BTC back to $71,288.90, but persistent selling pressure continued, culminating in another collapse during the first two trading days of April.
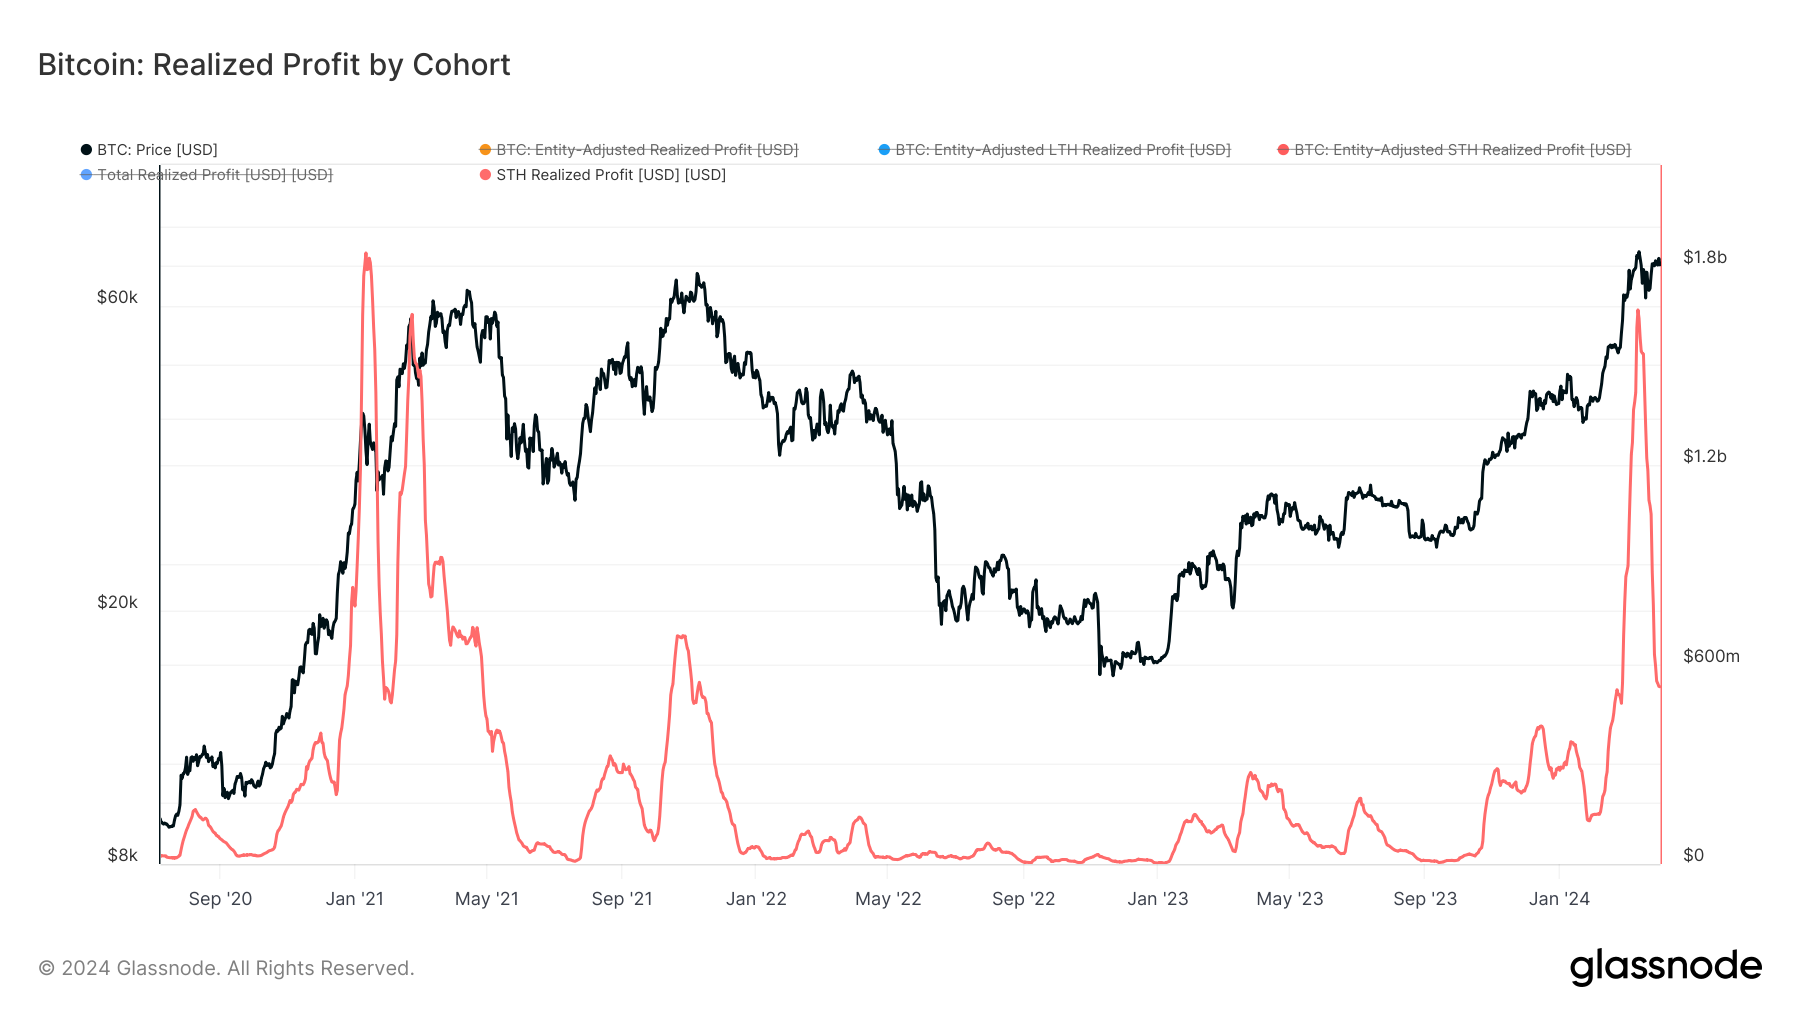
Short-Hand Profit Taking
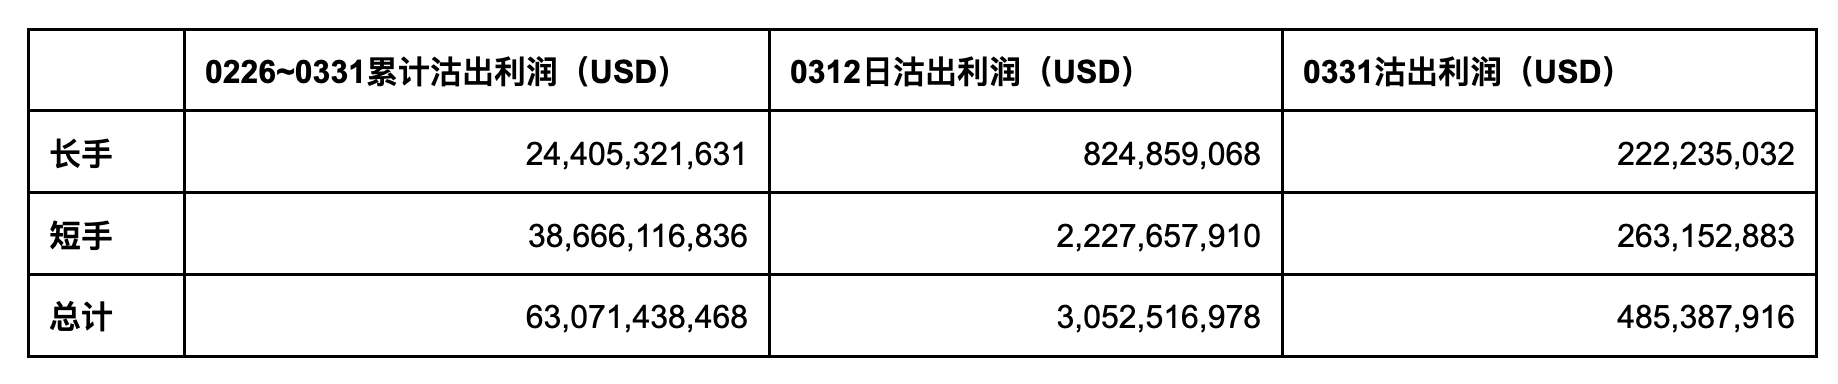
The coordinated sell-off by long and short hands on March 12 marked the first major wave of profit-taking since the bull market began, generating $3 billion in realized profits that day alone. From February 26 to March 31, total realized profits reached $63.1 billion.
Notably:
From February 26 to March 12 (the first half of the sell-off), BTC was driven by buying momentum, rising from $51,730.96 to $71,475.93.
From March 13 to March 31 (the second half, still ongoing), BTC entered a selling-dominant phase, dropping from a high of $73,709.99 to $60,771.74.
Although the peak selling occurred on March 12, daily sell-offs by both groups remained above $1 billion through month-end.
EMC Labs believes this sustained, large-scale selling is the fundamental cause of BTC’s decline from March to April. This marks the first major sell-off of the bull market, where sellers seized pricing power, dampening bullish sentiment and locking in $63.1 billion in cumulative profits.
Whether profit-taking triggers price declines during rallies depends on the balance between bulls and bears. Initially, sellers test the market cautiously while prices continue rising, so they increase selling volume until bulls exhaust their firepower, leading to price drops. As prices fall, sellers reduce output and buyers regain strength, eventually pushing prices up again. This tug-of-war continues until the next selling phase.
Throughout a bull run, such battles occur multiple times. After repeated sell-offs, most supply shifts to short hands and liquidity floods the market, ultimately overwhelming buyers and ending the bull market.
EMC Labs assesses that selling pressure is now sharply declining but not yet over. While prices are unpredictable, the first major sell-off of the bull market is nearing its end. This pre-halving large-scale sell-off has cleared many profit-taking positions and raised BTC’s cost base, setting the stage for the next price surge.
Bull Market Gradually Unfolding
One external catalyst for this bull market is capital inflows from approved BTC ETFs; internal drivers include technological advancements and new application rollouts.
In our February report, we stated that any cycle must be fundamentally supported by industry development. Guided by this logic, we turn to application-layer blockchain data.
In March, Ethereum completed the Dencun upgrade, effectively reducing Layer2 gas fees and increasing Layer1 capacity. We observed a significant rise in Ethereum’s daily active users—from around 400,000 in early February to 1.13 million by end-March, nearly tripling. This is a strong performance for the Ethereum community and a clear signal of bull market initiation.
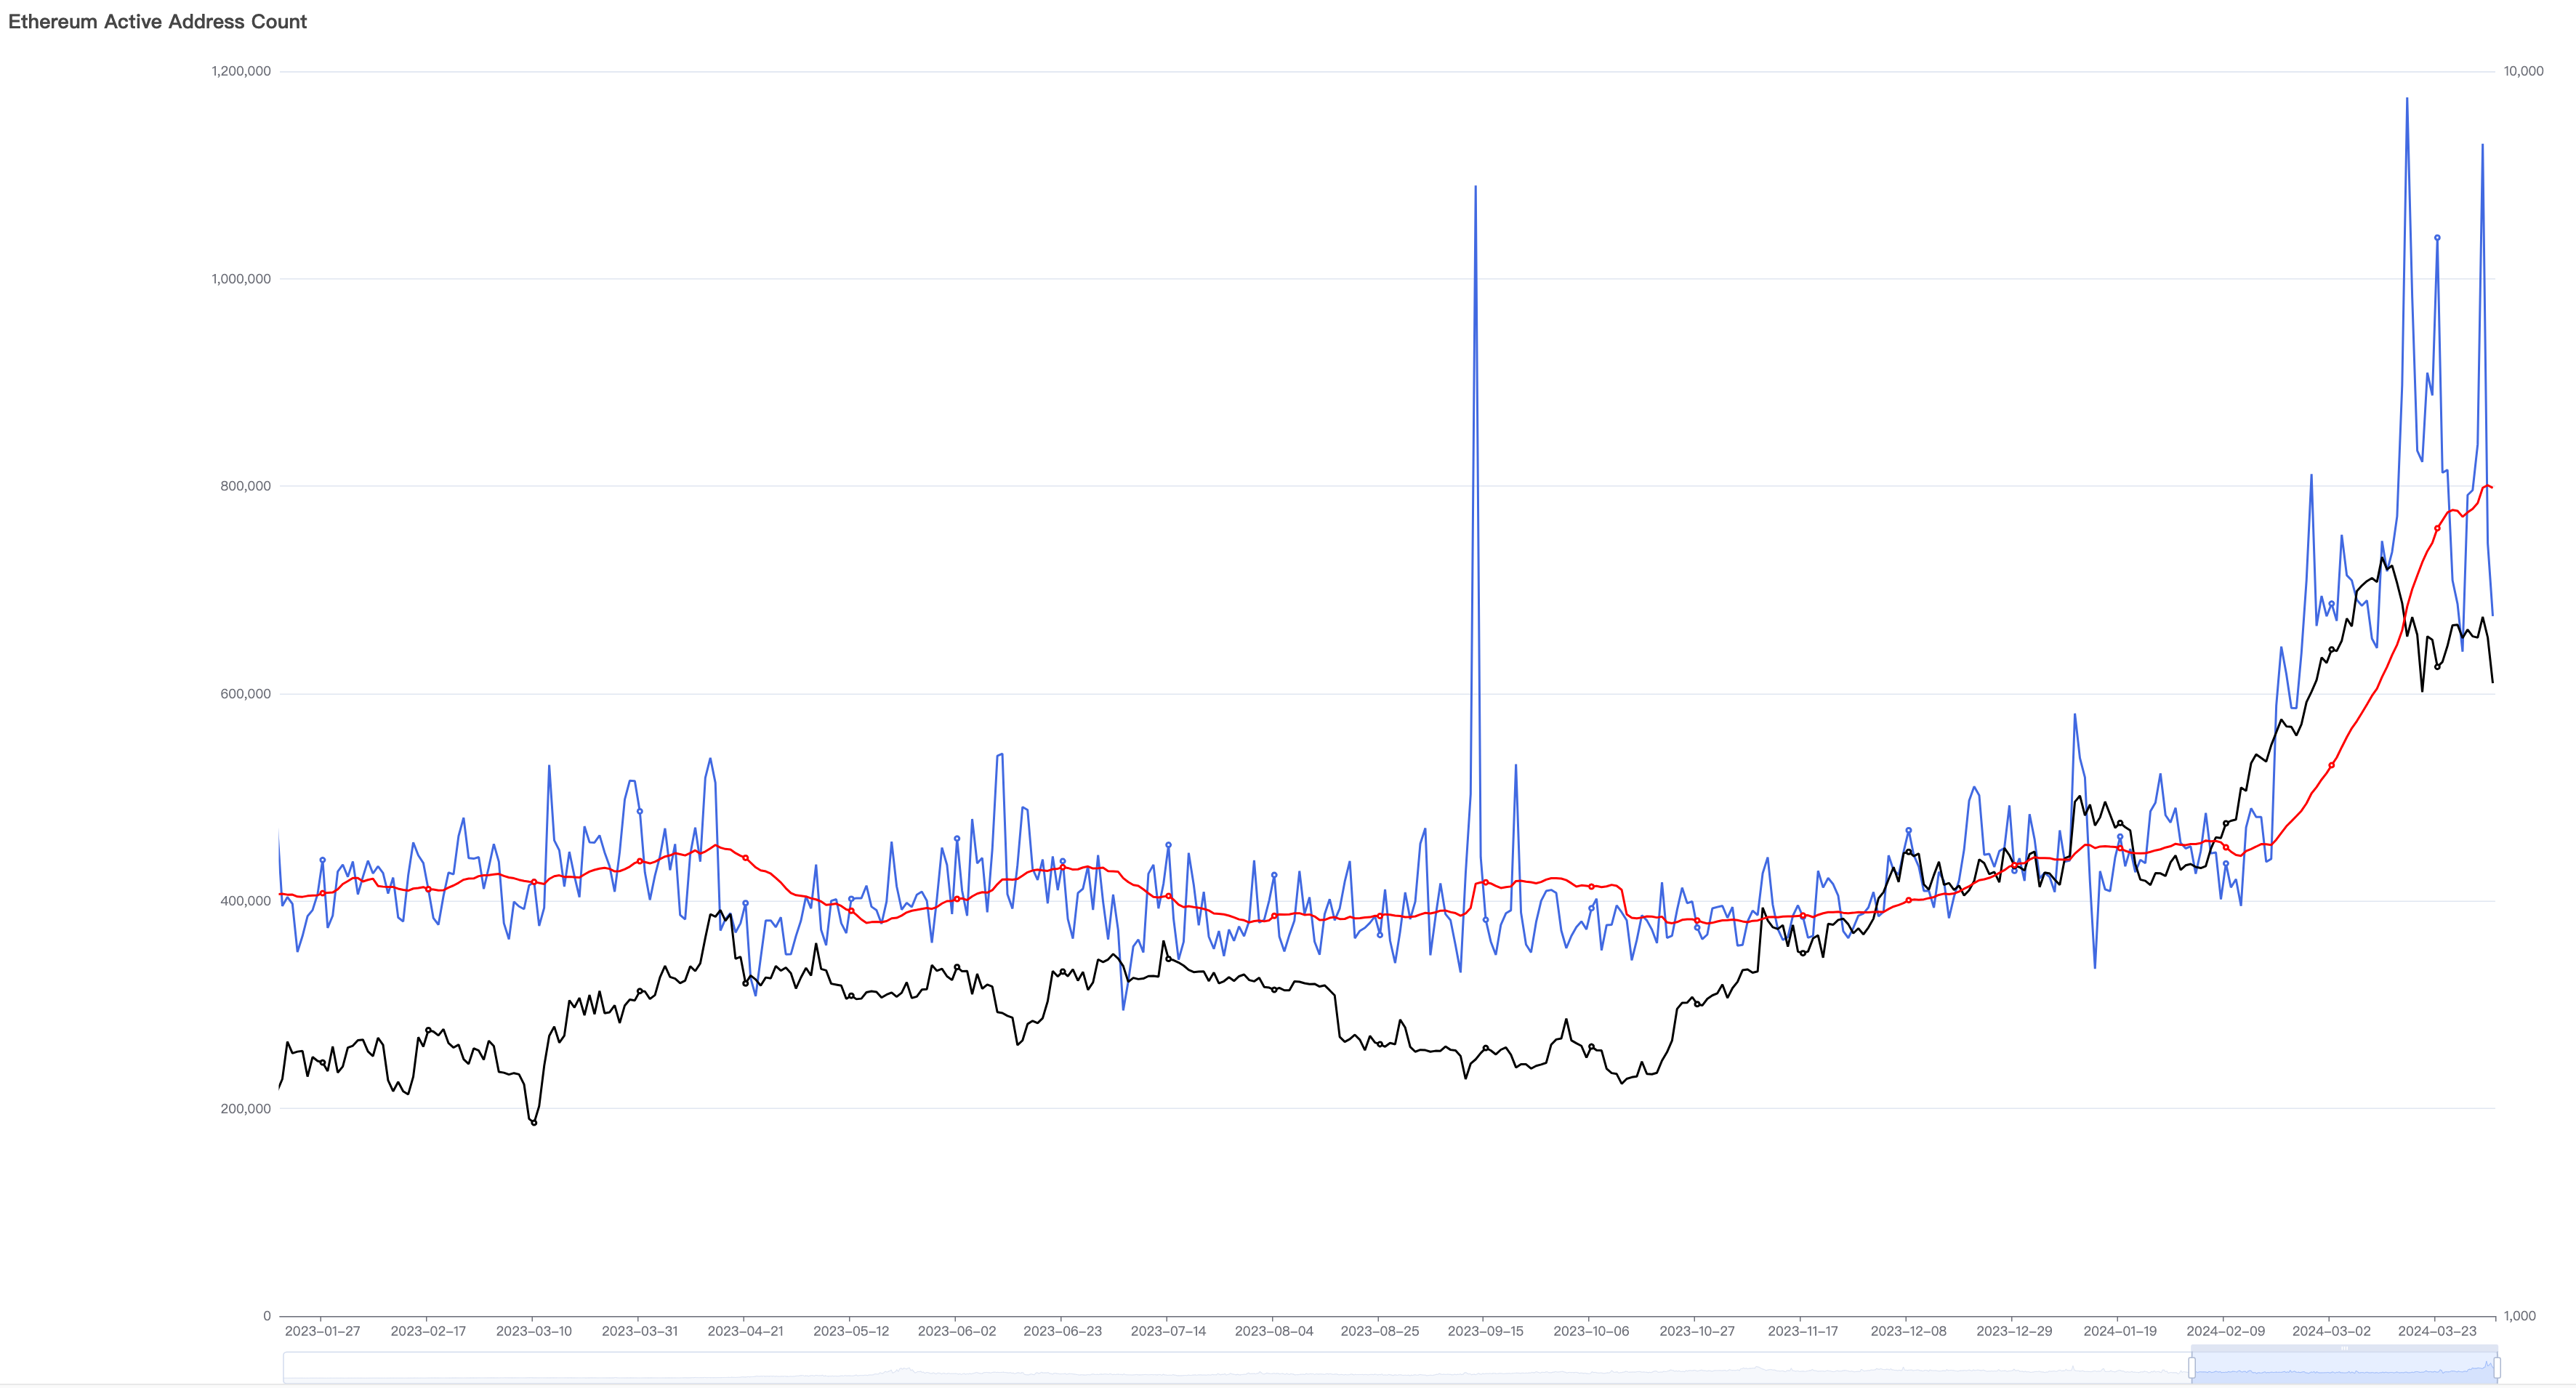
Ethereum Daily Active Addresses
Beyond existing user activity, bull markets attract new users. We monitor this via new address creation.
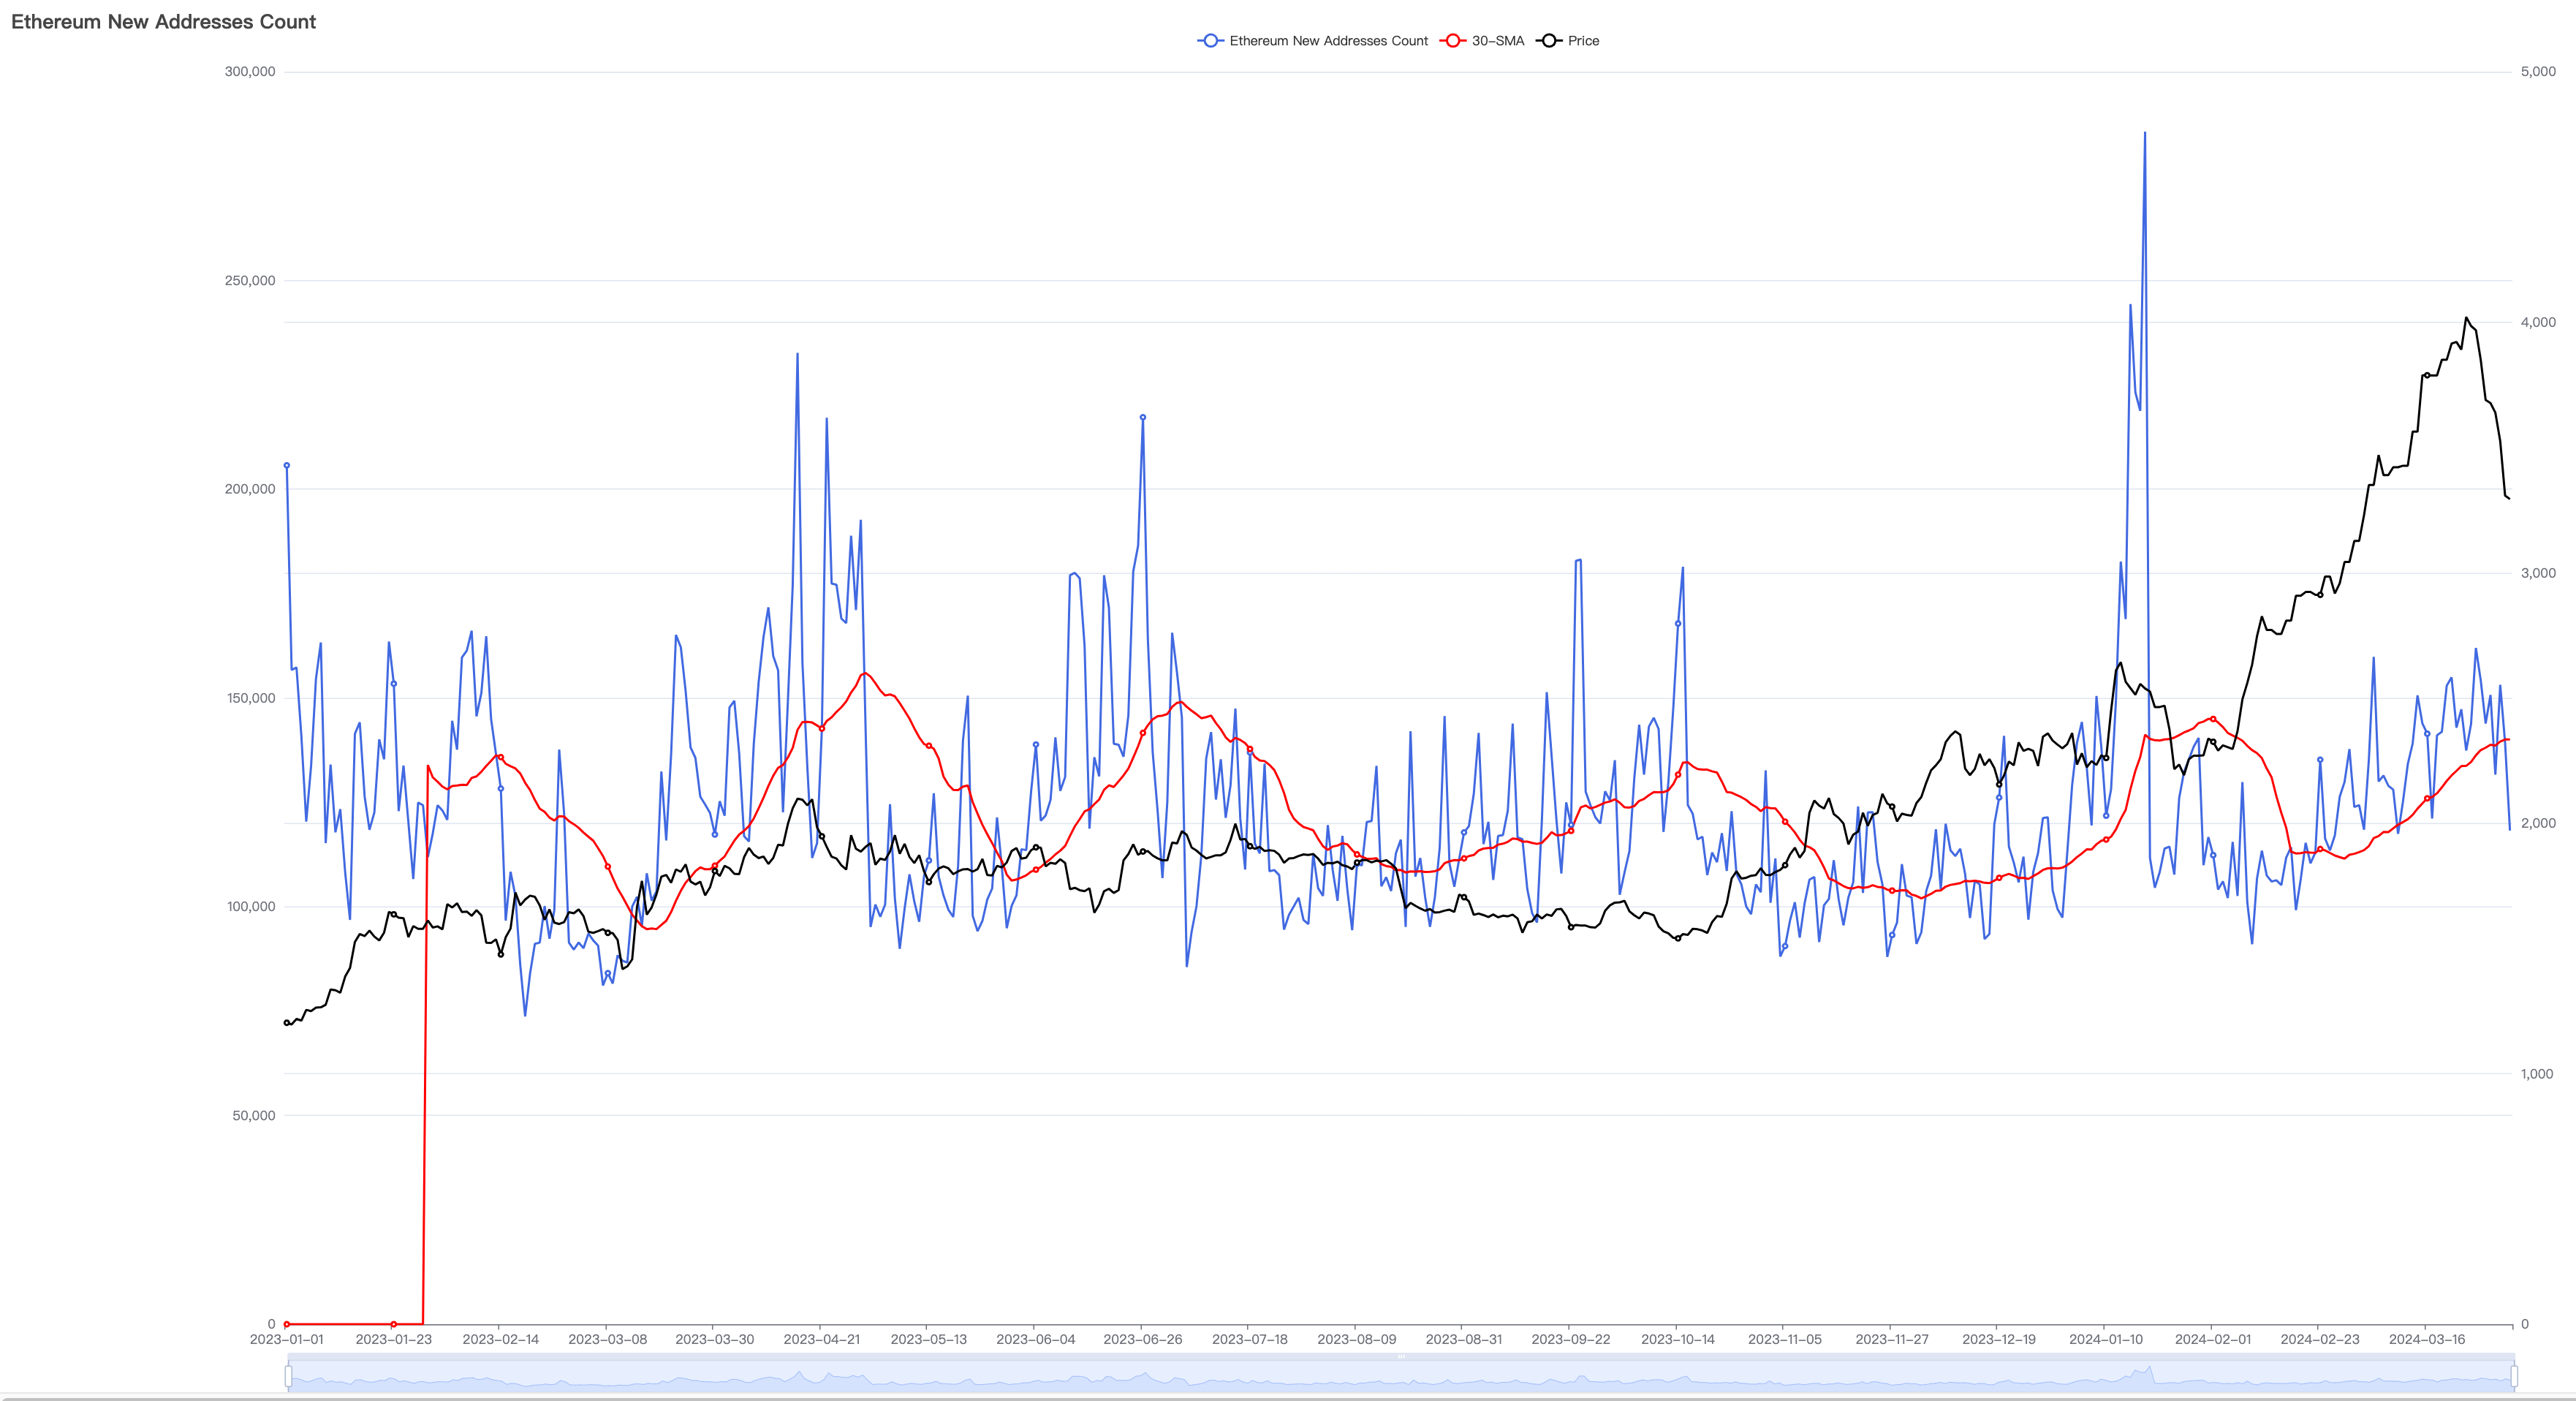
Ethereum Daily New Addresses
Since March, Ethereum’s new user growth has improved, with the 30-day average rising, though not surpassing last year’s peak. Since 2023, new Ethereum users have shown typical wave-like patterns, not yet exhibiting impulse-style surges.
Sustained user growth on Ethereum is inevitable during a bull market—an evolution worth continuous monitoring.
Ethereum’s data suggests the bull market has just begun—mainly driven by the revival and activation of existing users, while large-scale new user influx has not yet arrived.
Looking at other app chains like BNB Chain, Avalanche, and Polygon, on-chain users remain dormant, showing no sign of bull market vitality.
Only one chain outperforms Ethereum by far—Solana, which is experiencing a wild resurgence and explosive growth.
Examining Solana’s new user statistics reveals a perfect impulse-growth pattern. Throughout 2023, its new users and price grew slowly. Around mid-November, the growth slope steepened, rising from about 300,000 daily new users to 1.6 million by mid-January—a more than fourfold increase. After two pullbacks in late January and late February, March saw violent growth, nearly doubling over 30 days.
This strong performance has pushed Solana’s network—whether measured by daily new users, daily active users, or daily gas consumption—to surpass its previous bull market highs, setting new records.
This massive adoption underpins SOL’s price leadership among major cryptocurrencies.
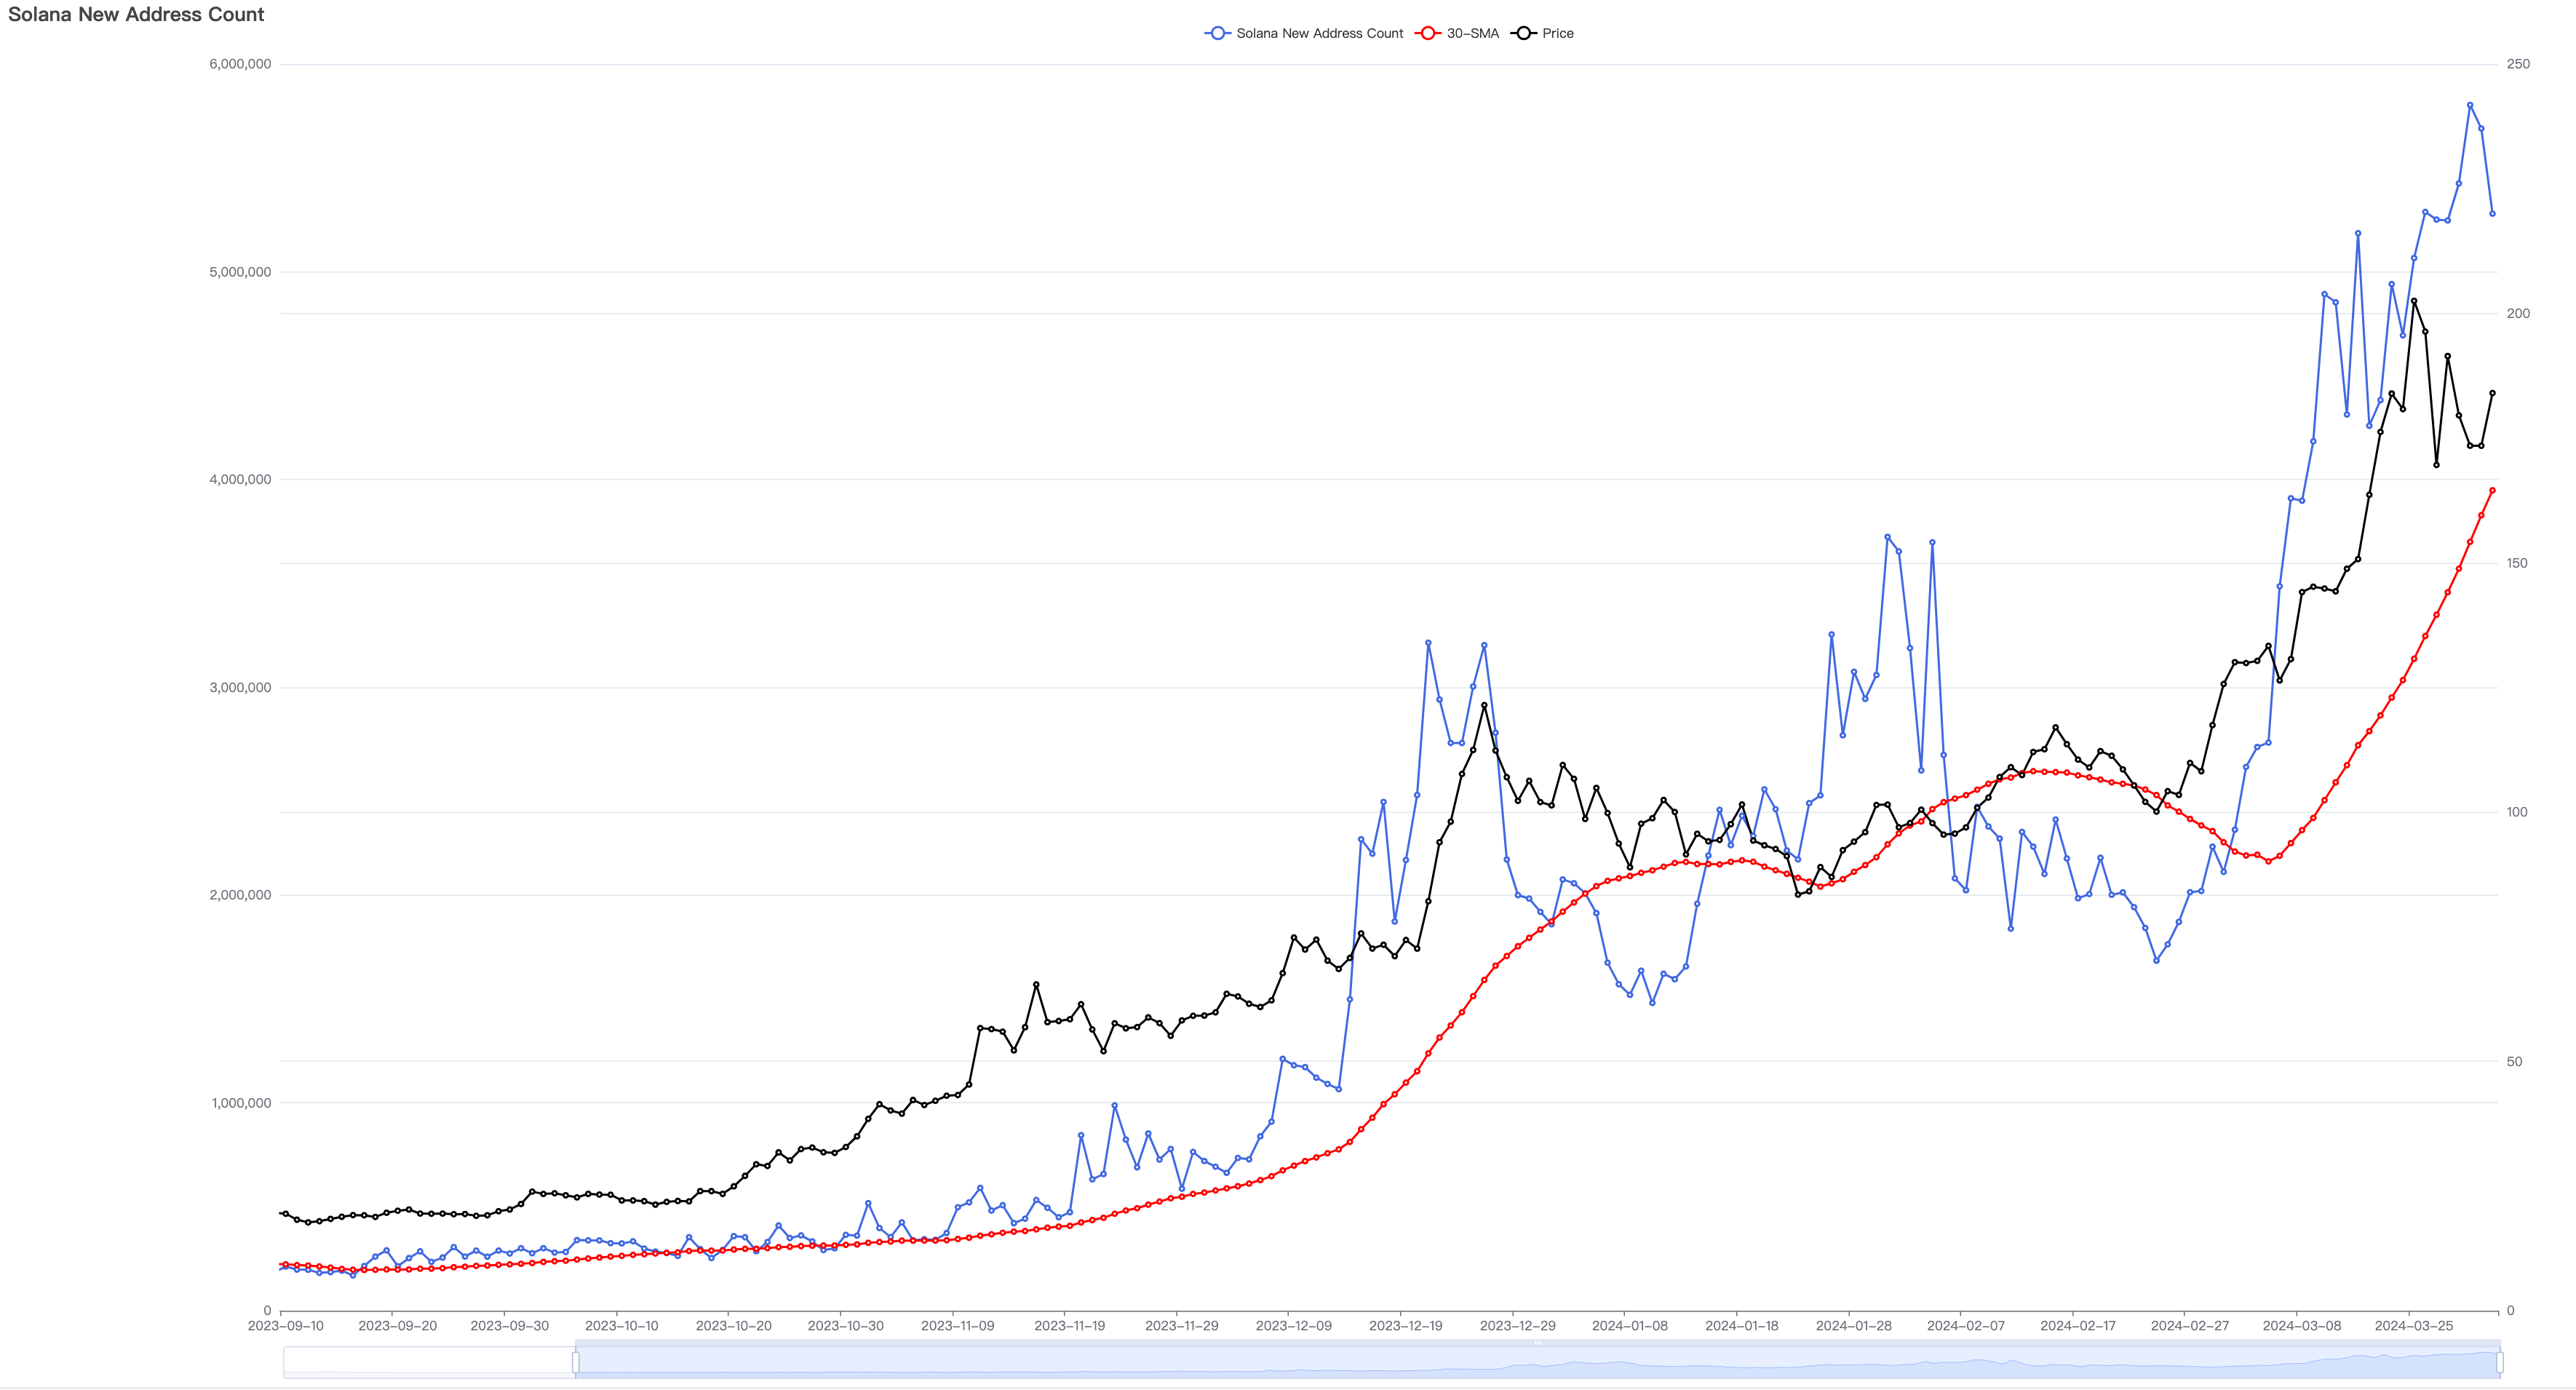
Solana Daily New Addresses
Solana’s daily active addresses show a trend consistent with new addresses.
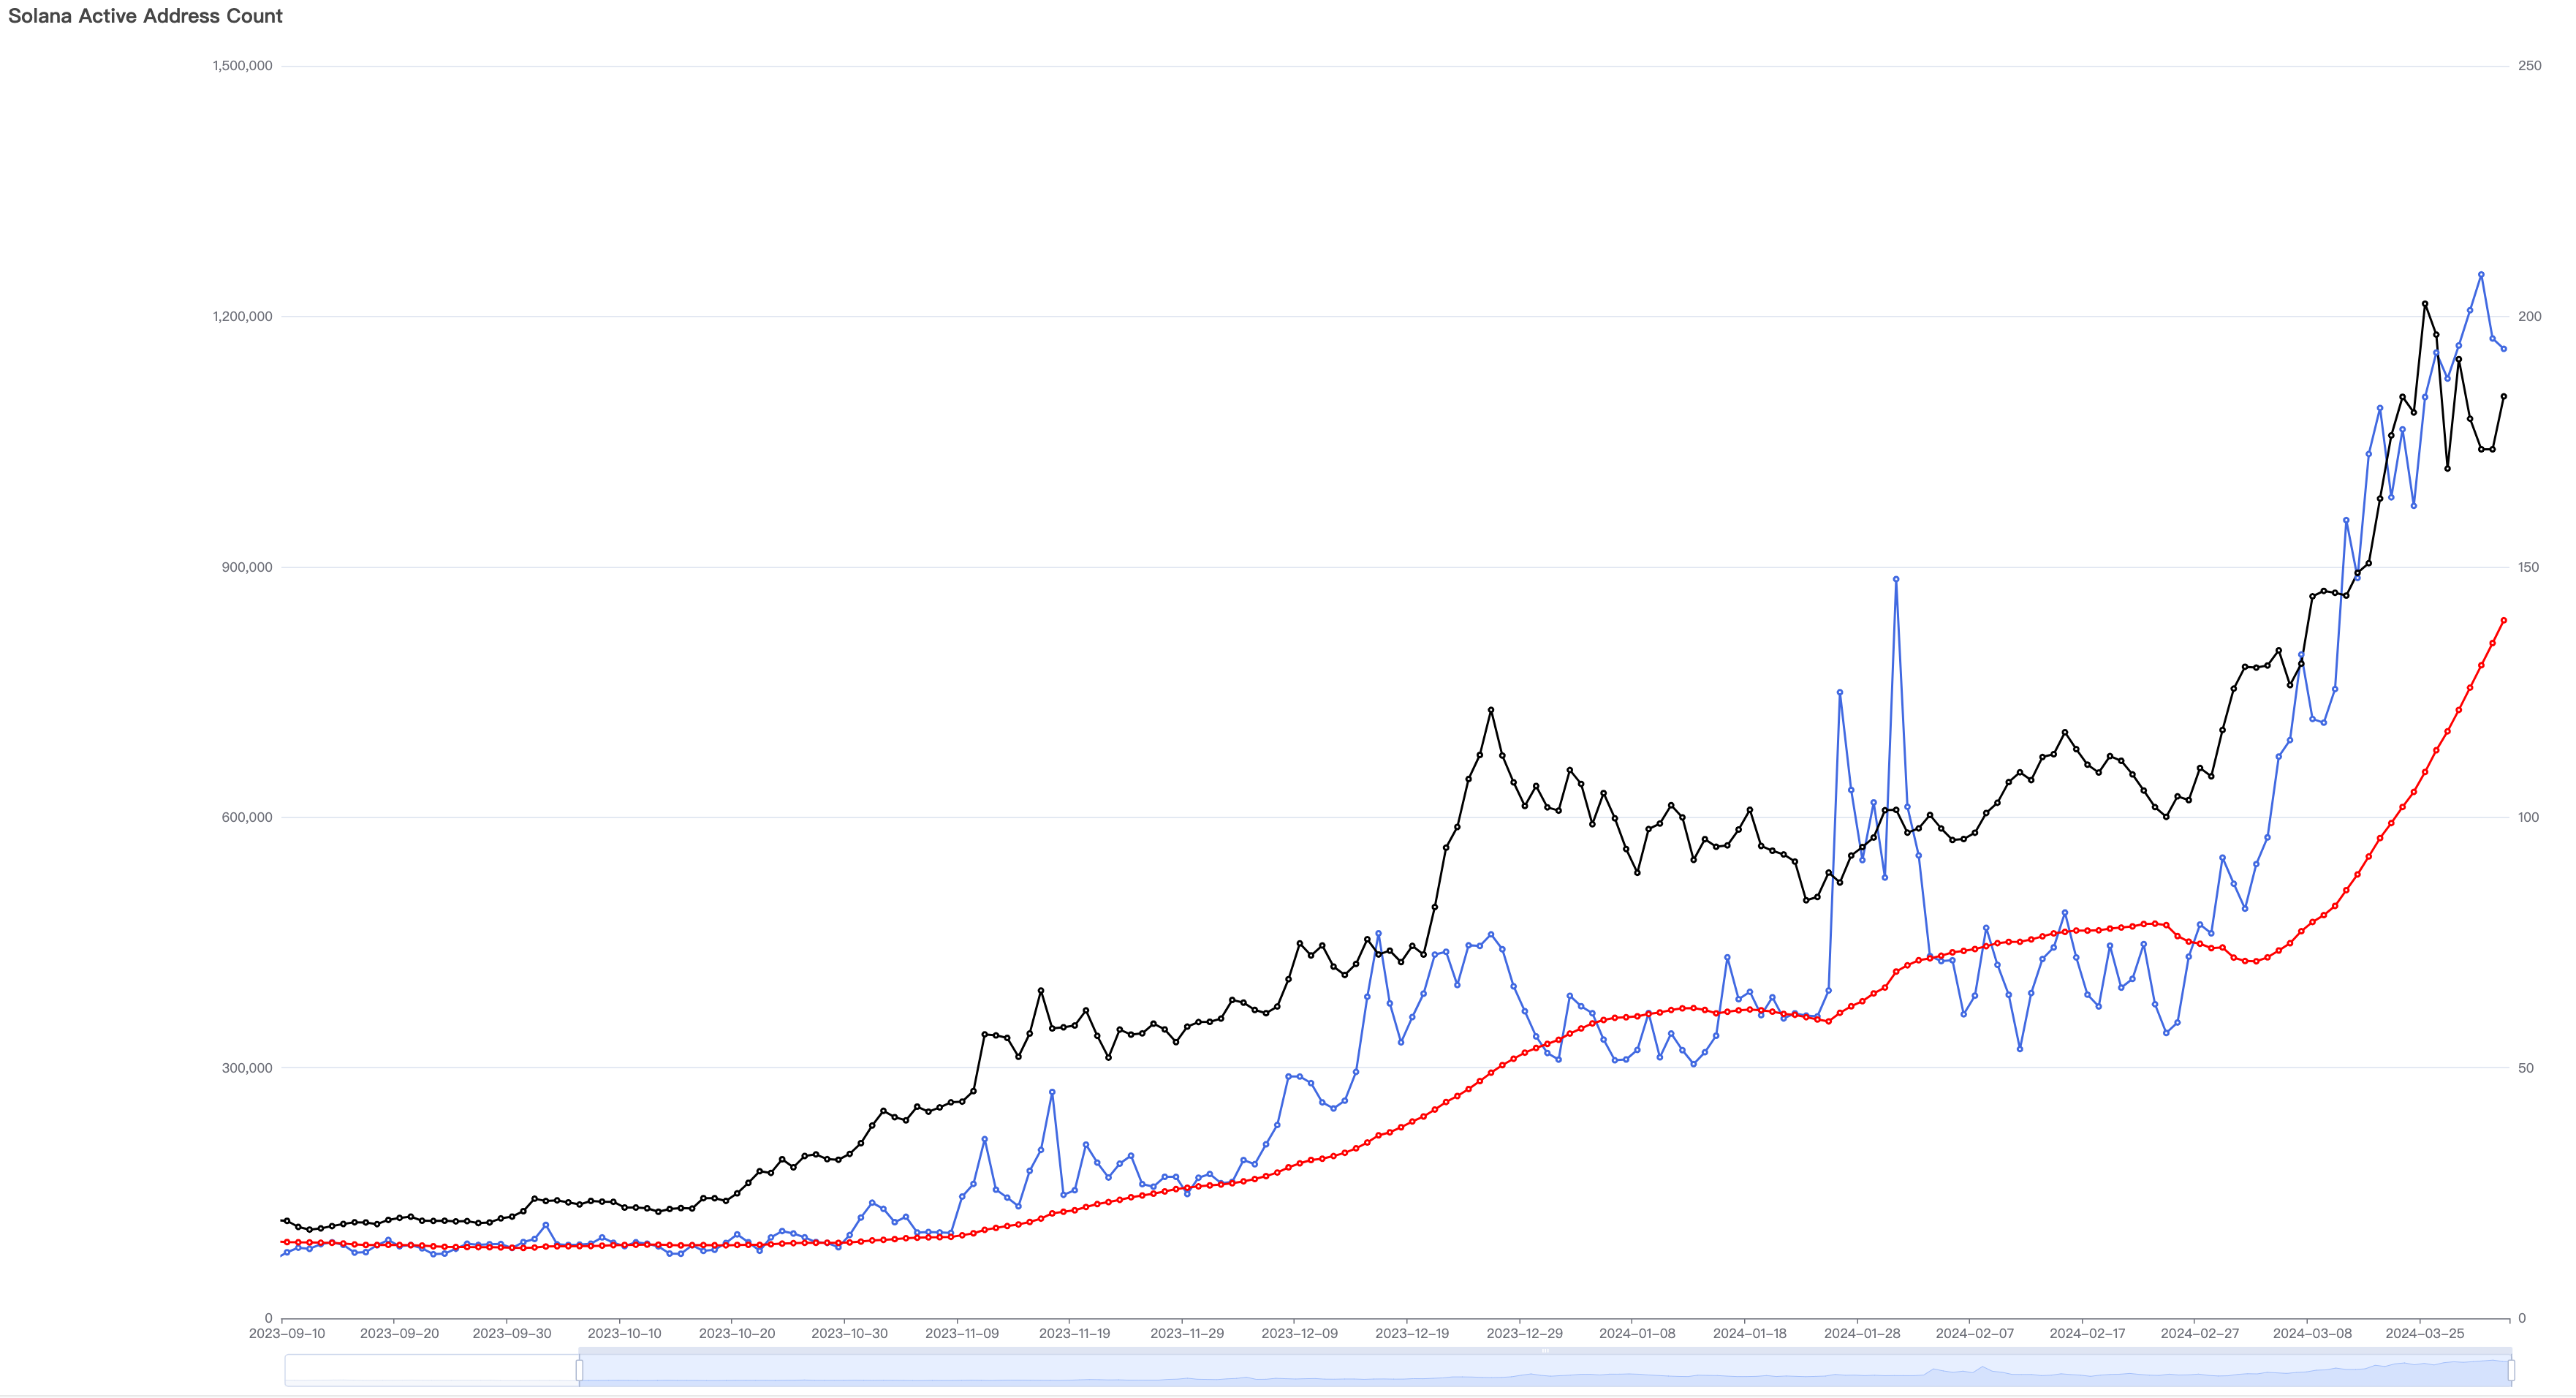
Solana Daily Active User Addresses
Unlike Ethereum, Solana is seen as a new carrier for DePIN and the backbone chain for USDC payment narratives.
However, this adoption is still far from mature. Currently, Solana’s primary use case remains meme coin launches and speculation. Phenomenal meme coins like Bonk, BOME, and WIF have emerged sequentially, with daily trading volumes reaching hundreds of millions of dollars. Thousands of short-lived meme coins are born and die weekly, yet speculators remain enthusiastic—over 1,000 new meme coins emerge daily.
Although Solana is making remarkable innovations in DePIN, DEX, staking, oracles, and RWA, its current wave of mass adoption is still meme-driven speculation—similar to Ethereum’s ICO frenzy in 2017.
This is concerning.
Capital Flows
In prior reports, EMC Labs repeatedly highlighted that the shift from stablecoin outflows to inflows in October 2023 was a structural turning point. This trend—a key external driver of the bull market—is cyclical and unlikely to reverse quickly.
In March, stablecoin channels saw a total inflow of $8.9 billion—the highest monthly inflow in this cycle. This inflow provided foundational support for BTC’s record-breaking price and served as one of the main absorbers of BTC sell-offs.
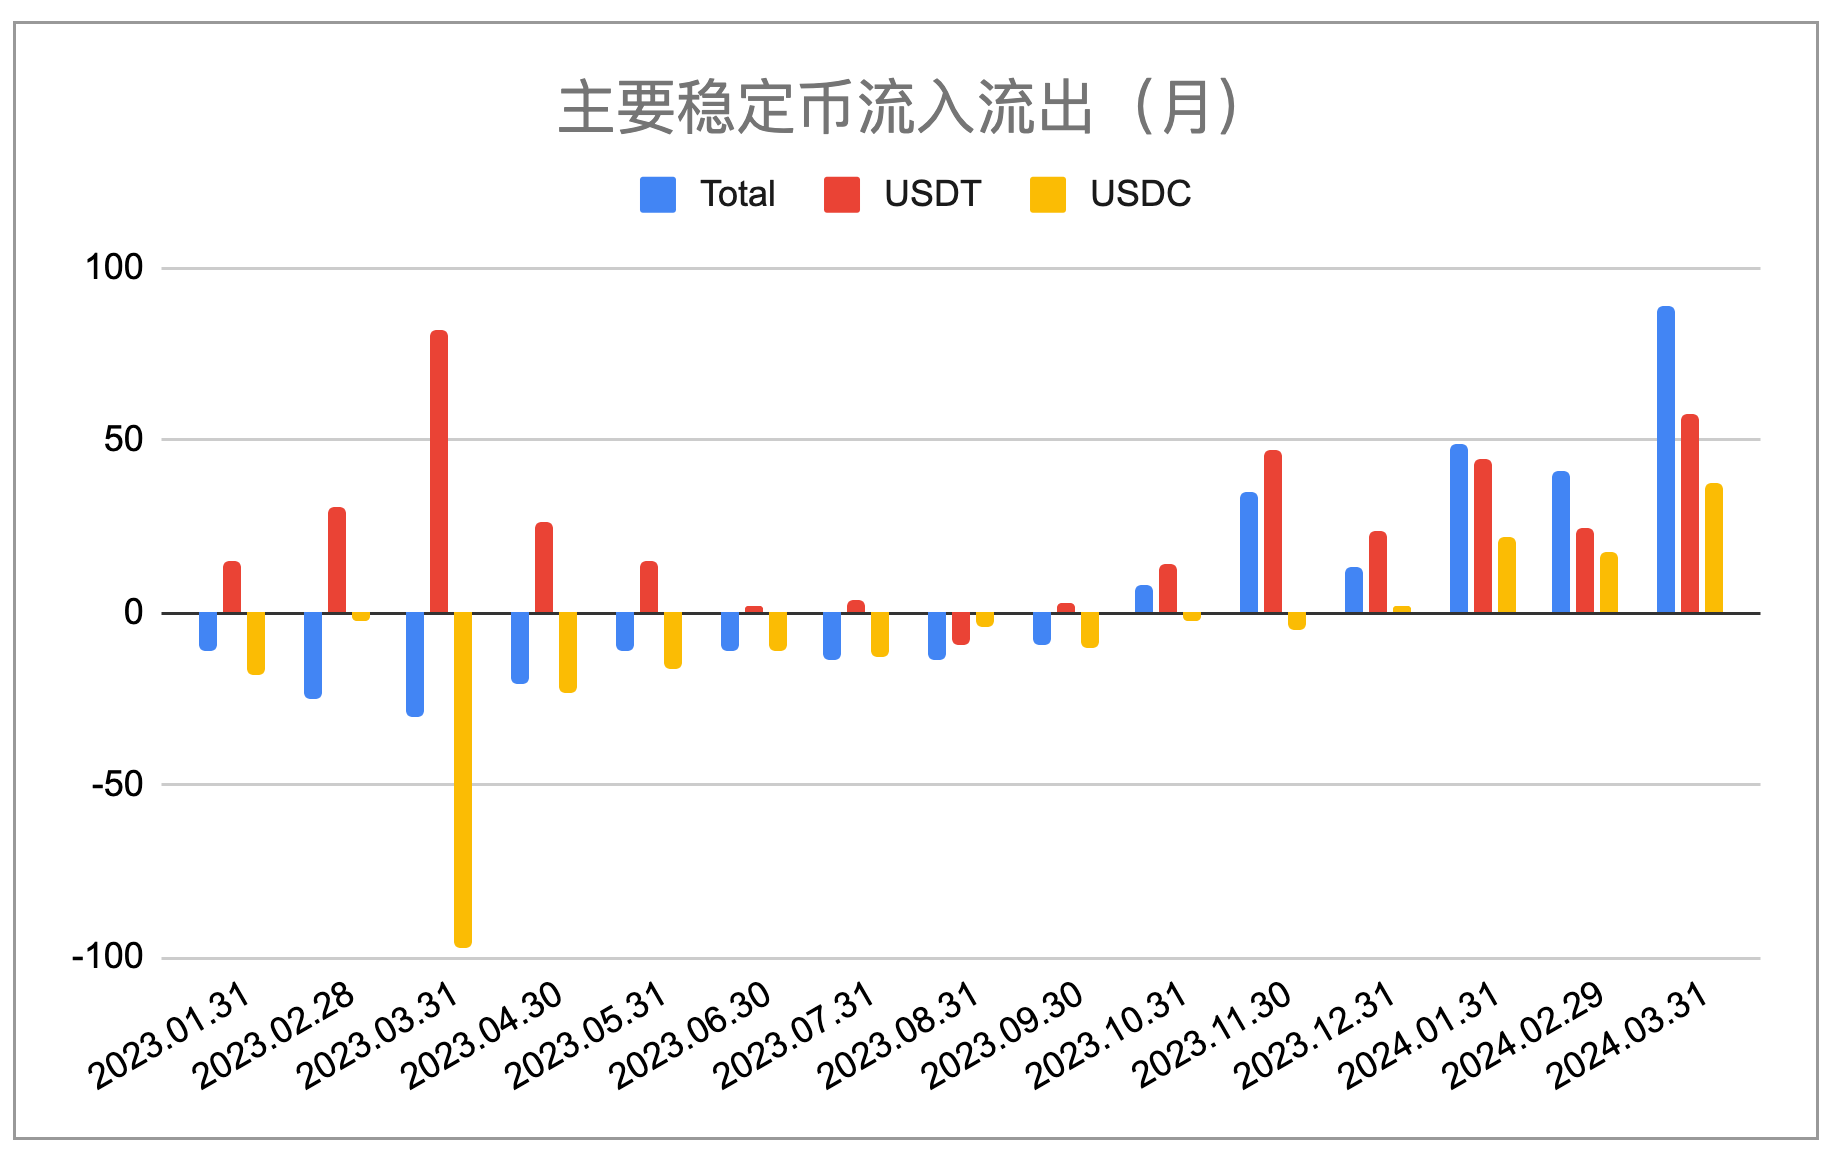
Stablecoin Supply Trend (EMC Labs Data)
Stablecoin circulation has not yet reached the previous bull market’s peak. Future inflow scale and speed require close attention.
Since the U.S. approved 11 BTC ETFs in January, this channel has become another key market influencer.
Data shows that BTC ETFs did not experience large outflows during this correction—only minor outflows were recorded from March 18 to 22.
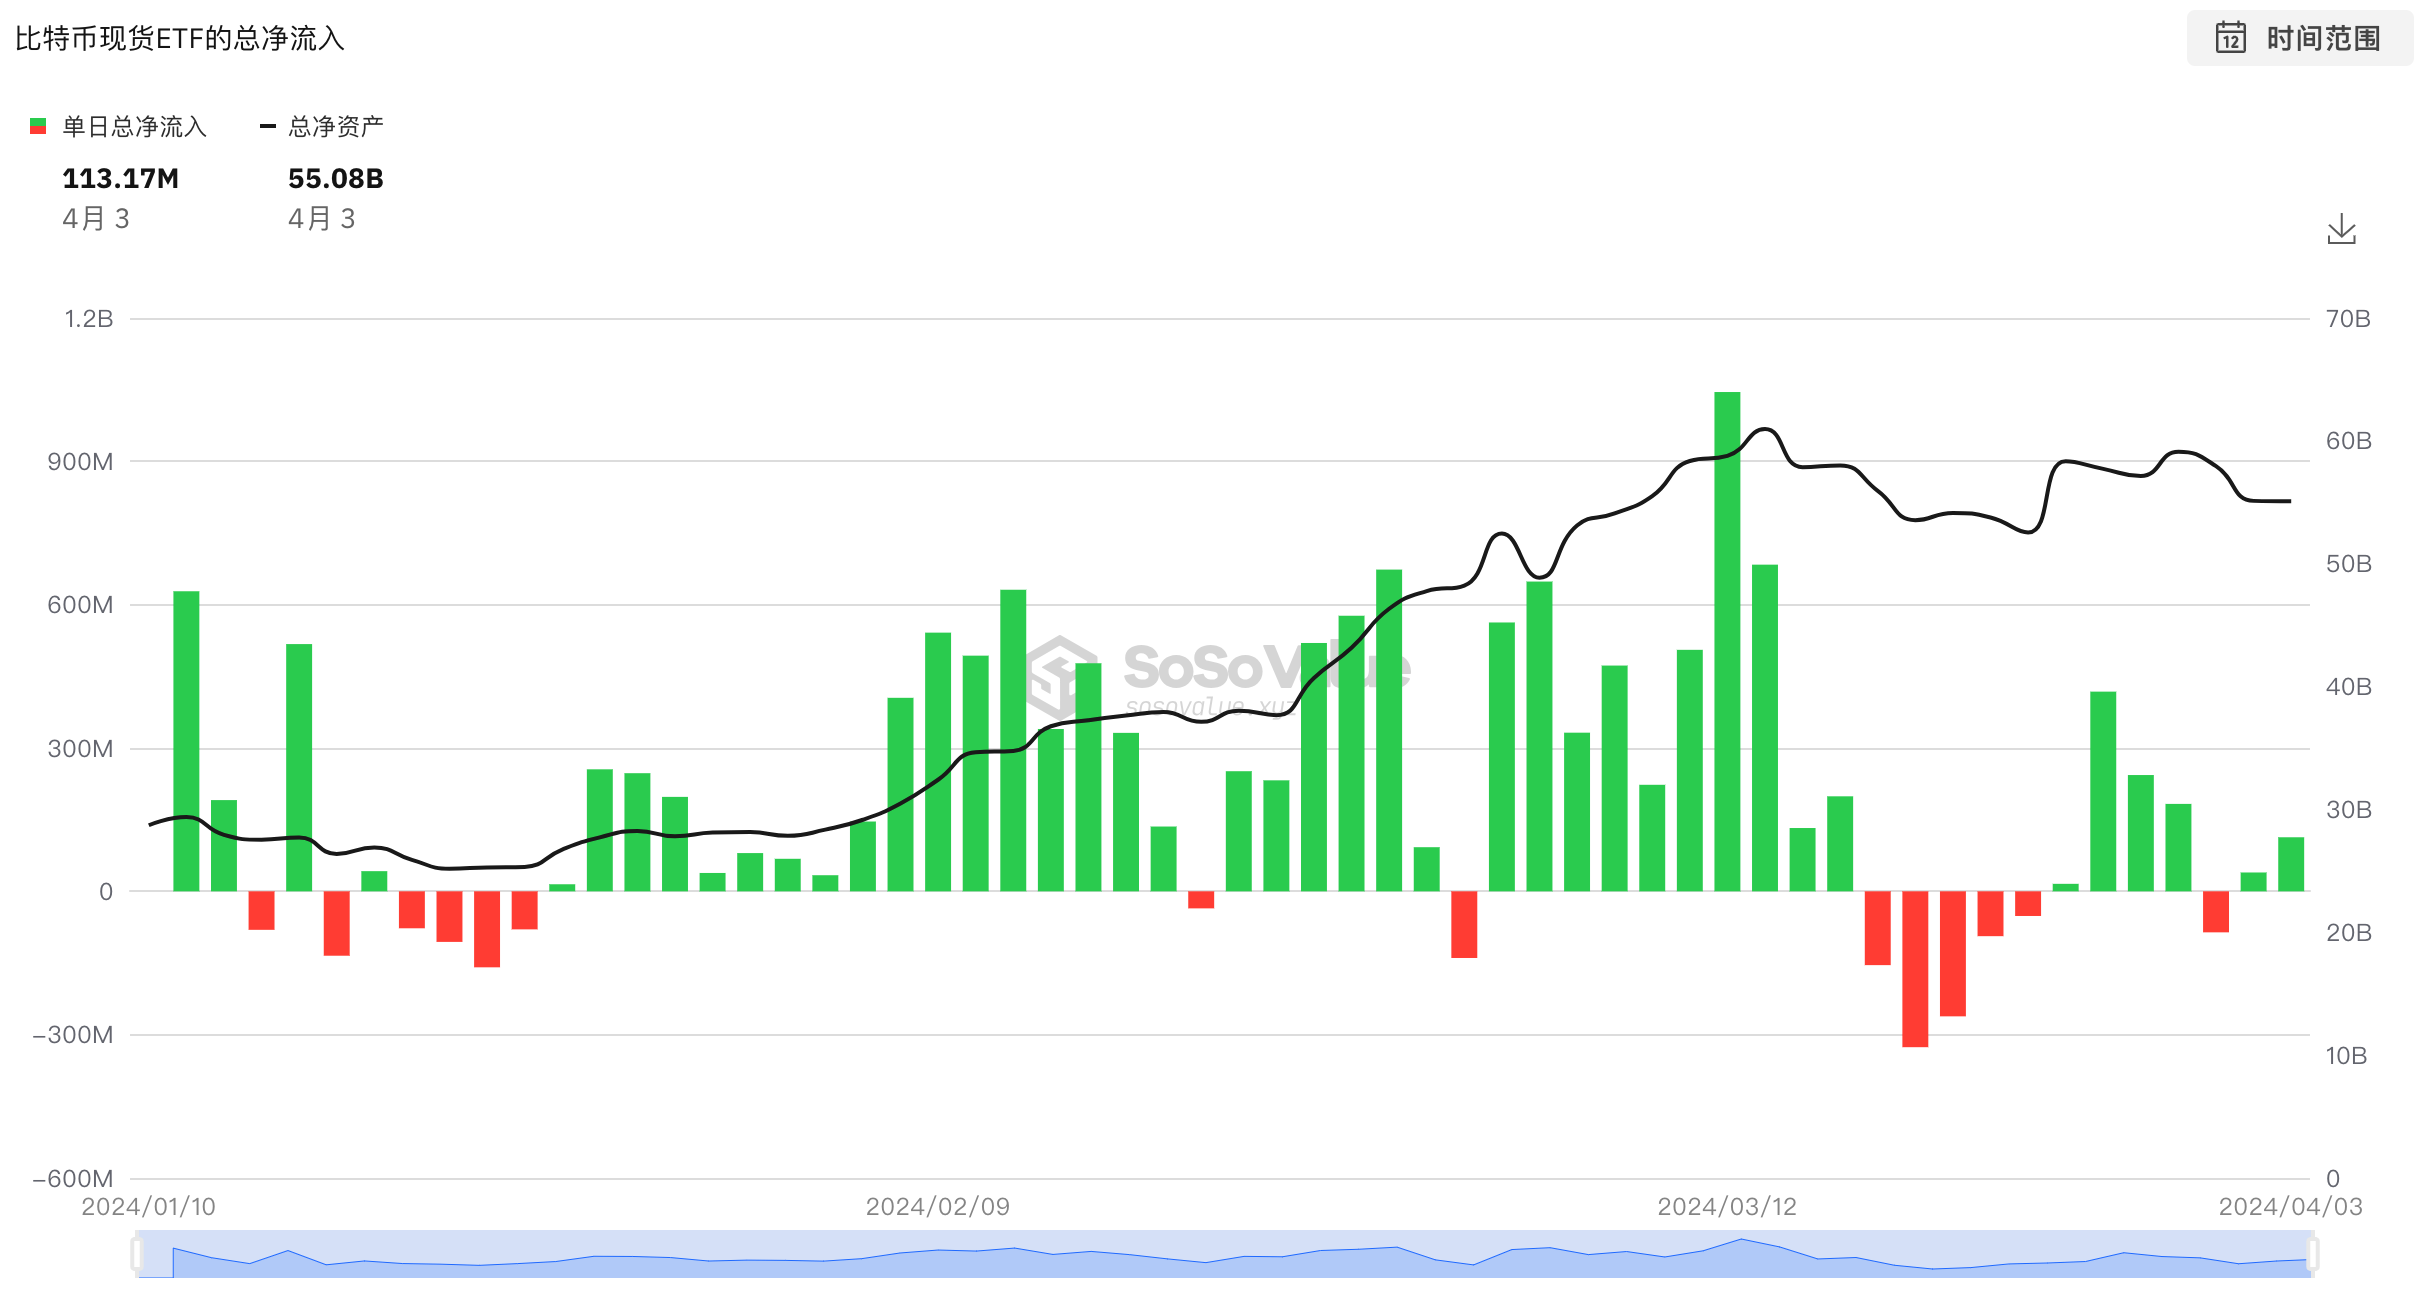
Inflow/Outflow of 11 BTC ETFs (SosoValue)
Based on ETF flow analysis, we conclude that only brief, limited de-risking occurred—around $1 billion. Compared to the $63.1 billion in locked-in profits, this is small and not the root cause of the correction.
Capital continues to flow into BTC ETFs—this remains a key support for BTC’s recovery and future new highs.
Growing capital supply directly drives price increases; sustained inflows directly fuel bull market launches.
Conclusion
In this report, we analyzed the first major sell-off by long-term holders and short-term profit-takers after BTC broke new highs.
This sell-off allowed sellers to lock in around $61 billion in profits, triggering a roughly 17% drop in BTC price.
Based on market structure, we judge this sell-off as normal during a bull run. Based on stablecoin and ETF inflows and application-chain adoption, we believe further volatility lies ahead—but this crypto bull market is unfolding orderly. Long-term investors should remain cautiously optimistic and actively bullish.
Join TechFlow official community to stay tuned
Telegram:https://t.me/TechFlowDaily
X (Twitter):https://x.com/TechFlowPost
X (Twitter) EN:https://x.com/BlockFlow_News


