
Coinbase: In-depth analysis of Bitcoin's price movement after this halving
TechFlow Selected TechFlow Selected
Coinbase: In-depth analysis of Bitcoin's price movement after this halving
The current price trend is just the beginning of a long-term bull market, and further price increases are needed to push supply-demand dynamics toward equilibrium.
 Navigating Web3 tides with focused insights
Authors: David Duong (Head of Institutional Research), David Han (Institutional Research Analyst)
Translation: DAOSquare

Quick Take
-
With Bitcoin’s fourth halving approaching, we believe studies of prior cycles should be interpreted cautiously due to a small sample size, making it difficult to generalize their patterns to the future.
-
The U.S. spot Bitcoin ETFs have also reshaped Bitcoin’s market dynamics by establishing a new anchor for BTC demand, making this cycle uniquely different.
-
We believe current price movements are only the beginning of a long-term bull market, and further price appreciation is needed before supply-demand dynamics reach equilibrium.
We are just over a month away from Bitcoin’s fourth halving. As with all previous halvings, it will cut miners’ block rewards in half—this time from 6.25 BTC per block to 3.125 BTC. While studying past halving cycles can offer some insight into Bitcoin’s potential price trajectory, we believe that three events constitute too small a sample to reliably establish a clear pattern or make definitive predictions about the impact of halvings.
Moreover, we believe Bitcoin’s market dynamics have fundamentally shifted with the emergence of U.S. spot BTC ETFs. Within just two months, these products have seen net inflows in the billions of dollars, irreversibly altering the landscape. With major institutional participants now able to invest through these instruments, Bitcoin’s reaction to this halving may not mirror its behavior in the prior three cycles. Instead, we believe understanding current technical supply-demand conditions is more important in assessing Bitcoin’s potential.
Indeed, while the constrained issuance of new Bitcoin is an important factor, it is only one among many. Since early 2020, the amount of Bitcoin available for trading—the difference between circulating and illiquid supply—has been declining, marking a significant shift from previous cycles. However, recent data shows that since the start of Q4 2023, active BTC supply (Bitcoin transferred within the last three months) has surged by 1.3 million BTC, far exceeding the roughly 150,000 newly mined coins during the same period. Although markets today are better equipped to absorb such supply, we still caution against oversimplifying the complex interplay between these market forces.
Background
Bitcoin miner rewards halve every 210,000 blocks mined—approximately every four years (the exact date depends on network hash rate, i.e., computational power used to process transactions and mine new blocks). This upcoming halving is expected between April 16 and 20 this year. It will reduce Bitcoin’s daily issuance from around 900 BTC (annual inflation of 1.8%) to approximately 450 BTC per day, cutting the annual issuance rate to 0.9%. Post-halving, monthly Bitcoin production will be around 13,500 BTC, with annual output estimated at roughly 164,250 BTC (exact figures depend on actual hash rate).
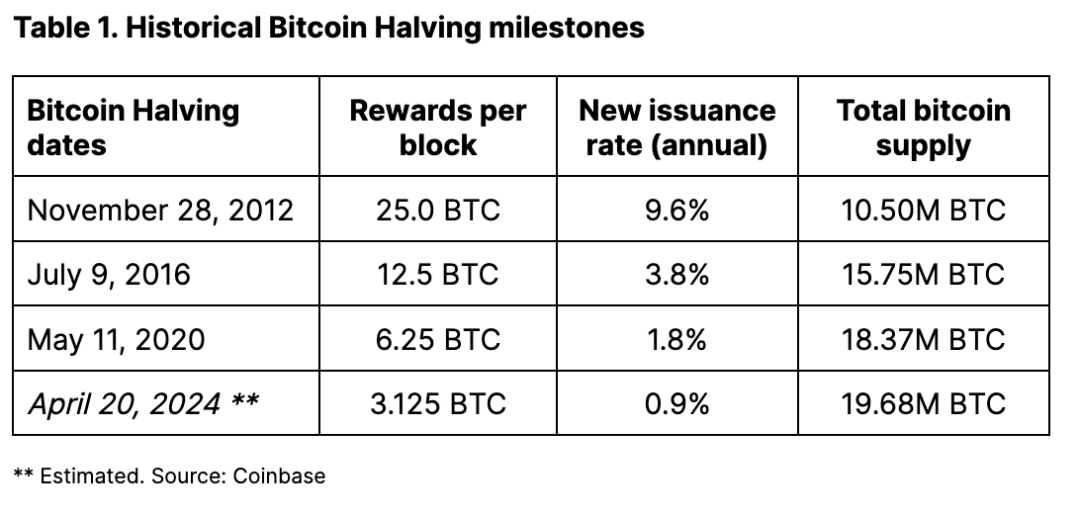
This halving mechanism will continue until all 21 million Bitcoins are mined—projected to occur around the year 2140. We believe the halving’s underlying significance lies in reinforcing awareness of Bitcoin’s unique characteristic: a fixed, deflationary supply schedule culminating in a hard supply cap.
This point is often underestimated. For physical commodities like minerals, more resources can theoretically be allocated to extract additional supplies—such as gold or copper—even if the barriers are high. Rising prices help meet increased demand. But due to its preset block rewards and difficulty adjustment mechanism, Bitcoin’s supply is inelastic (i.e., insensitive to price changes). Moreover, Bitcoin tells a growth story: network utility increases with the number of users, directly influencing token value. In contrast, owning precious metals like gold does not carry similar growth expectations.
History Doesn’t Repeat, But…
Analyzing the impact of halving cycles on Bitcoin’s performance is inherently limited—we only have three historical halvings to study. Therefore, research into correlations between past halvings and Bitcoin prices should be interpreted cautiously due to the small sample size, making it difficult to generalize patterns solely from historical analysis. In fact, we believe multiple additional halving cycles are needed before drawing stronger conclusions about how Bitcoin “typically” reacts. Furthermore, correlation does not imply causation; factors such as market sentiment, adoption trends, and macroeconomic conditions can all drive price volatility.
Indeed, we previously argued that Bitcoin’s performance around past halvings likely depended heavily on context. This may explain the wide variation in price trajectories across cycles. As shown in Figure 1, Bitcoin’s price was relatively flat during the 60 days preceding the first halving in November 2012. In contrast, prices rose 45% and 73% respectively in the 60 days leading up to the second and third halvings in July 2016 and May 2020.
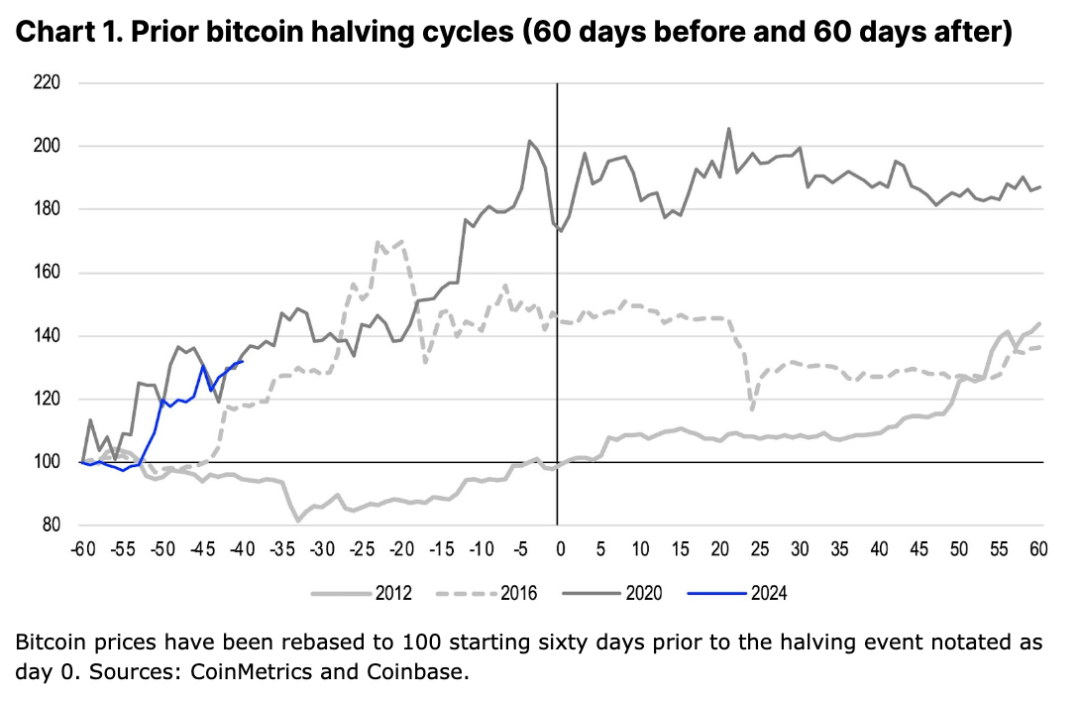
In our view, the positive impact of the first halving only became apparent in January 2013, when the effects of the Fed’s QE3 program intertwined with concerns over the U.S. debt ceiling crisis. Thus, we believe increased media coverage of the halving may have heightened awareness of Bitcoin as an alternative store of value amid broader inflation fears. In 2016, Brexit may have triggered fiscal anxieties in the UK and Europe, potentially catalyzing Bitcoin purchases. That trend continued into the 2017 ICO boom. Then in early 2020, unprecedented stimulus measures by global central banks and governments in response to the COVID-19 pandemic drove another surge in Bitcoin liquidity.
It’s also important to note that analyses of historical performance can vary significantly depending on the observation window relative to the halving event. Price return metrics may differ based on whether the analysis covers periods starting (and ending) 30, 60, 90, or 120 days from the halving date. Consequently, using different windows can influence conclusions drawn from past price behavior. For our purposes, we use a 60-day window, as it helps filter out short-term noise without extending so far that other market factors may begin to dominate price drivers over the longer term.
ETFs: The Secret Is in the Start
U.S. spot Bitcoin ETFs are reshaping Bitcoin’s market dynamics by creating a new anchor for demand. In prior cycles, liquidity constraints were a key limiting factor for price momentum, as major market participants—including but not limited to Bitcoin miners—tended to trigger sell-offs when exiting long positions.
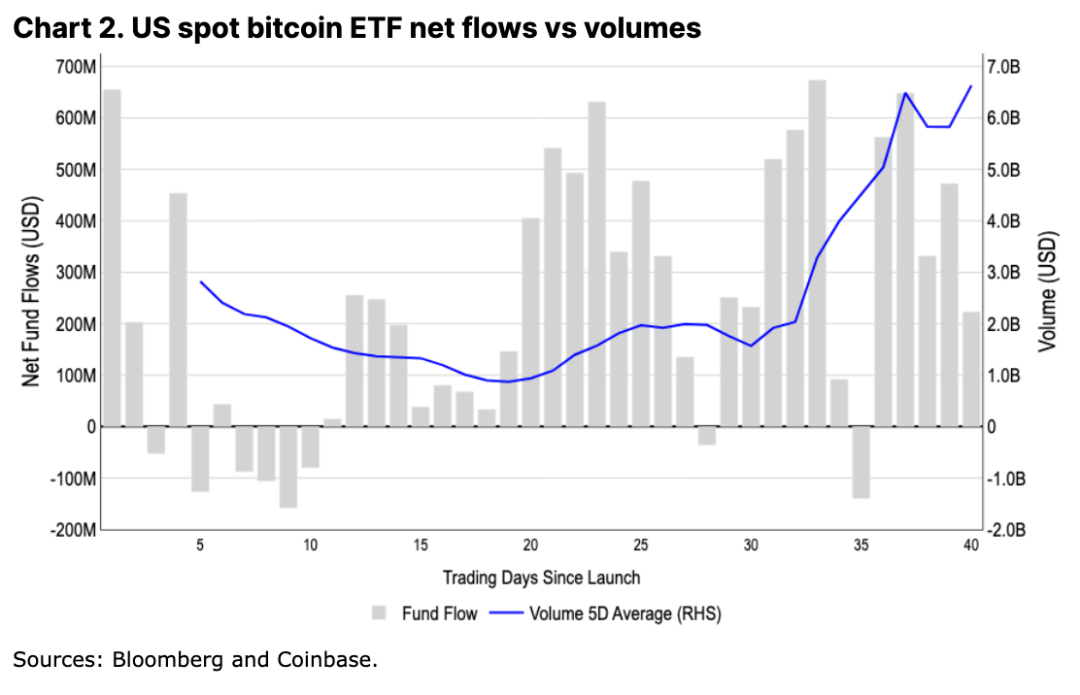
Today, ETF inflows are positioned to absorb much of the supply in a gradual, sustained manner. Indeed, ETFs now account for approximately $4–5 billion in daily spot BTC trading volume, representing 15–20% of total centralized exchange volume globally—providing sufficient liquidity for institutions to actively trade in this space. Over time, this stable demand environment could positively influence Bitcoin’s price by fostering a more balanced market with reduced volatility from concentrated sell-offs.
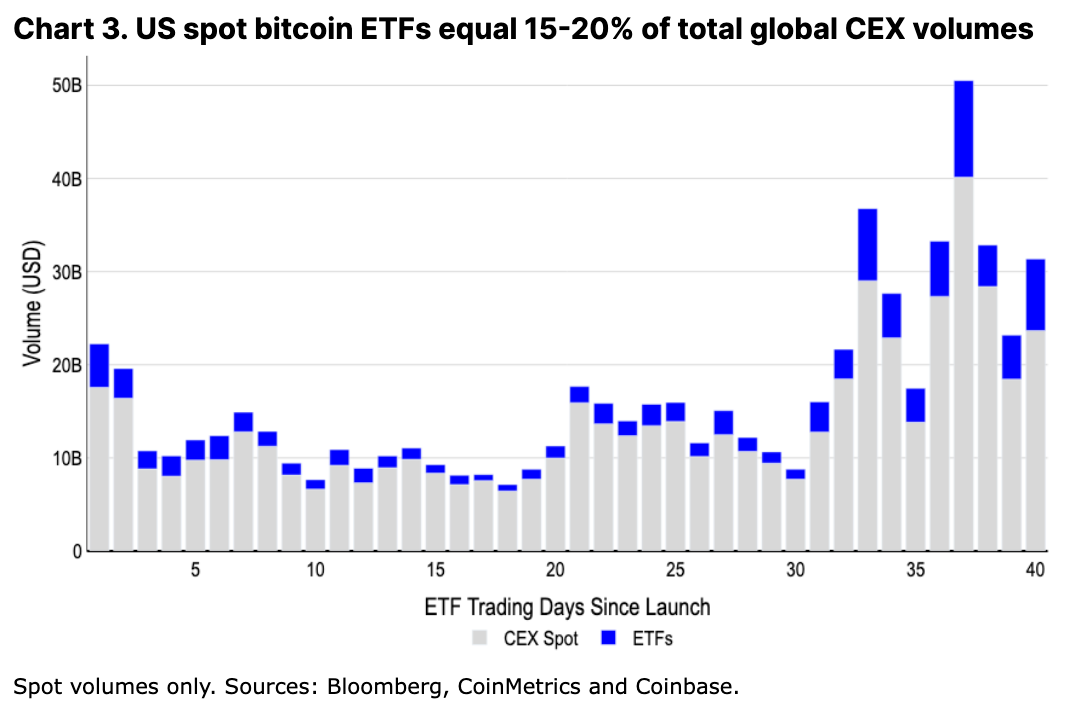
U.S. spot Bitcoin ETFs have already attracted $9.6 billion in net inflows during their first two months, managing a total of $55 billion in assets under management. This means that during this period, the cumulative net increase in BTC held by these ETFs (180,000 BTC) was nearly three times greater than the 55,000 newly mined Bitcoin supply (see Figure 3). According to Bloomberg, if we include all global spot Bitcoin ETFs, these regulated investment vehicles currently hold approximately 1.1 million BTC—about 5.8% of total circulating supply.
Looking ahead, ETFs may sustain or even increase current liquidity levels, especially as large broker-dealers have yet to fully roll out these products to clients. With over $6 trillion still parked in U.S. money market funds and anticipated interest rate cuts on the horizon, we believe there is substantial idle capital ready to enter this asset class—potentially within this year alone.
As an aside, note that the potential centralization risk from ETF-held Bitcoin does not pose a stability threat to the network, as merely holding Bitcoin confers no control over the decentralized network or its nodes. Additionally, financial institutions currently cannot offer derivatives based on these ETFs (as underlying assets). Once available, such derivatives could alter market structures for large participants—but regulatory approval is conservatively expected to take several more months.
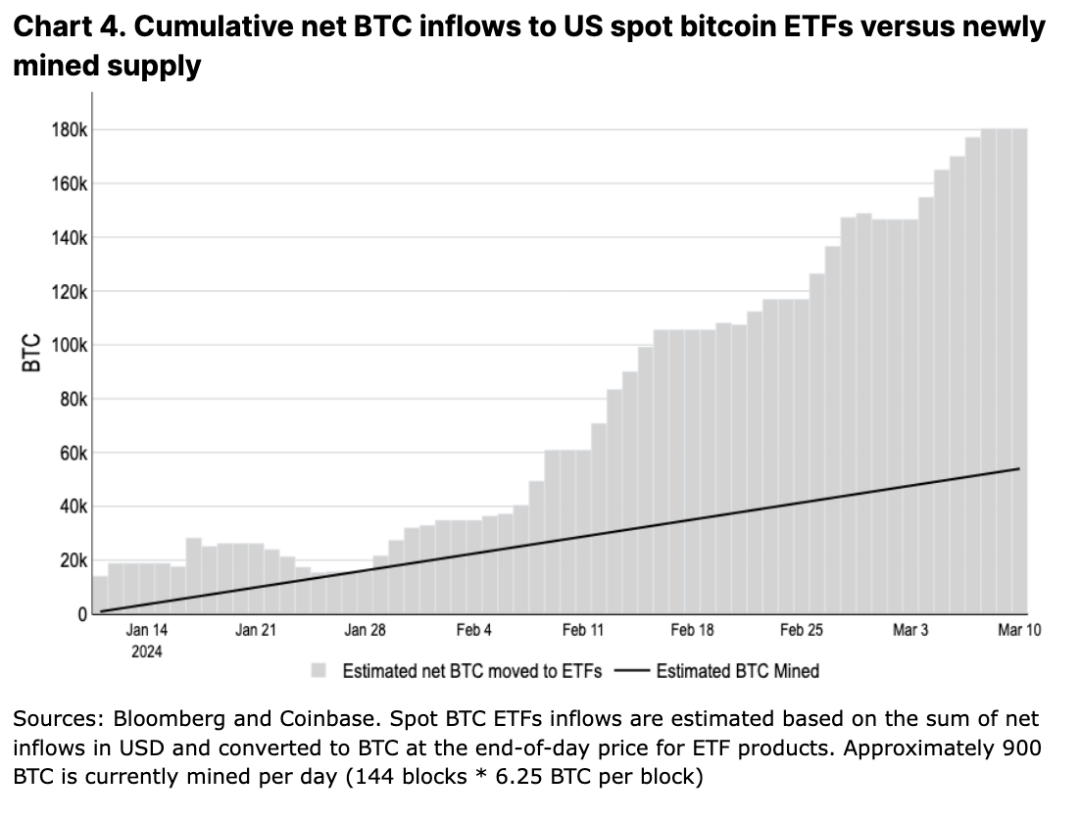
Hypothetically, if we assume new inflows into U.S.-based ETFs slow from February’s $6 billion pace to a steady state of $1 billion per month, a simple mental model suggests Bitcoin’s average price should approach around $74,000—relative to the post-halving monthly mining output of approximately 13,500 BTC. Of course, a clear limitation of this model is that miners are not the only source of Bitcoin supply on the market. In reality, we believe the imbalance between newly mined Bitcoin and ETF inflows represents only a fraction of the broader cyclical supply trends.
Lies, Damned Lies, and Statistics
One way to measure Bitcoin supply available for trading is to subtract illiquid supply—Bitcoin effectively removed from circulation due to lost wallets, long-term holding, or other lockups—from total circulating supply (19.65 million BTC). According to Glassnode data, which categorizes illiquid supply based on cumulative inflows and outflows within an entity’s lifecycle, available Bitcoin supply has been on a downward trend over the past four years—falling from a peak of 5.3 million BTC in early 2020 to around 4.6 million today. This marks a stark reversal from the steadily rising available supply observed during the prior three halving cycles (see Figure 5).
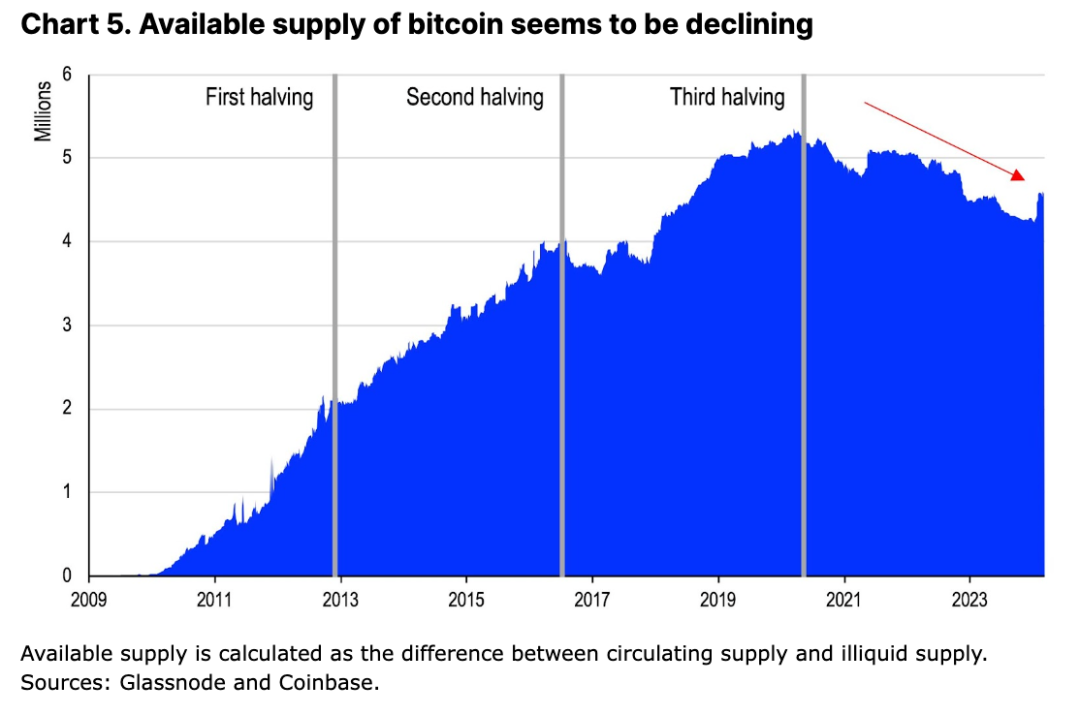
At first glance, the declining availability of tradable Bitcoin appears to be one of the key technical supports for Bitcoin’s performance, especially given new institutional demand via ETFs. Yet, considering the imminent reduction in newly mined supply, these supply-demand dynamics suggest a high likelihood of near-term market tightness. That said, we believe this framework fails to fully capture the complexity of Bitcoin’s liquidity dynamics—particularly because “illiquid supply” does not equate to static supply.
Investors should not overlook several critical factors that could influence selling pressure:
-
Not all Bitcoin in illiquid supply is permanently “locked.” While long-term holders (those holding BTC for over 155 days, accounting for 83.5% of holdings) may exhibit lower economic sensitivity to price compared to short-term holders, we expect some within this group may still realize profits during price rallies.
-
Some holders may not intend to sell soon but could still provide liquidity by using Bitcoin as collateral. This partially undermines the “illiquidity” label.
-
Miners may sell from their reserves (currently totaling 1.8 million BTC across public and private miners) to fund expansion or cover operational costs.
-
The ~3 million BTC held by short-term holders is non-trivial; speculators may still exit profitably amid price fluctuations.
Ignoring these meaningful supply sources oversimplifies the narrative of inevitable scarcity driven by reduced mining rewards and steady ETF demand. In our view, a more comprehensive assessment is required to understand the true supply-demand dynamics behind the upcoming halving.
Active Supply and Flow
Even as Bitcoin becomes embedded in ETFs, the growth rate of active circulating supply (defined as Bitcoin transferred within the past three months) has significantly outpaced cumulative ETF inflows (see Figure 6). Since the start of Q4 2023, active BTC supply has grown by 1.3 million, while only about 150,000 new bitcoins were mined.
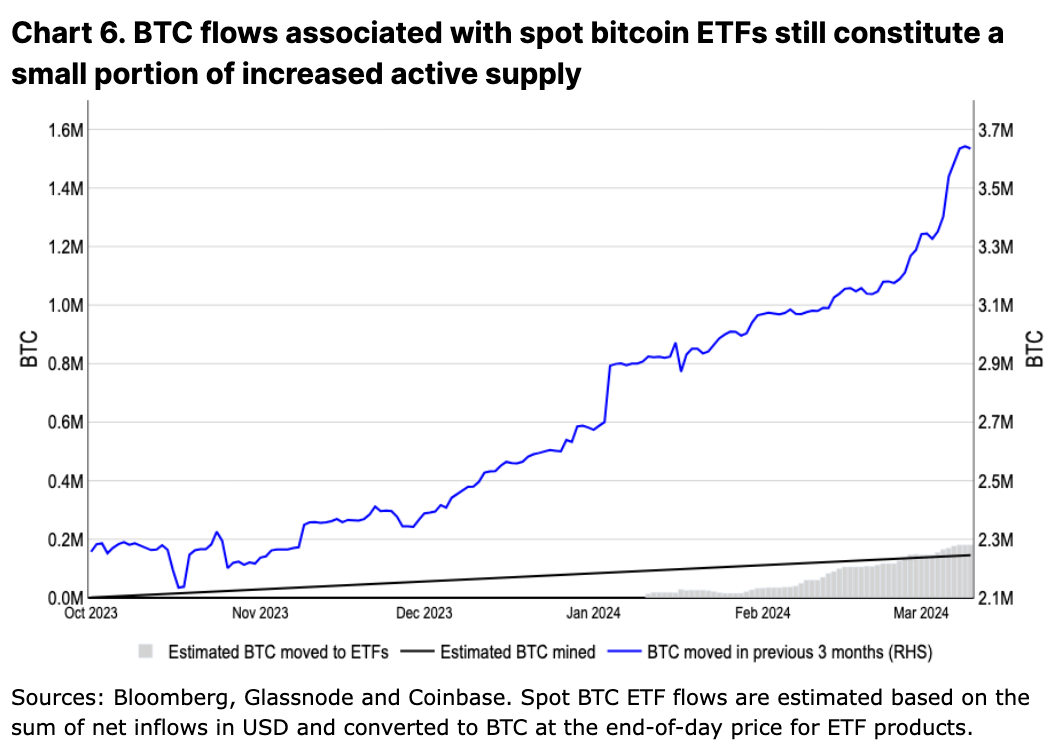
A portion of this active supply indeed comes from miners themselves, who may be selling reserves—to capitalize on price moves and build liquidity amid declining revenues. We discussed this in greater detail in our January 30 report, “Bitcoin Halving and Miner Economics.” This mirrors behavior seen in prior cycles. However, Glassnode reports that miner wallet net balances decreased by only 20,471 BTC between October 1, 2023, and March 11, 2024—indicating that most of the newly active supply originated elsewhere.
In previous cycles, increases in active supply exceeded new mining output by more than fivefold. During the 2017 and 2021 bull runs, active supply nearly doubled—rising from lows of 2.9 million to 6.1 million BTC (+3.2 million) over 11 months in 2017, and from 3.1 million to 5.4 million BTC (+2.3 million) over 7 months in 2021. By comparison, newly mined Bitcoin during those periods totaled approximately 600,000 and 200,000 BTC, respectively.
Meanwhile, in this cycle, Bitcoin’s inactive supply (defined as BTC untouched for over a year) has declined for three consecutive months—possibly indicating long-term holders are beginning to sell (see Figure 7). Normally, this would signal a mid-cycle phase. In both the 2017 and 2021 cycles, it took about 12 and 13 months, respectively, from the peak of inactive supply to reach the cycle’s price top. Current inactive BTC appears to have peaked in December 2023.
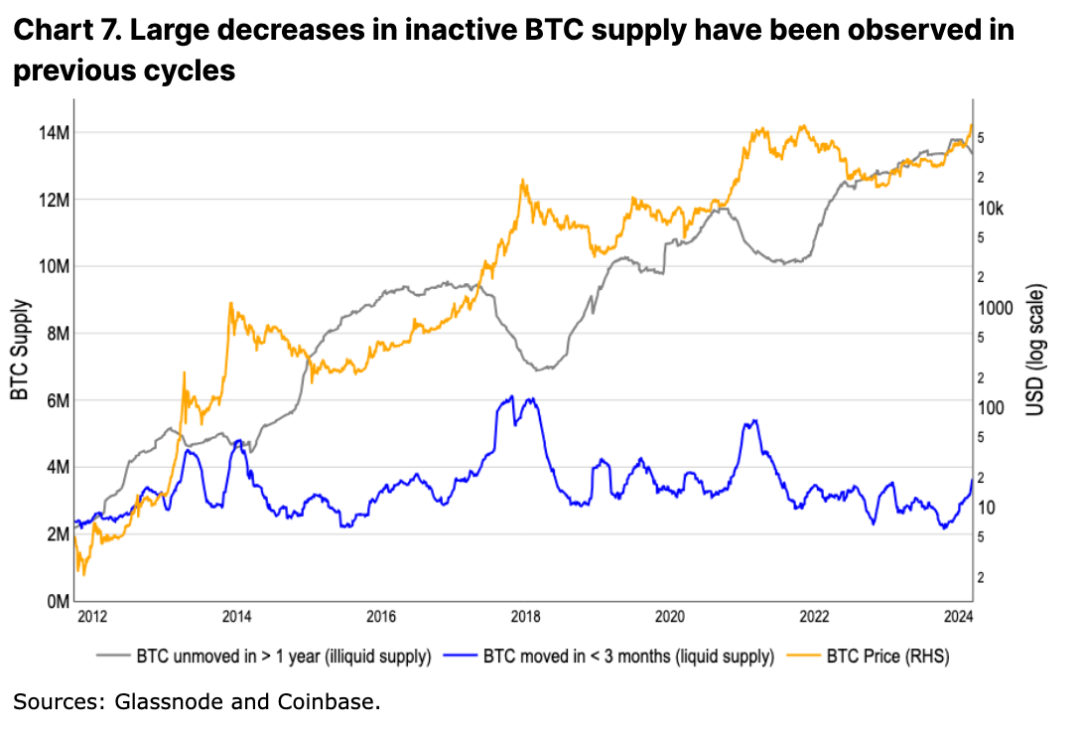
However, it remains unclear how much of this Bitcoin has been transferred to exchanges (for sale), locked into cross-chain bridges, or otherwise deployed in financial transactions (e.g., OTC deals). According to Glassnode, although Bitcoin transfers to exchanges have doubled this year, exchange balances have actually declined by 80,000 BTC net. This suggests other pools—beyond ETFs—are helping offset inflows from long- and short-term holders to exchanges.
In fact, spot market supply-demand dynamics only tell part of the capital flow story. Bitcoin exhibits a commodity-like derivatives multiplier effect, where the notional value of outstanding Bitcoin derivatives far exceeds the market cap of physical Bitcoin. Given that Bitcoin’s derivatives market amplifies spot volumes many times over, analyzing only public spot exchange data fails to reflect the full picture of liquidity and adoption within the Bitcoin economy.
Therefore, while increased activity from “dormant” Bitcoin aligns with prior bull market peaks, we believe the precise nature of how supply and demand interact in the current environment remains uncertain.
Conclusion
This cycle may indeed be different. Sustained daily net inflows into U.S. spot Bitcoin ETFs represent a powerful tailwind for the asset class. Combined with the impending halving of newly mined supply, market dynamics are poised to tighten further. However, this does not necessarily mean we are entering an immediate supply-constrained environment where demand clearly overwhelms selling pressure. What is clear, however, is that spot Bitcoin ETFs have formally established a new digital asset category, enabling mainstream financial institutions to integrate Bitcoin into traditional portfolios—a pivotal milestone in Bitcoin’s path toward mainstream adoption. Therefore, we believe current price action marks only the beginning of a long-term bull market, and further price gains are required to bring supply-demand dynamics into balance.
Join TechFlow official community to stay tuned
Telegram:https://t.me/TechFlowDaily
X (Twitter):https://x.com/TechFlowPost
X (Twitter) EN:https://x.com/BlockFlow_News