2023 Bitcoin Annual Report: Price Rises 158%, Mining Industry Generates Over $9.8 Billion in Total Revenue
TechFlow Selected TechFlow Selected
2023 Bitcoin Annual Report: Price Rises 158%, Mining Industry Generates Over $9.8 Billion in Total Revenue
This article will provide a comprehensive review of Bitcoin's data changes this year across four major aspects: trading markets, on-chain fundamentals, mining, and applicability.
 Navigating Web3 tides with focused insights
Author: Carol, PANews
“Recovery” and “renewal” are the two key themes for Bitcoin in 2023. On one hand, amid consecutive interest rate hikes by the Federal Reserve, tightening global fiscal policies, and escalating geopolitical tensions, Bitcoin reversed its downward trend from the previous year and entered a steady upward channel. On the other hand, the rapid development of the Ordinals protocol has brought BRC-20 inscriptions into the spotlight, injecting new vitality into Bitcoin's ecosystem and the broader industry.
Behind this evolving landscape, what exactly has driven Bitcoin’s micro-level developments in 2023? And what progress can we expect next year? PAData comprehensively reviews Bitcoin’s data changes across four major areas—trading markets, on-chain fundamentals, mining, and application development.
TLDR;
Trading Market
-
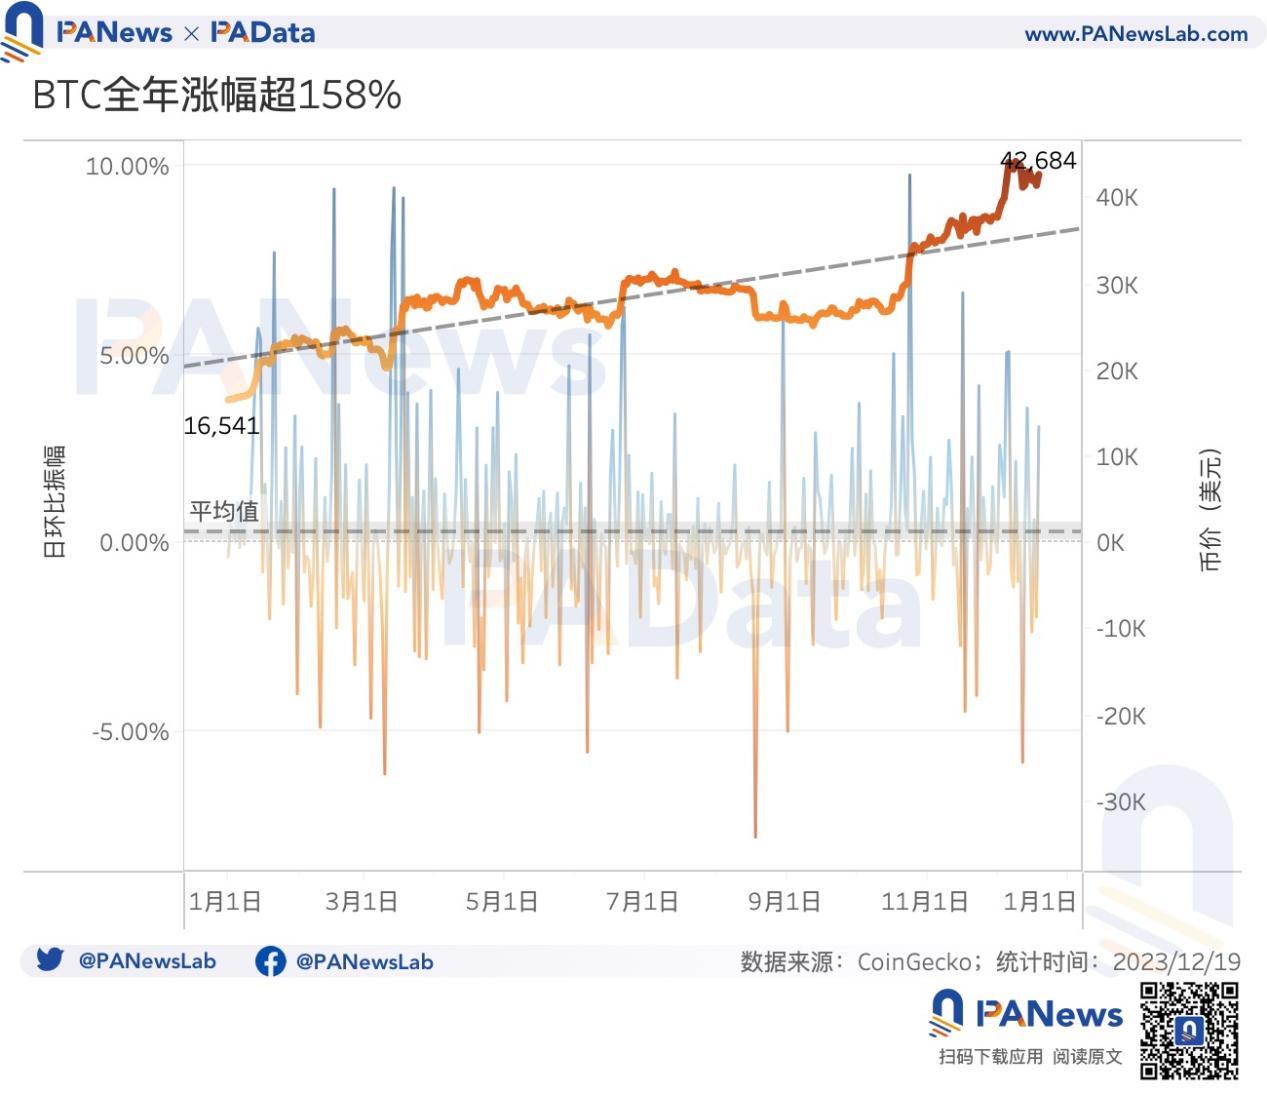
In 2023, Bitcoin largely recovered from last year’s downturn, with its price rising above $42,000 and achieving an annual gain of 158.06%. The upward trend was clear and sustained throughout the year.
-
Historical data shows that halving events typically coincide with price increases. Bitcoin will undergo its fourth halving on April 19, 2024, potentially fueling further price growth next year.
-
87.76% of Bitcoin holdings are currently in profit, with long-term holders outperforming short-term ones. Overall profitability this year is significantly better than last year.
-
Bitcoin’s price movements showed little statistical correlation with the Dow Jones Industrial Average or the U.S. Dollar Index overall this year. However, partial periods revealed mild positive correlation with the Dow and mild negative correlation with the dollar index.
On-Chain Fundamentals
-
Monthly average active addresses were approximately 948,700, up 3.51% year-on-year.
-
Small-balance holdings among retail users continued accelerating toward smaller denominations, while holding periods shifted from polarization to longer-term accumulation. Addresses holding between 0.001 and 1 BTC accounted for 97.24% of all addresses. The proportion of coins held for 2–3 years increased by 6.7 percentage points during the year.
-
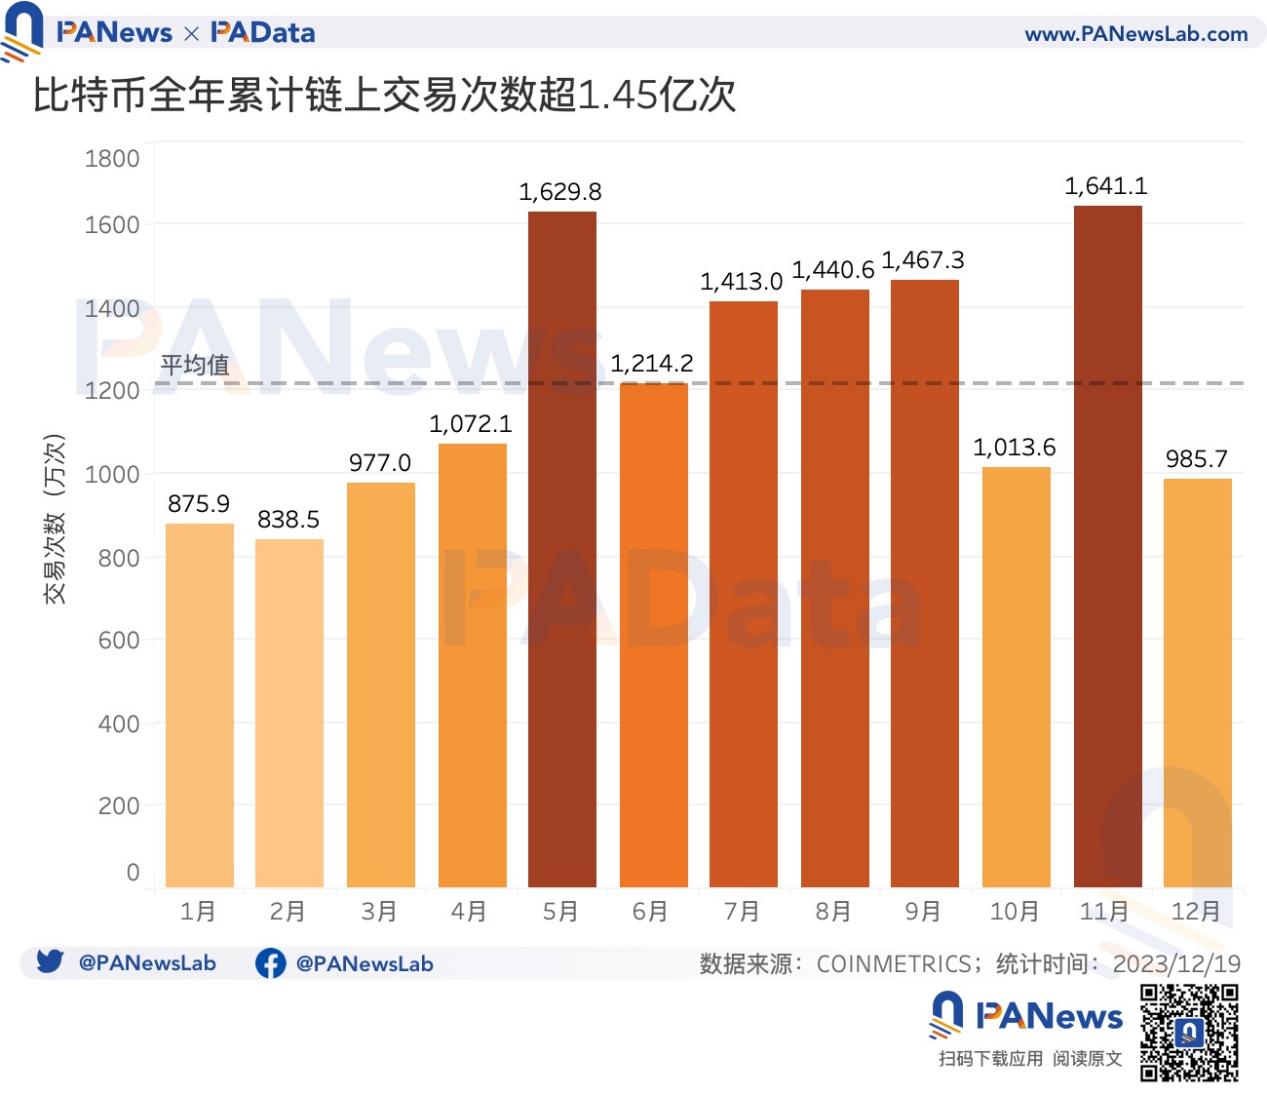
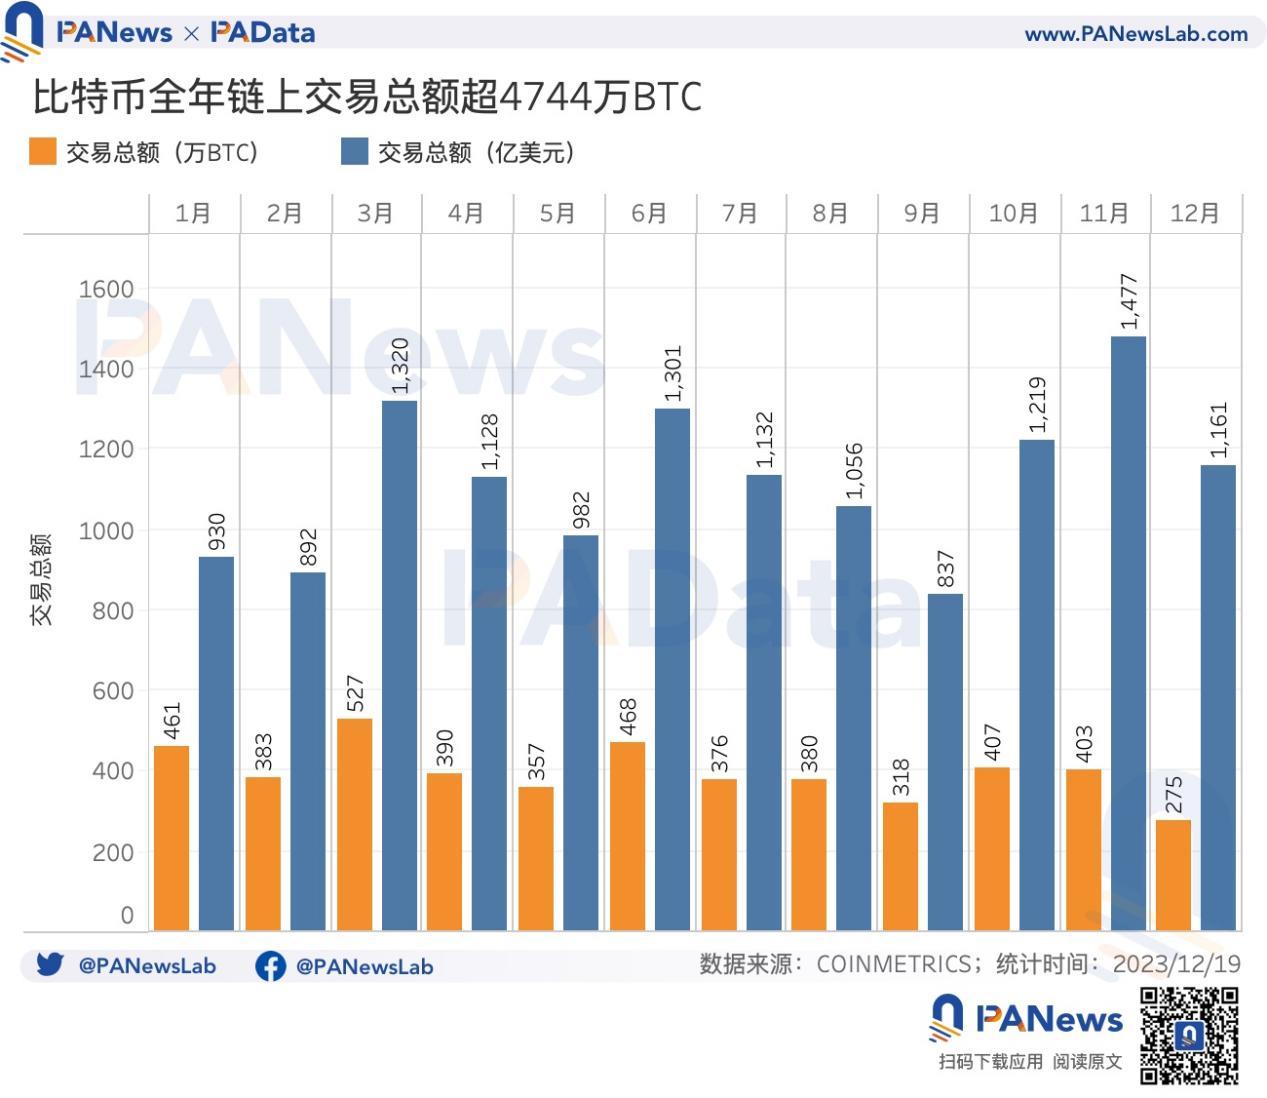
Transaction counts and total transaction value diverged significantly. Total on-chain transactions exceeded 145 million, up about 63% year-on-year; however, total transaction volume dropped sharply by 2,547% to approximately 47.45 million BTC.
-
Total annual on-chain transaction fees reached around $641 million, surging 367.88% year-on-year. Average fee per transaction rose to $3.77, up 146.41% from last year.
Mining
-
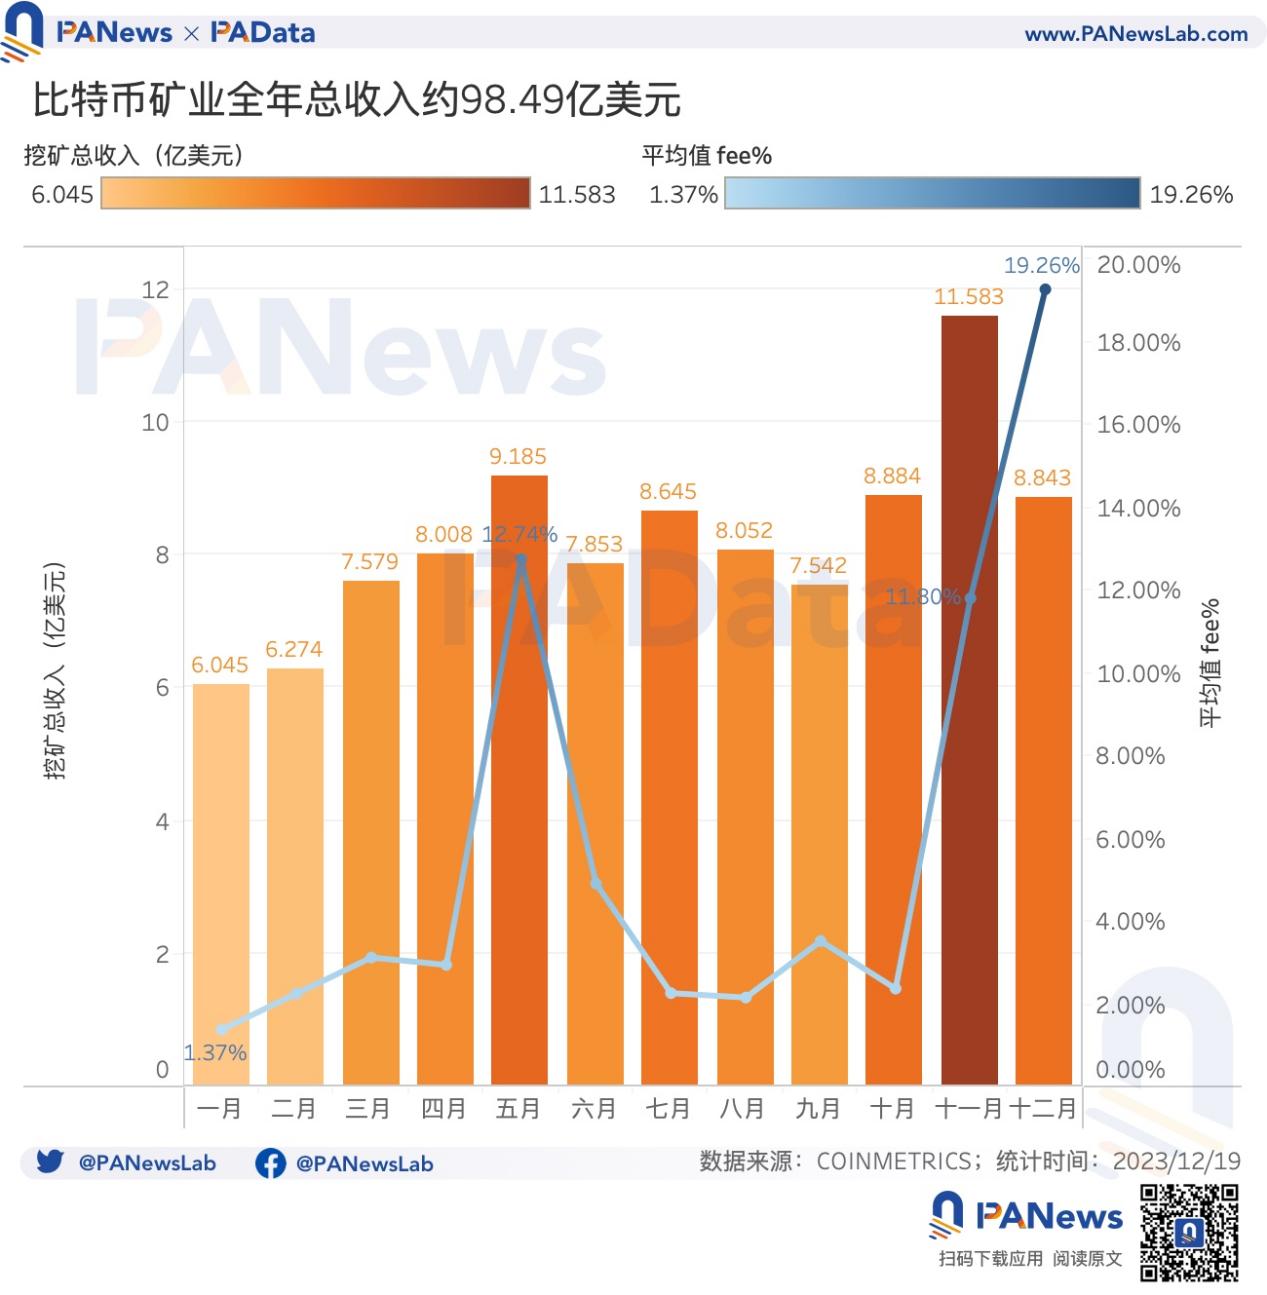
Bitcoin mining generated total revenue (fees plus block rewards) of approximately $9.849 billion this year. By December, daily fees accounted for 19.26% of total revenue.
-
Mining difficulty increased by 90.35%, and network-wide average daily hashrate grew by 106.27%. Hashrate growth lagged behind price appreciation, suggesting miners may have enjoyed excess profits.
Application Layer
-
Total Inscriptions generated in 2023 surpassed 49.46 million. Two peak periods emerged: late April to mid-September, and late October through year-end. At peaks, daily new inscriptions exceeded 400,000, reaching over 500,000 at the highest point.
-
Bitcoin DeFi TVL grew from $96 million to $299 million, a surge of 211.46%. Lightning Network, previously dominant with 87.90% of total TVL, saw its share drop to 70.95%, indicating diversification and rapid growth across newer protocols within the Bitcoin ecosystem.
01 Trading Market: Price Up Over 158%, Profit-Taking Addresses Exceed 87%
The trading market offers the most direct window into Bitcoin’s development. In 2023, Bitcoin largely completed its recovery from last year’s decline, climbing from an initial price of $16,500 to over $42,700 by year-end—an annual increase of 158.06%, nearing early 2022 levels. Moreover, the upward trend was highly consistent and sustained, with fewer than five instances of daily price swings exceeding ±5%. The average daily price change was just 0.29%, peaking at no more than +9.77% or -7.83%.
Next year, Bitcoin will experience its fourth halving event, widely seen as a key catalyst for price appreciation. Historically, in the six-month period before each of the first three halvings, Bitcoin gained 134.62%, 51.30%, and -1.89%, respectively. In the six months following each halving, gains were 955.74%, 37.24%, and 72.21%. Only the third pre-halving period saw a slight dip, during a prolonged bear market, but even then, losses were minimal. Overall, historical patterns show that halvings and price increases tend to go hand-in-hand.
According to BTC.com forecasts, the fourth halving is expected on April 19, 2024. Bitcoin has already entered the pre-halving phase (starting October 22 this year), when the price stood at $29,900. This suggests the upcoming halving could provide strong momentum for further price gains.
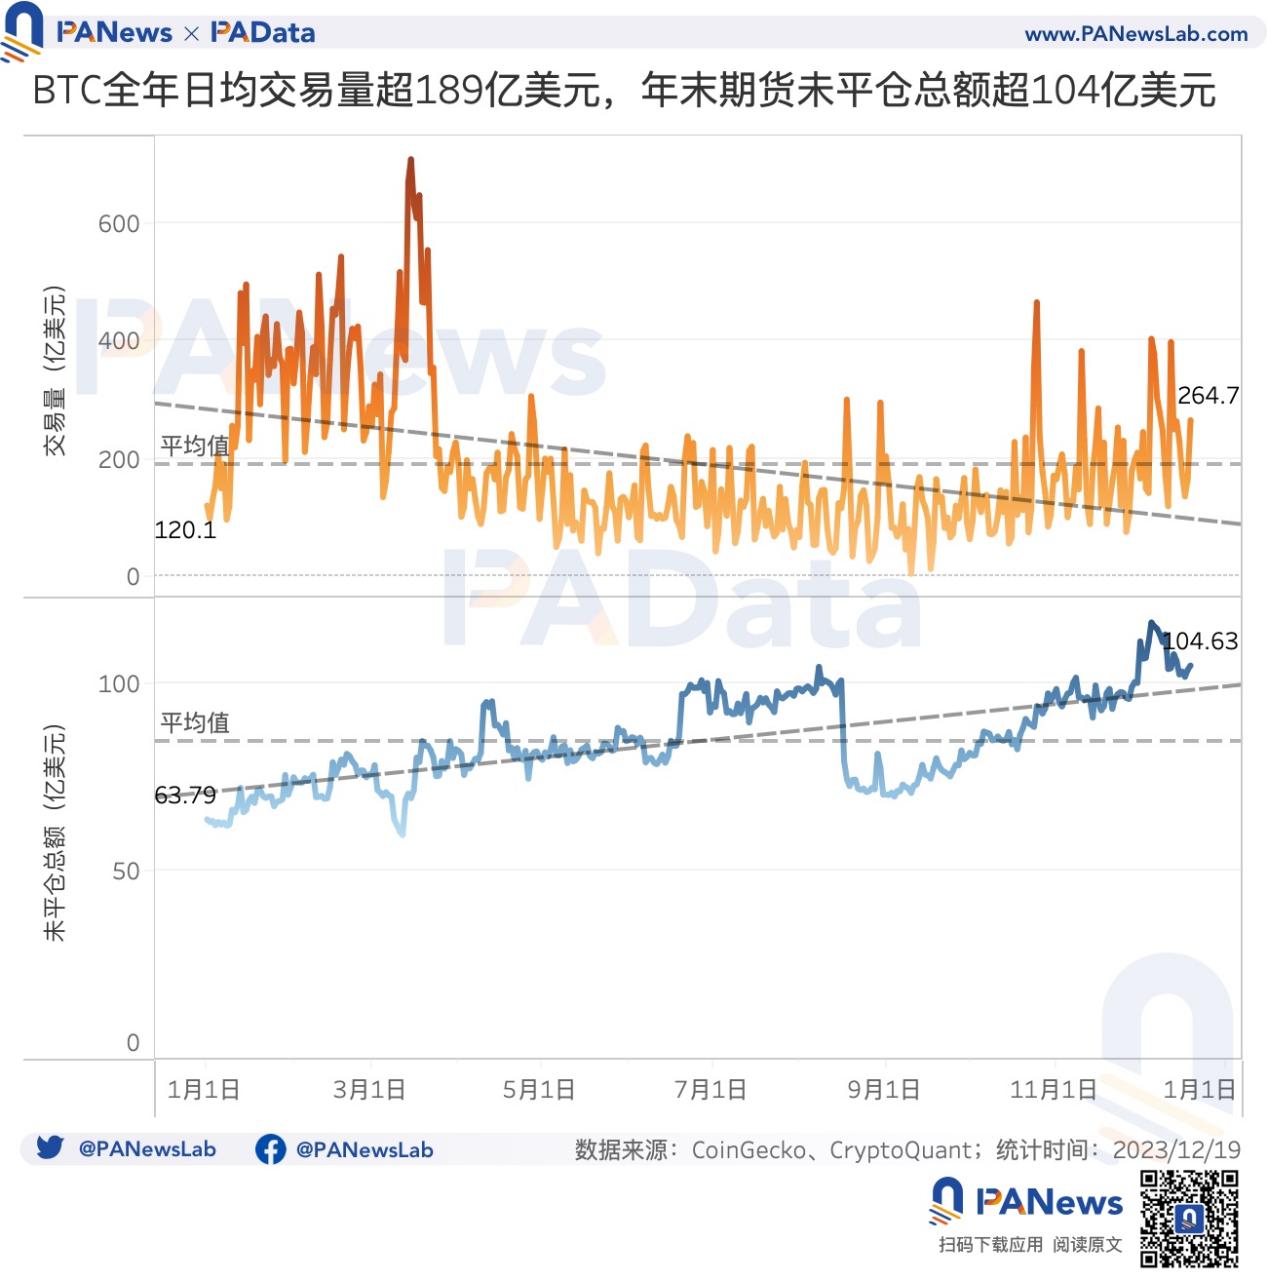
Despite the clear price recovery, trading volumes did not rise correspondingly. Average daily trading volume was approximately $18.92 billion, showing an overall declining trend throughout the year. Q1 had the highest volume, averaging around $33.4 billion, while Q4 rebounded slightly to about $17.6 billion.
Conversely, the futures market remained active, with open interest steadily increasing from $6.379 billion at the start of the year to $10.463 billion by year-end—a 64.02% rise. Yet leverage ratios declined. According to CryptoQuant, estimated leverage in Bitcoin futures fell from 30.67% at the beginning of the year to 20.22% by December 21, reverting to early 2022 levels and aligning with the average over the past three years.
MVRV (Market Value to Realized Value) ratio indicates whether the current market price is above or below the "fair value" based on when coins were last moved. An MVRV greater than 1 suggests potential overvaluation. Bitcoin’s MVRV has been consistently above 1 since January 13, reaching 1.96 by year-end, with an annual average of about 1.40—indicating persistent market overvaluation throughout the year.
An MVRV above 1 also implies a higher proportion of profitable holdings. Glassnode data shows that the percentage of circulating BTC in profit rose from 50.77% at the start of the year to 87.76% by December 19—meaning the vast majority of coins are now in profit. This surpasses last year’s peak, confirming that Bitcoin’s profitability in 2023 was far stronger than in 2022.
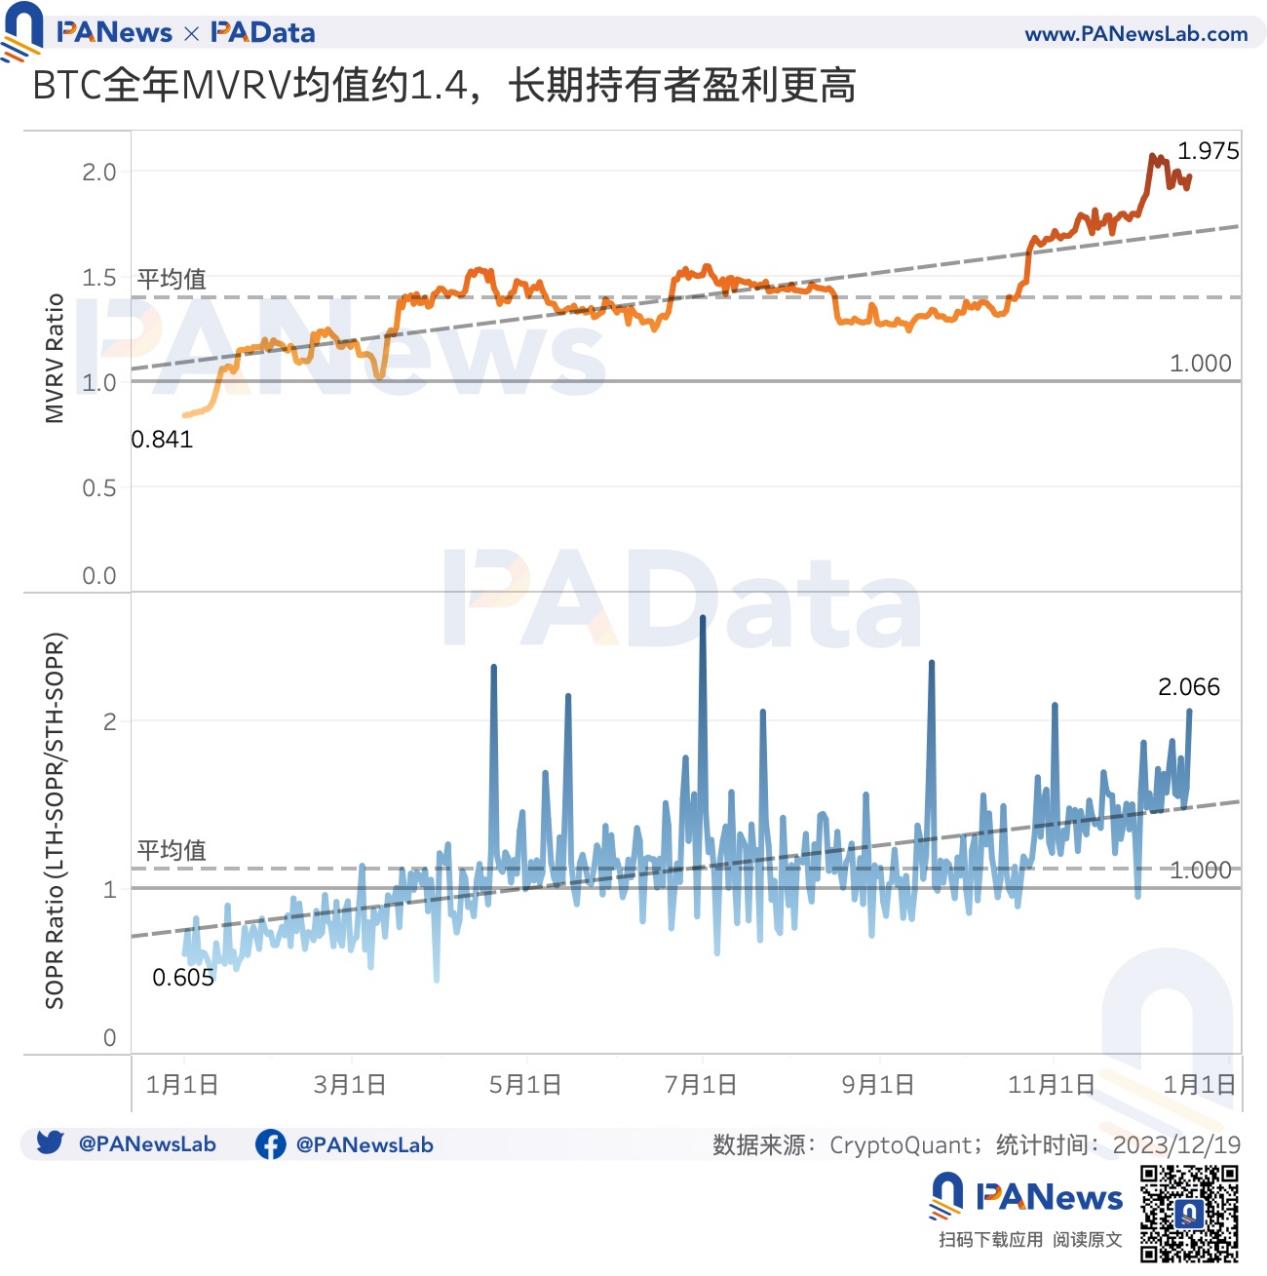
In terms of profit-taking behavior, the LTH-SOPR/STH-SOPR ratio (long-term holder vs. short-term holder spent output profit ratio) climbed from 0.61 at the beginning of the year to 2.1 by year-end. Notably, from late October onward, this ratio remained almost continuously above 1. A ratio above 1 indicates long-term holders are realizing higher profits than short-term holders. Overall, long-term holders performed better in 2023, and their advantage became increasingly pronounced toward year-end.
Regarding institutional capital, spot ETF applications made notable impacts on Bitcoin’s market dynamics this year (see related article: *Data Review of Bitcoin ETFs: Five Futures ETFs Hold Nearly $1.3B—How Much Do Application Announcements Influence Bitcoin?*). Frequent announcements suggest deepening integration between Bitcoin and traditional financial markets. However, statistically, Bitcoin’s price movements showed little overall correlation with the Dow Jones Industrial Average or the U.S. Dollar Index. There were 179 days and 200 days, respectively (51.59% and 57.64% of the year), where correlation coefficients (7-day averages) stayed within -0.5 to 0.5, indicating no significant relationship.
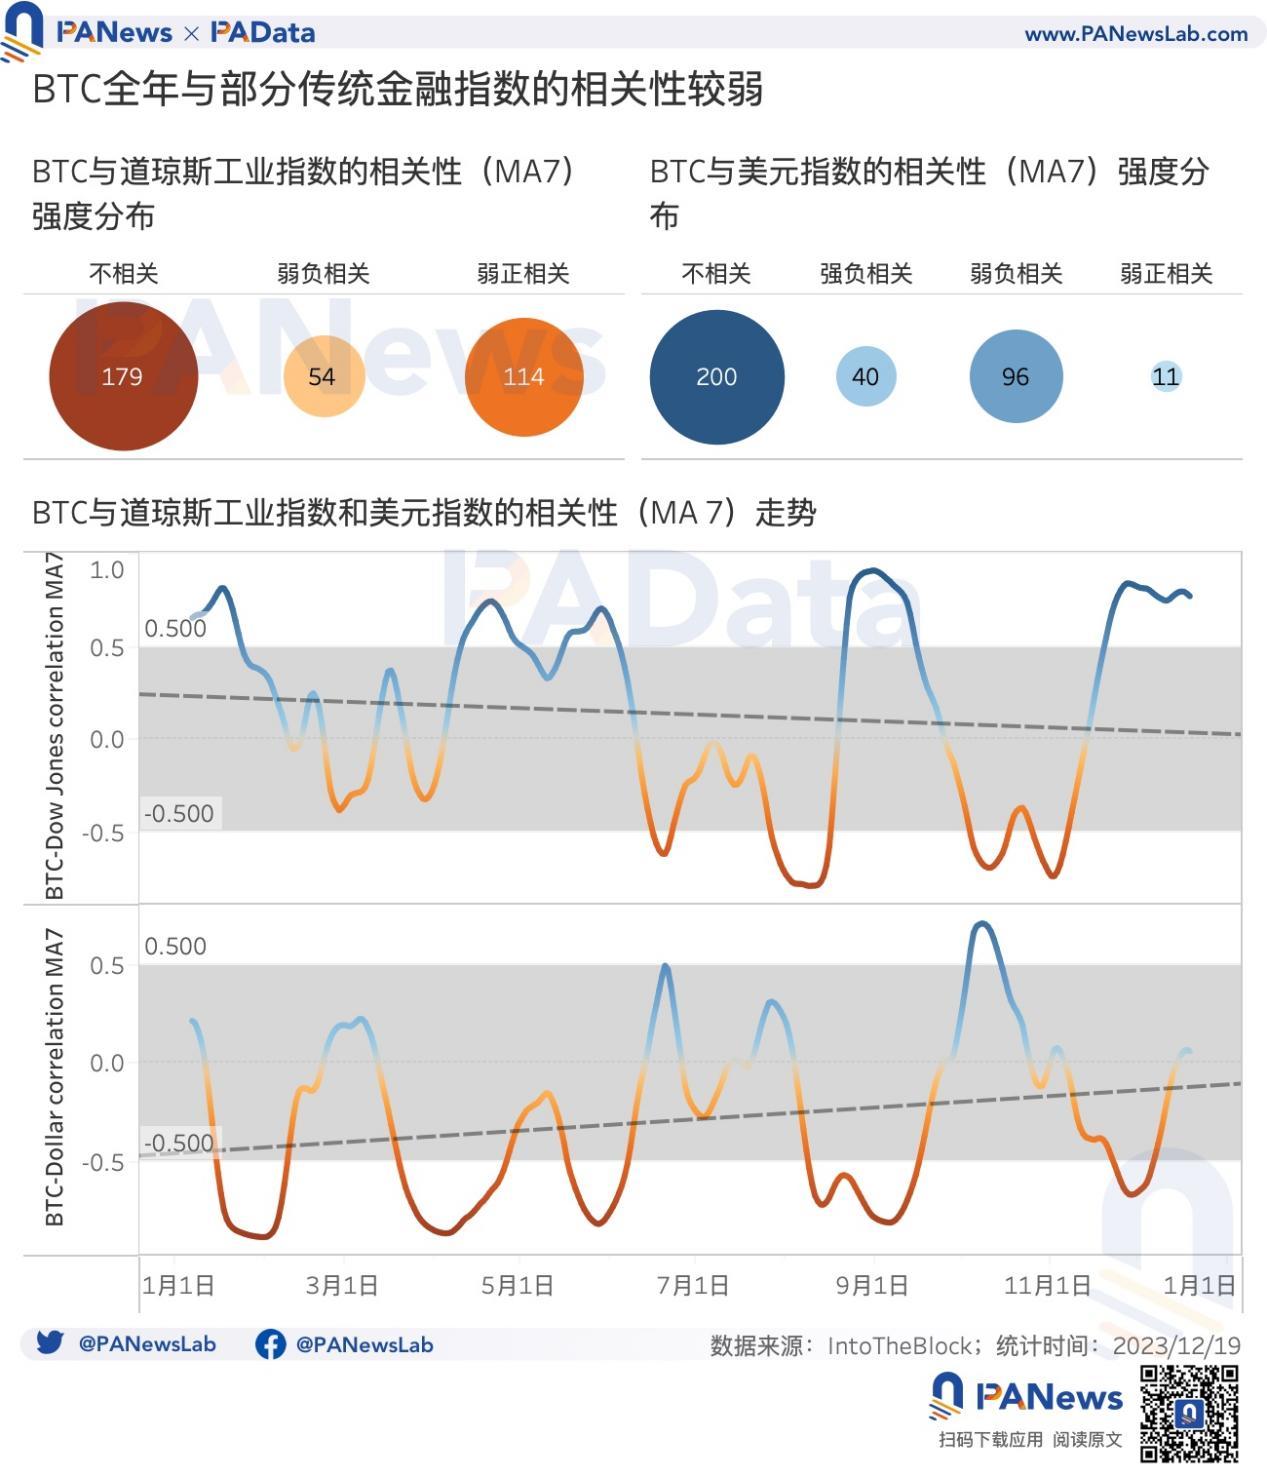
Nevertheless, partial correlations existed. Weak negative correlation (7-day average coefficient between -0.5 and -0.8) occurred for 54 days with the Dow and 96 days with the dollar index (15.56% and 27.67%). Weak positive correlation (0.5–0.8) occurred for 114 days with the Dow and 11 days with the dollar index (32.85% and 3.17%). Strong negative correlation with the dollar index (below -0.8) lasted 40 days (11.53%). Trend-wise, Bitcoin’s correlation with the Dow weakened over time, while its negative correlation with the dollar index strengthened.
02 On-Chain Fundamentals: Transaction Count Soars to 145M+, Transaction Volume Plummets to 47.45M BTC
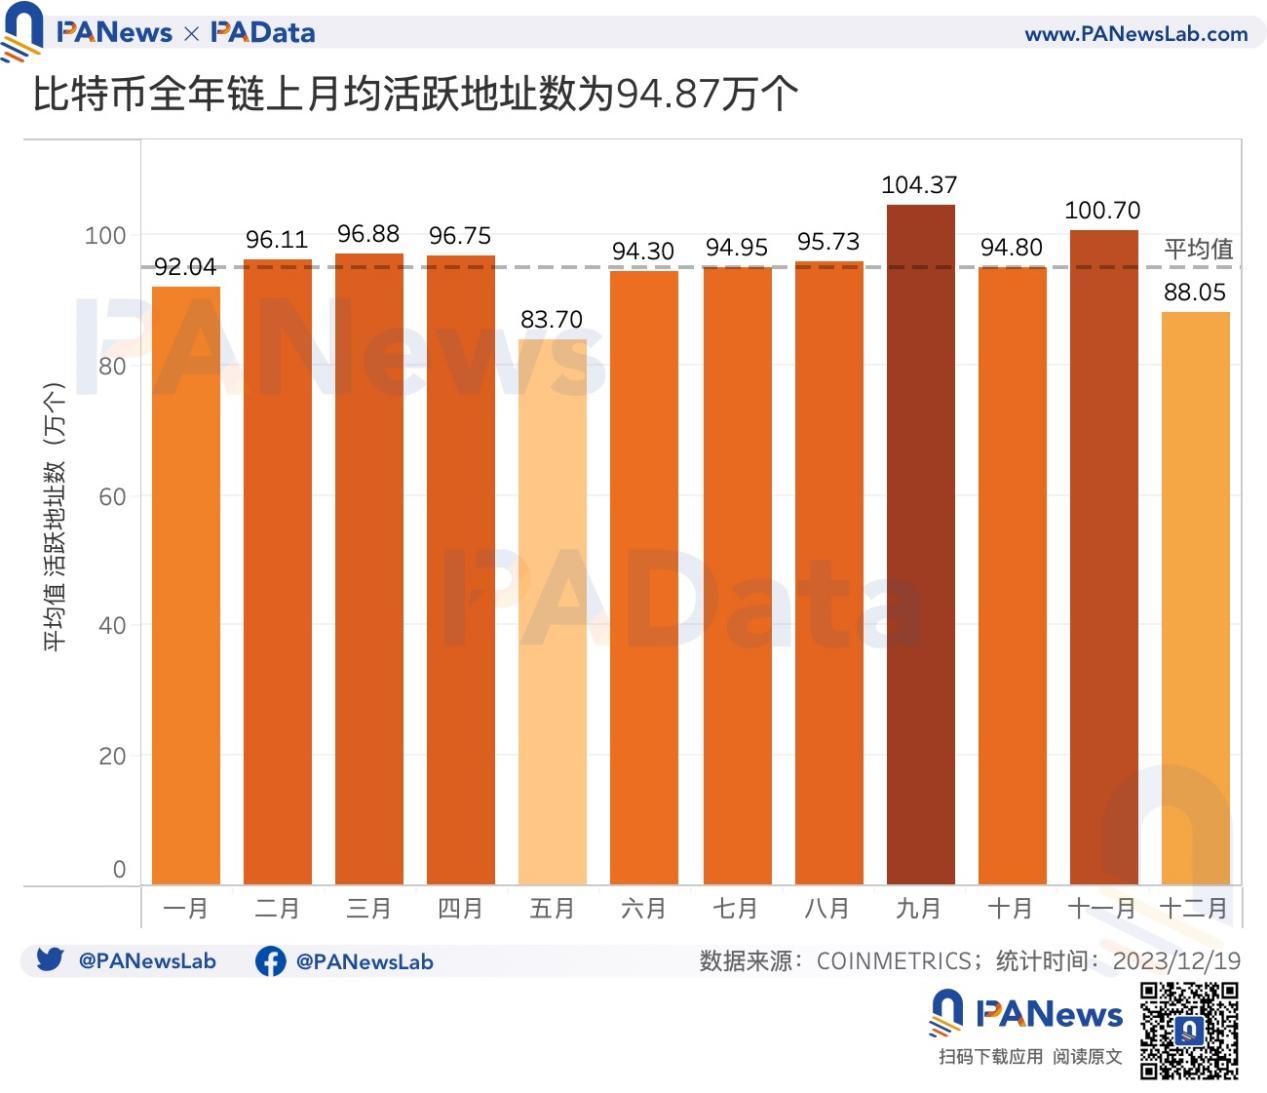
Bitcoin’s monthly average number of active on-chain addresses in 2023 was approximately 948,700, up 3.51% from last year’s average of 916,500, though still below 2021’s monthly levels. Daily active addresses exceeded 1 million in both September and November—the most active periods of the year.
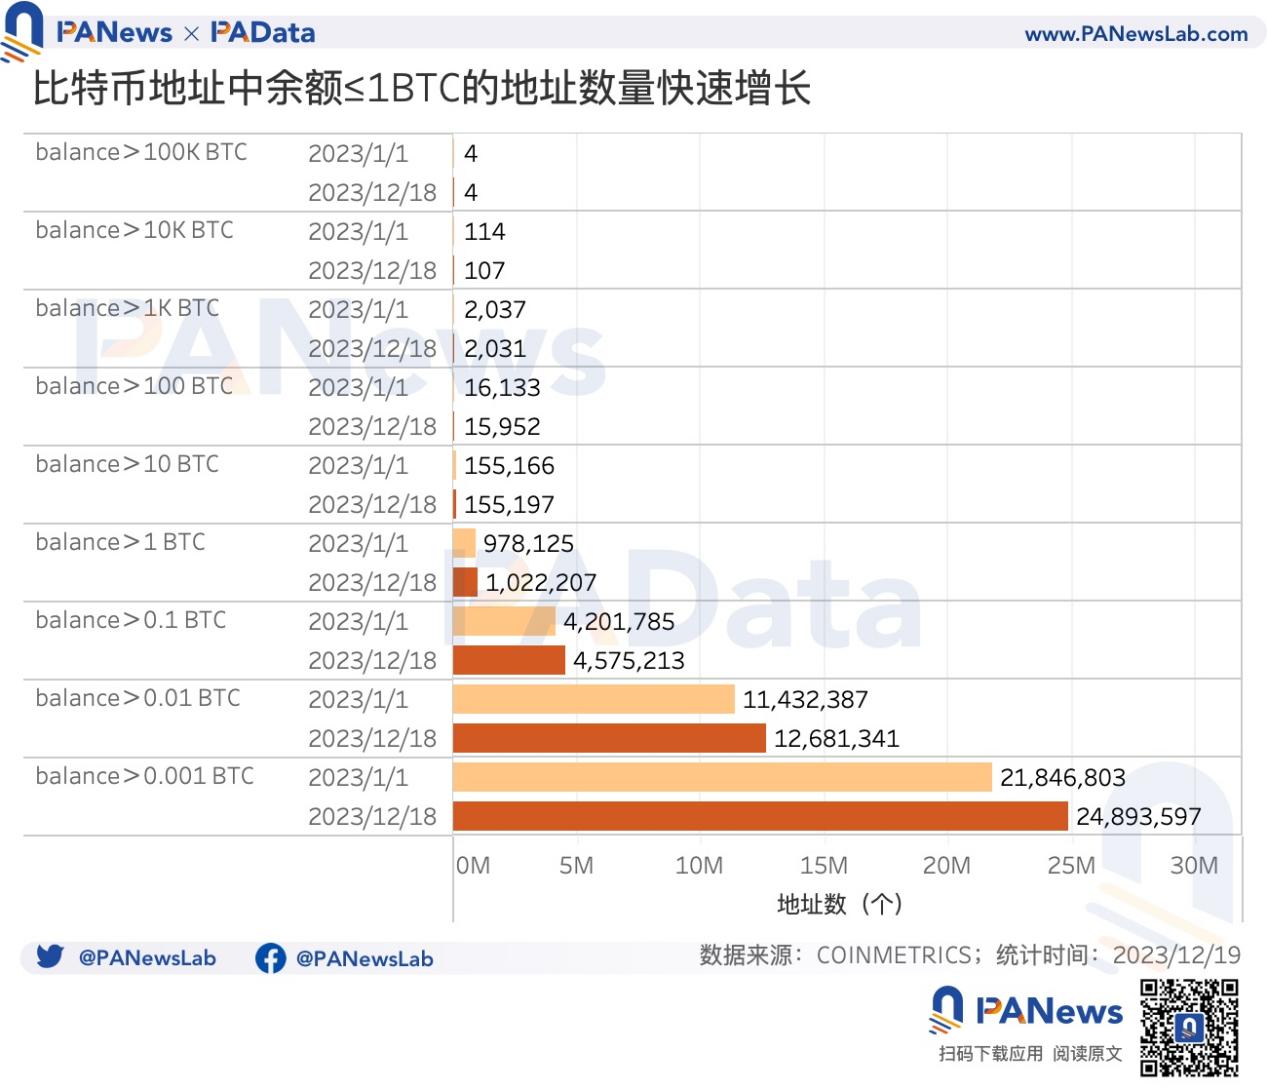
Looking at address balance distribution and holding duration trends, small-balance holdings among retail users continued accelerating toward smaller denominations, while holding durations shifted from a polarized pattern to a longer-term orientation.
In terms of balance distribution, addresses holding between 0.001–0.01 BTC, 0.01–0.1 BTC, and 0.1–1 BTC are the most numerous, collectively accounting for 97.24% of all addresses. Holding 1 BTC now means surpassing 97% of Bitcoin addresses. These three balance tiers grew by 13.95%, 10.92%, and 8.89% respectively during the year—significant increases. Conversely, only the 1–10 BTC tier saw modest growth (~4.51%), while larger balances remained nearly unchanged. Notably, addresses holding 10,000–100,000 BTC decreased by 6.14%. Overall, this reinforces the acceleration toward smaller holdings.
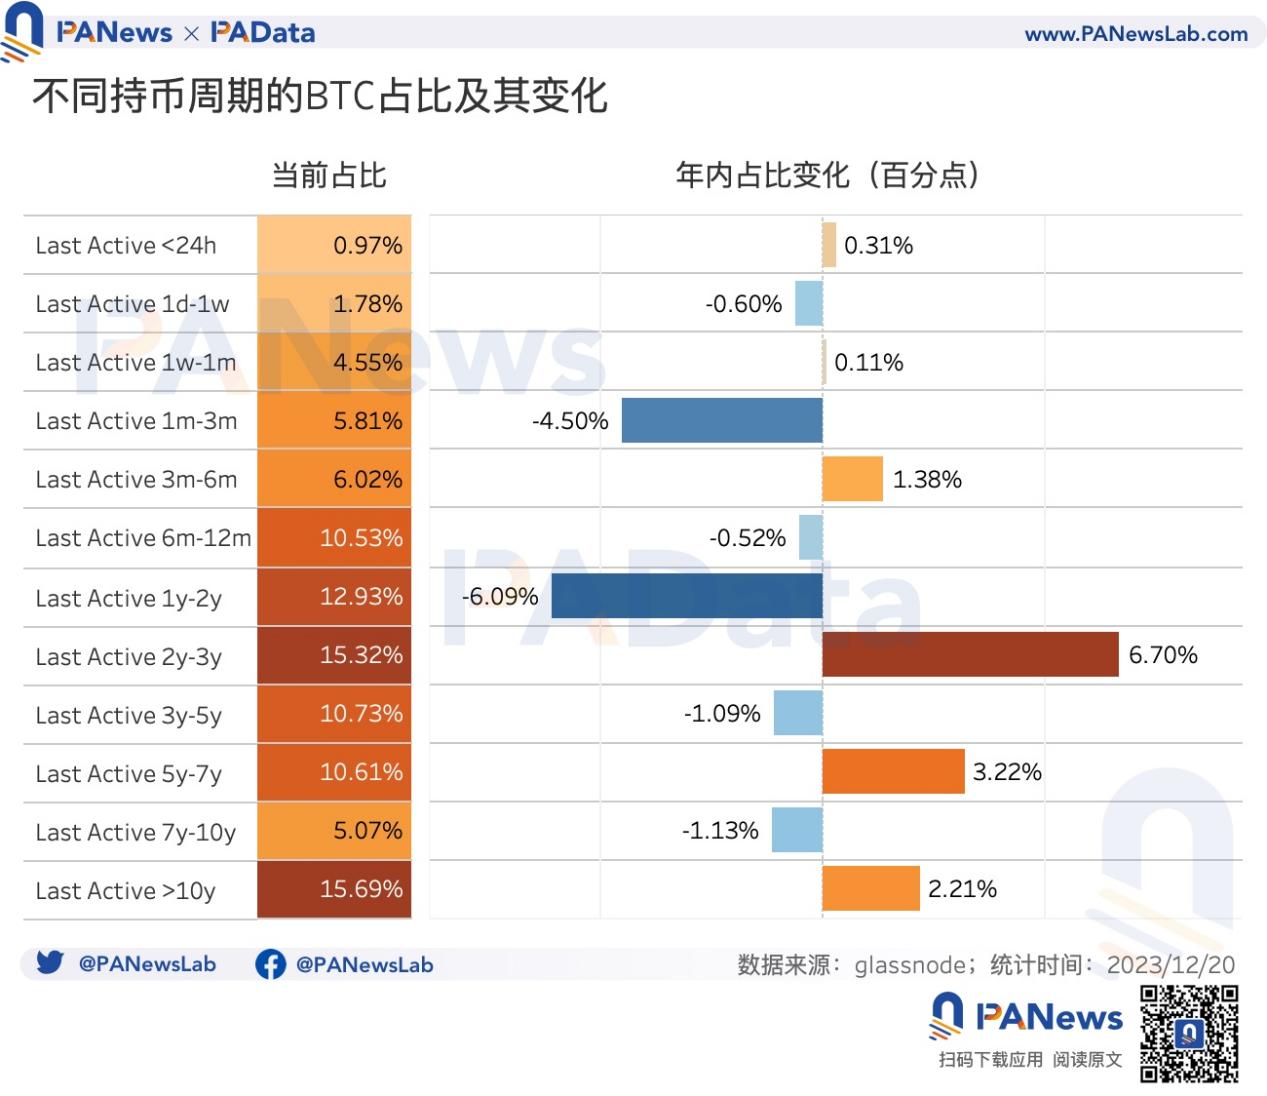
Regarding holding duration, 6+ months remains the dominant category, with six intervals—6–12 months, 1–2 years, 2–3 years, 3–5 years, 5–7 years, and 10+ years—each exceeding 10% of total supply. While last year’s shift centered around the 1-year mark, this year’s inflection point lies at 2 years. All holding durations above 2 years saw gains: 2–3 years rose by 6.7 percentage points, 5–7 years by 3.2 points, and 10+ years by 2.2 points. In contrast, the shares of coins held less than 24 hours or 1 week to 1 month grew much slower than last year. Thus, the short-term holding trend did not continue, while long-term accumulation strengthened.
Another major on-chain shift compared to last year is the divergence between transaction count and transaction volume. Total on-chain transactions exceeded 145 million in 2023—up roughly 63% from 88.99 million last year—with monthly averages reaching 12.14 million and a consistent upward trajectory throughout the year.
However, the surge in transaction count did not translate into higher transaction volume. Annual on-chain transaction value totaled approximately 47.45 million BTC (about $134 billion), a staggering 2,547% drop from last year’s 125.6 million BTC. Monthly average transaction volume was around 3.954 million BTC ($111.97 billion).
This divergence stems primarily from the explosion of the Ordinals protocol, which also led to a dramatic rise in transaction fees. Total annual on-chain fees reached approximately $641 million, up 367.88% from $137 million last year. Fees were concentrated in May, November, and December (through Dec 19), each exceeding $100 million and collectively representing 70.16% of annual fee income.
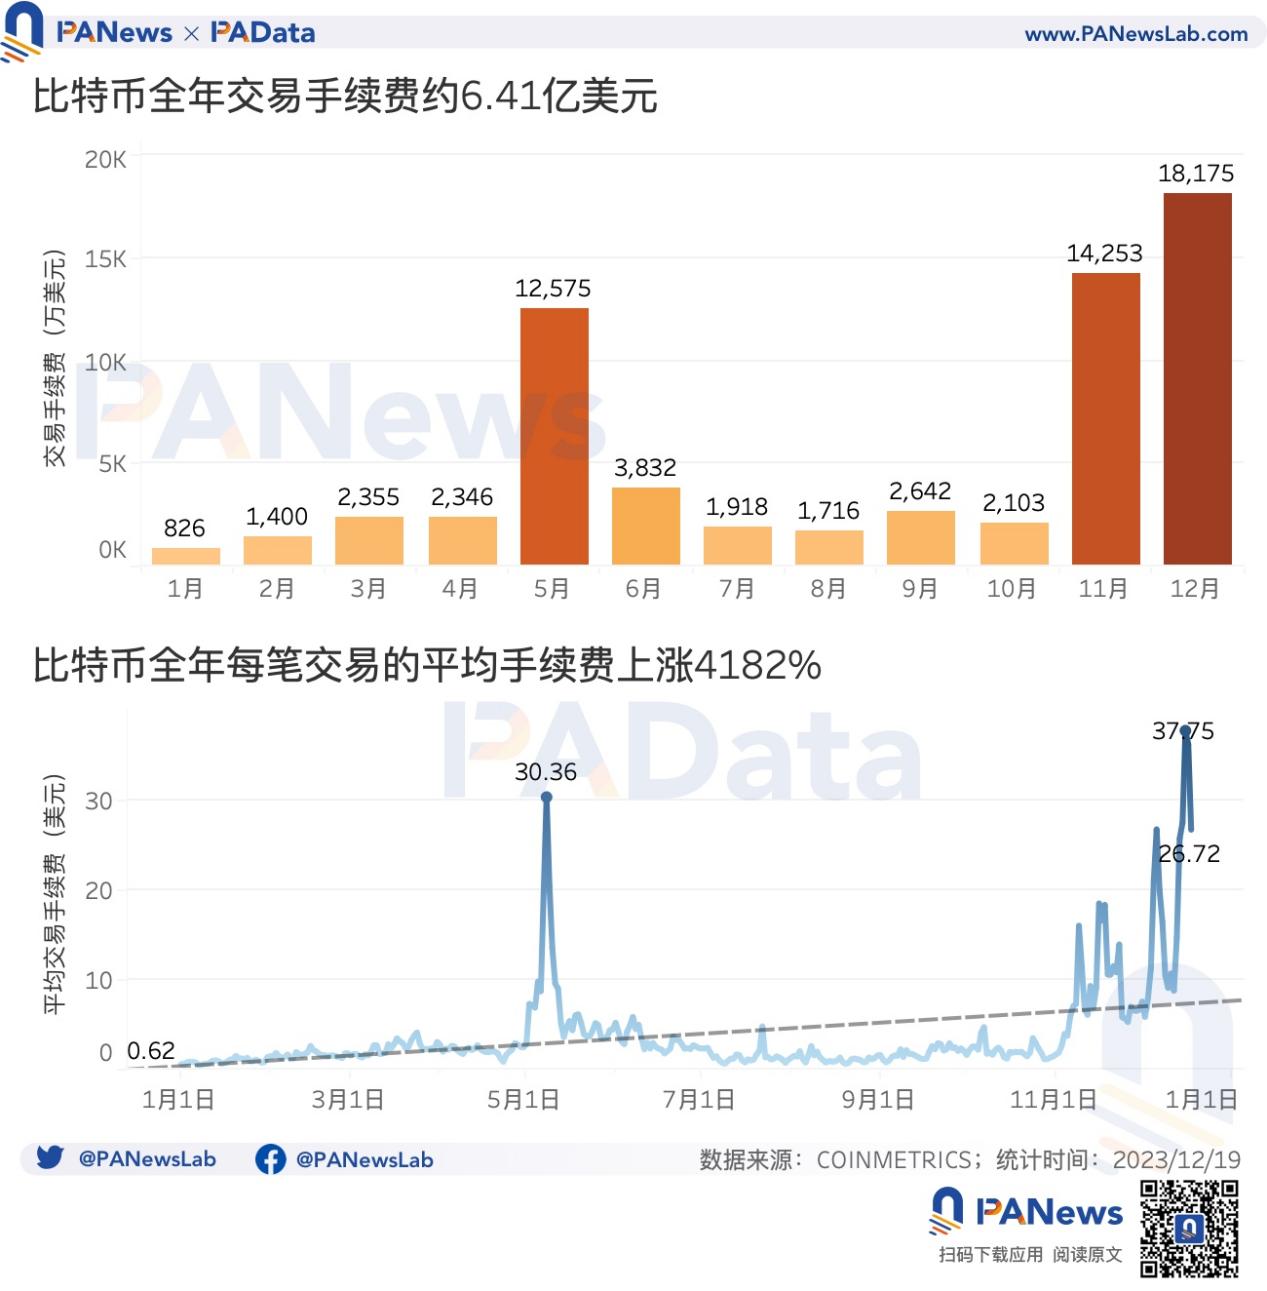
Average fee per transaction was about $3.77 this year, up 146.41% from $1.53 last year. The average daily fee surged from $0.62 to $26.72—an increase of 4,182%—with peaks exceeding $37. Clearly, Bitcoin’s on-chain transaction costs rose substantially in 2023.
03 Mining: Annual Revenue Over $9.8B, Hashrate Grows 106%
Mining remains a cornerstone of the blockchain industry. In 2023, Bitcoin mining generated total annual revenue (fees plus block rewards) of approximately $9.849 billion. November alone brought in $1.158 billion, reflecting a general upward trend in mining income.
Consistent with the transaction boom driven by Ordinals, mining fee contributions peaked twice: in May, daily fees accounted for 12.74% of total revenue; the second peak occurred in November and December, reaching 11.80% and 19.26%, respectively. If transaction activity fueled by Ordinals continues into next year—even as block rewards halve—fee contribution could rise further.
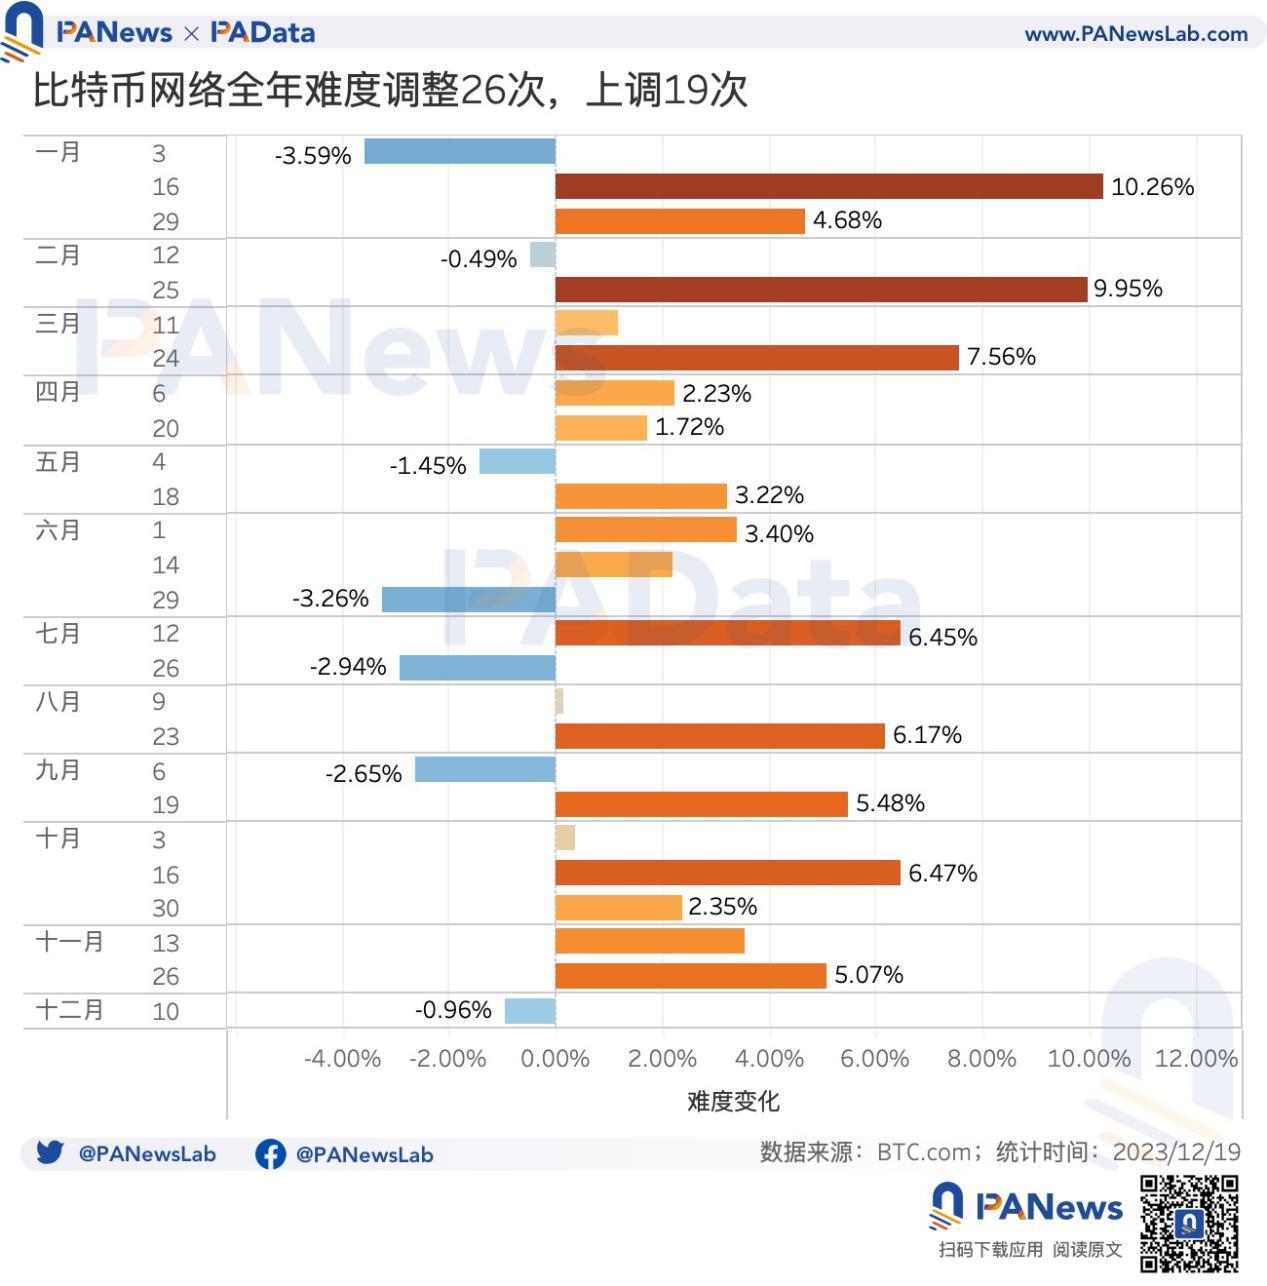
From a cost perspective, miners faced continuous increases in difficulty and hashrate. Mining difficulty adjusted 26 times this year, increasing 19 times—particularly during late February to late April and mid-September to late November. Compared to last year, both the frequency and magnitude of difficulty increases were higher.
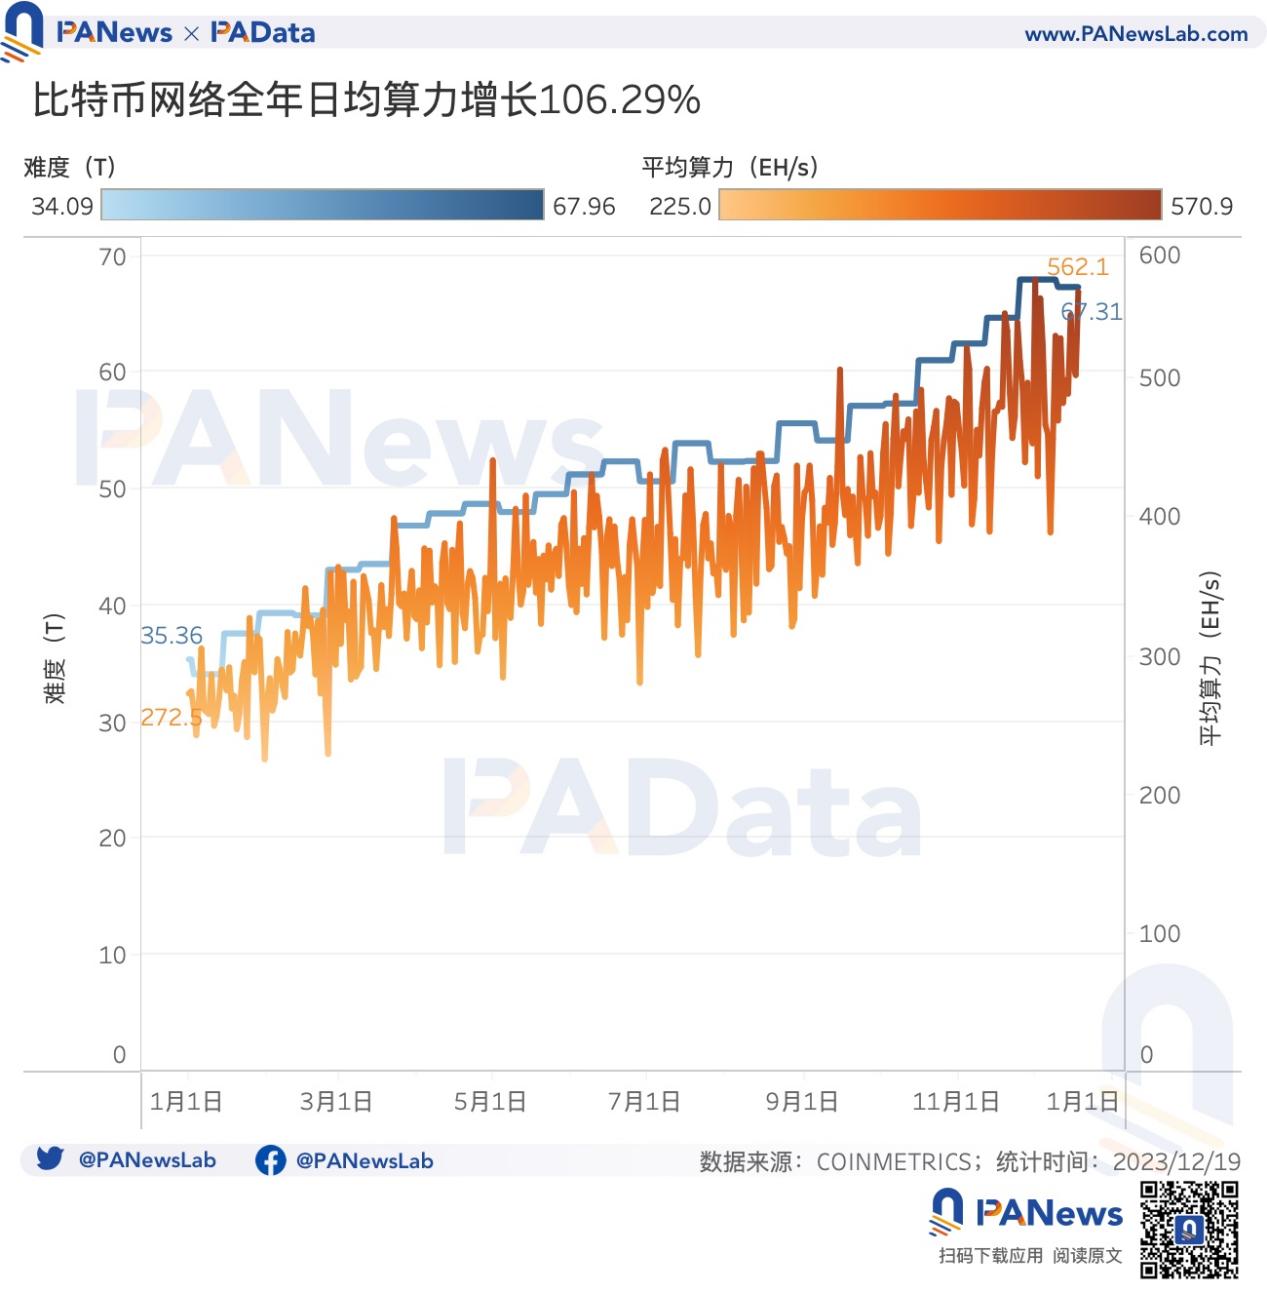
Current network difficulty stands at approximately 67.31T, up 90.35% from the start of the year. Daily average hashrate has similarly risen to about 562.1 EH/s, up 106.27%. Unlike last year’s modest 11.21% hashrate increase, this year’s growth was substantial. More importantly, hashrate growth trailed price appreciation, implying miners may have captured outsized returns.
According to BTC.com, as of December 22, under PPS mode, daily mining revenue per T of hashrate was approximately 0.00000187 BTC (~$0.082), while under FPPS mode it was 0.00000268 BTC (~$0.11). COINMETRICS data shows unit hashrate mining revenue increased by 85.21% year-on-year (closely matching FPPS figures). Overall, mining proved highly profitable in 2023.
04 Application Layer: Total Inscriptions Surpass 49.46M, BRC-20 Emerges as Growth Engine
Bitcoin’s real-world applications have historically been limited. In the past, use cases centered on the Lightning Network and WBTC. But in 2023, the emergence of Ordinals opened new frontiers for Bitcoin’s utility.
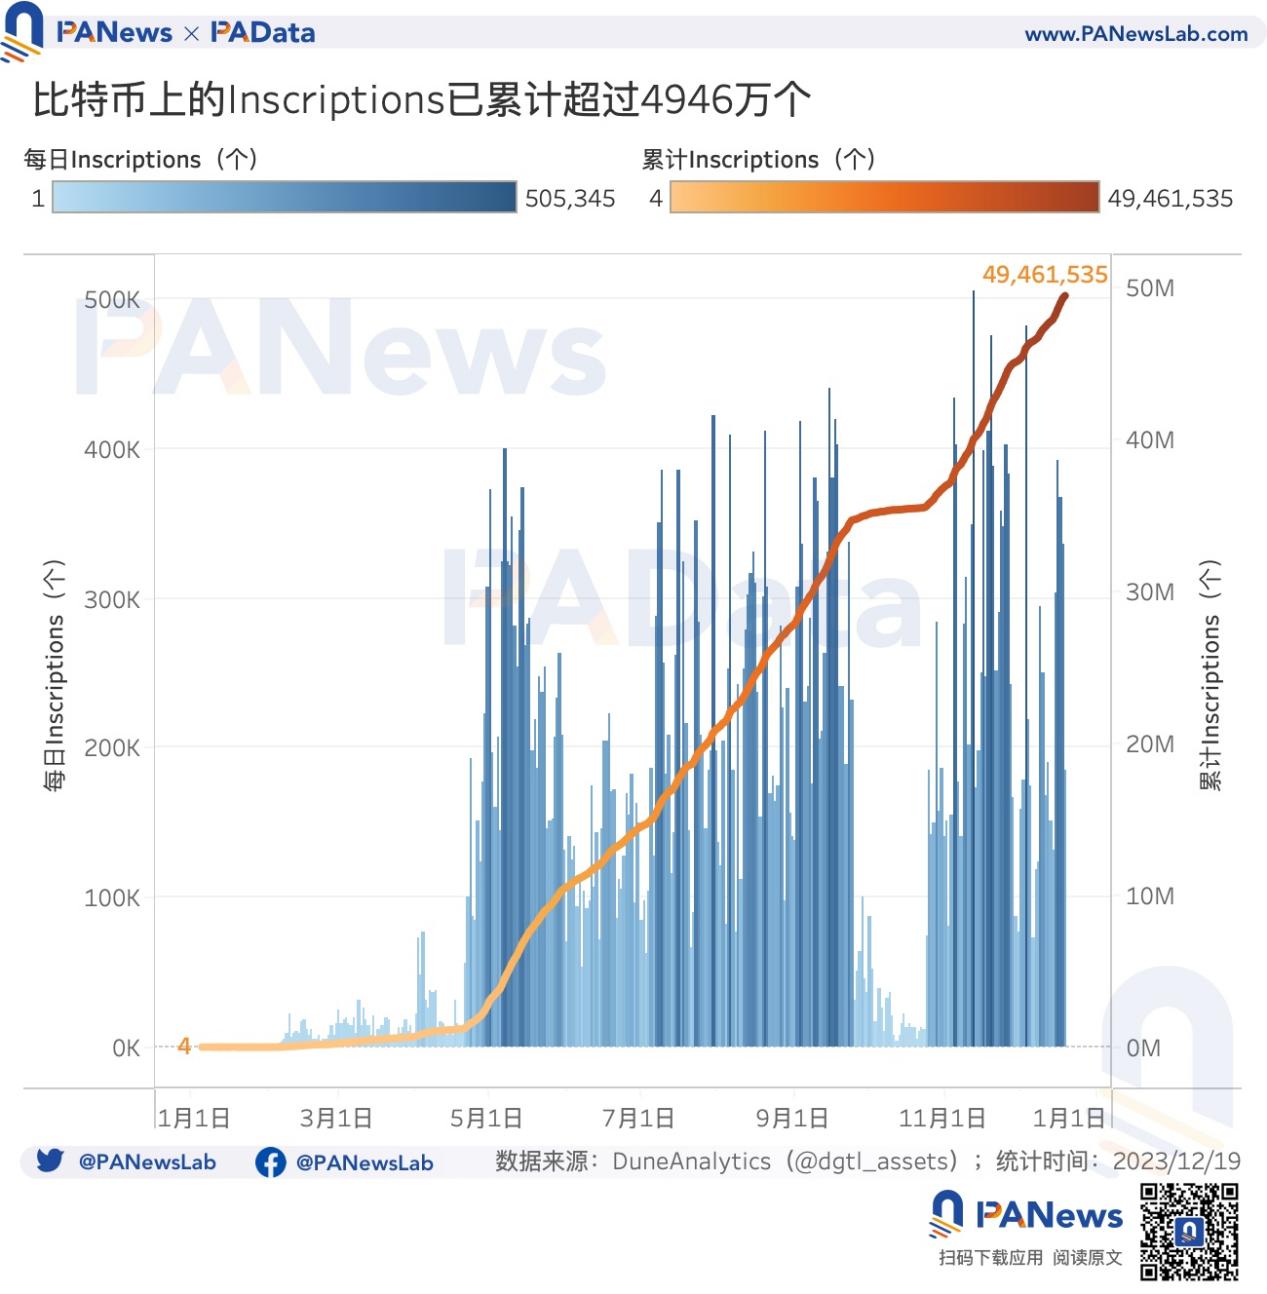
Starting with Ordinals, cumulative Inscriptions exceeded 49.46 million by December 19—compared to just 4 at the beginning of the year. Two peak periods emerged: late April to mid-September, and late October through year-end. During these peaks, daily new inscriptions frequently surpassed 400,000, reaching over 500,000 at the highest point.
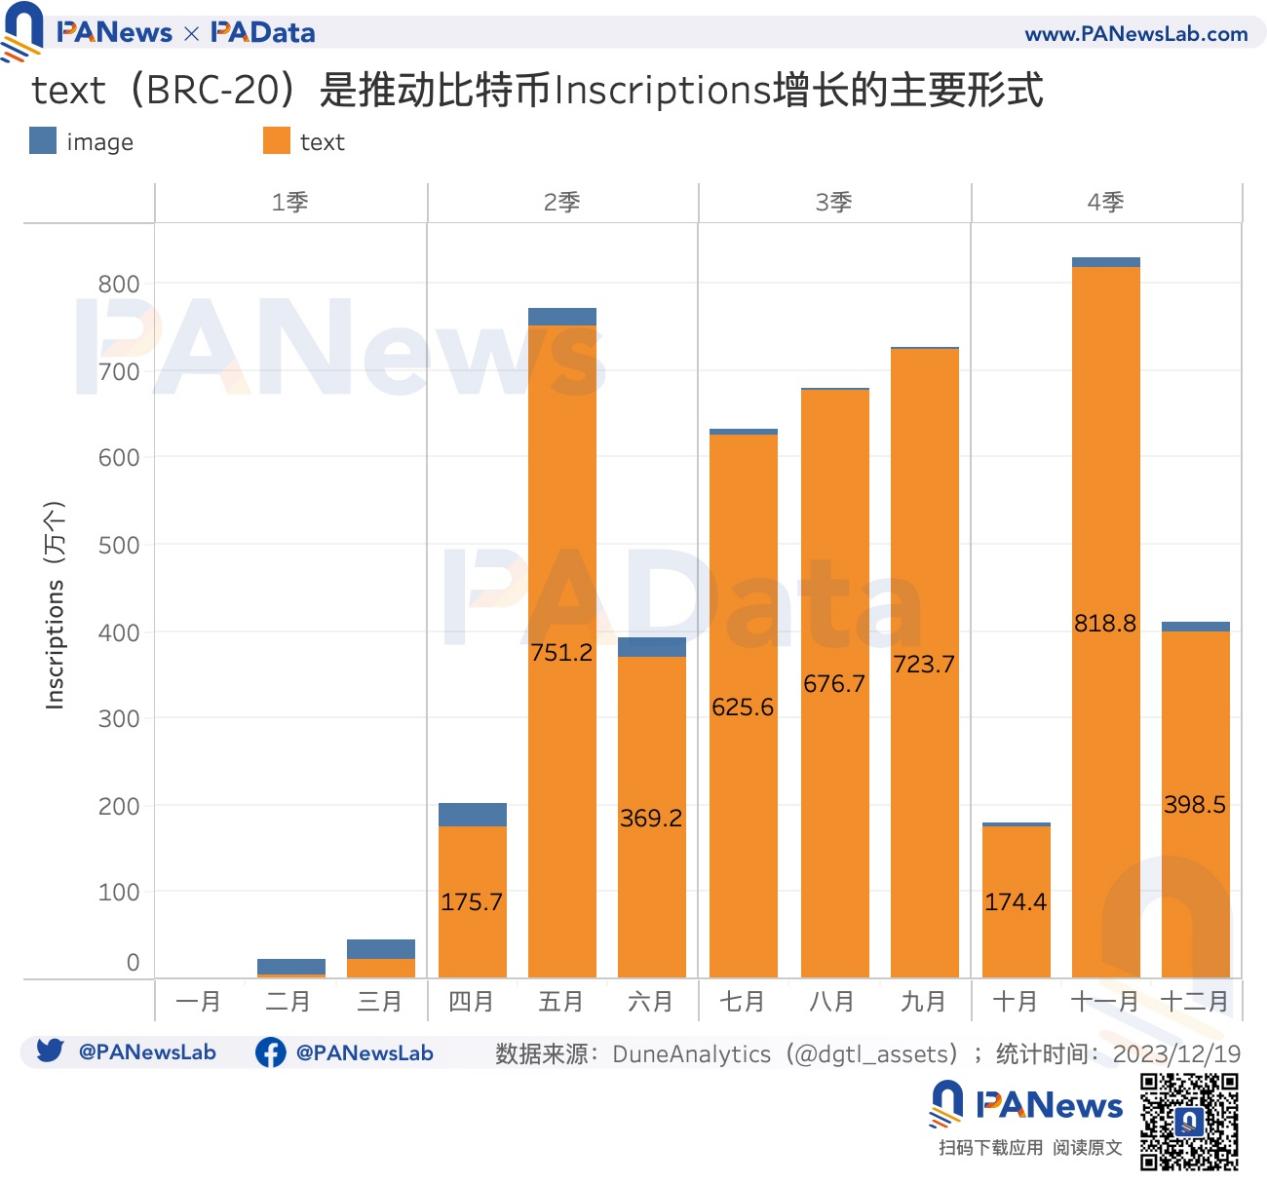
By type, images and text dominate. Images relate to NFT-like content, while text enabled the creation of BRC-20 tokens. Initially, images dominated—Q1 saw 378,000 image inscriptions versus 270,000 text-based ones. But starting in April, the trend reversed rapidly. From Q2 to Q4, text inscriptions totaled 47.14 million, dwarfing the 1.067 million image inscriptions. This shift was driven largely by wealth-generation effects from BRC-20 tokens like ORDI.
The BRC-20 craze continues, and markets for image-based inscriptions are gradually forming. Compared to mature ecosystems like ERC-20 and NFTs, Bitcoin’s application layer still has vast room for growth. The rise of BRC-20 has drawn comparisons to Ethereum’s DeFi Summer in terms of momentum and excitement.
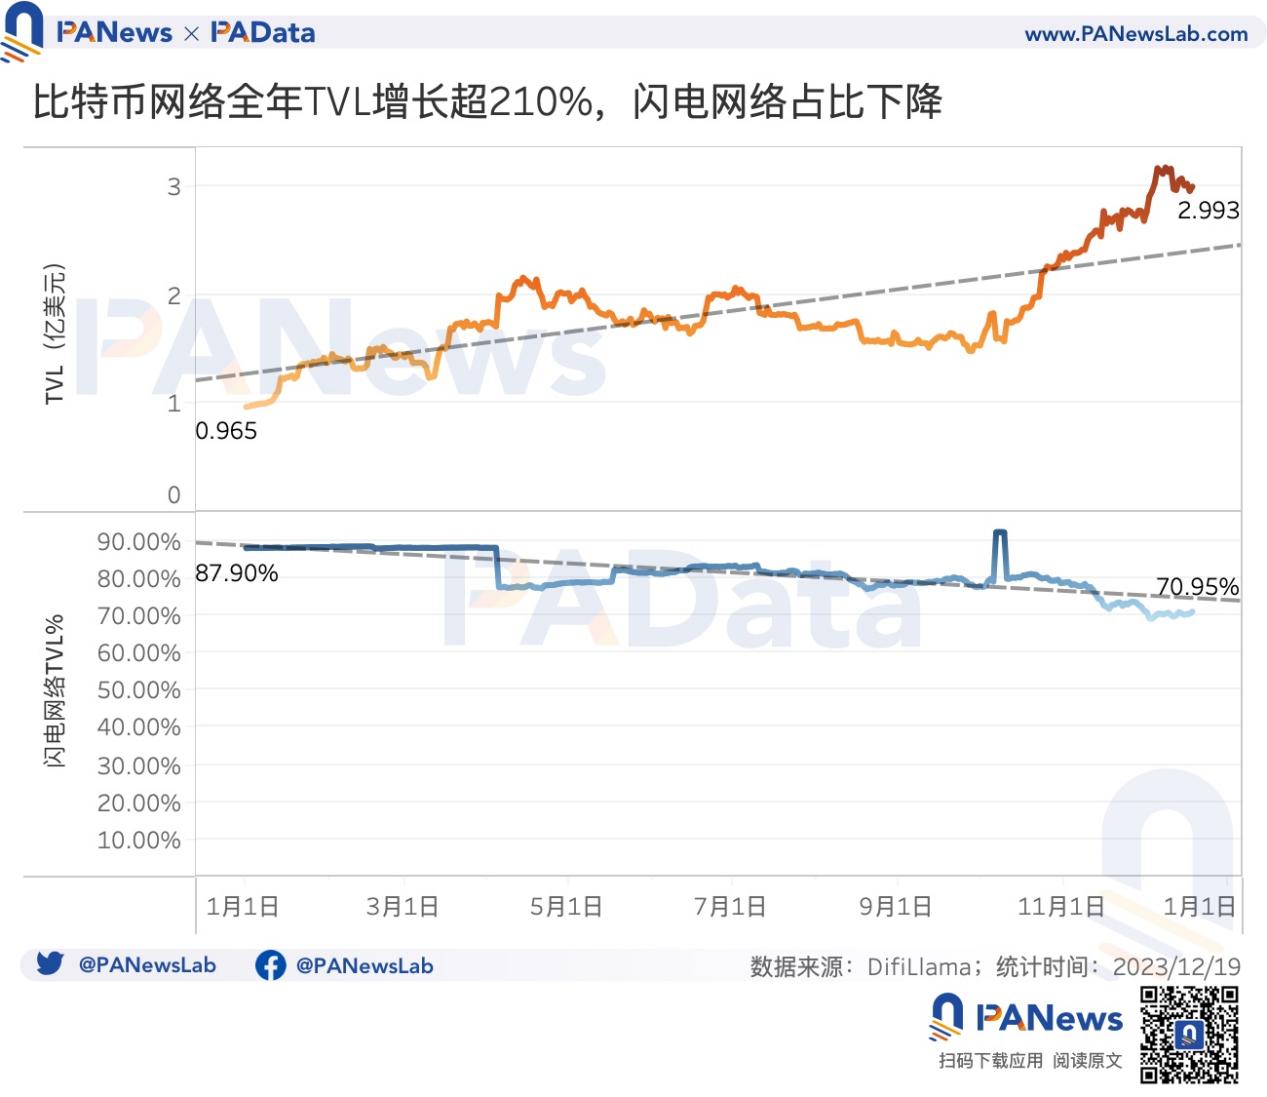
Looking at Bitcoin DeFi TVL, it grew from $96 million to $299 million in 2023—an increase of 211.46%. Peak TVL briefly exceeded $300 million. Notably, Lightning Network, once dominant with 87.90% of total TVL, now accounts for 70.95%. Given the overall TVL increase, this indicates the emergence of diverse new applications gaining traction and rapidly growing their locked value.
Join TechFlow official community to stay tuned
Telegram:https://t.me/TechFlowDaily
X (Twitter):https://x.com/TechFlowPost
X (Twitter) EN:https://x.com/BlockFlow_News
 PANews