
Glassnode 2023 On-Chain Recap: Year-End Capital Inflows Spark Crypto Recovery, Majority of Investors' Tokens Now in Profit
TechFlow Selected TechFlow Selected
Glassnode 2023 On-Chain Recap: Year-End Capital Inflows Spark Crypto Recovery, Majority of Investors' Tokens Now in Profit
Bitcoin supply is currently tightly held by long-term holders, and most investors now hold coins that are in profit.
 Navigating Web3 tides with focused insights
Written by: Glassnode
Translated by: TechFlow
In this final post of the year, Glassnode provides a rapid overview of on-chain developments in 2023 and explores the evolution of Bitcoin, Ethereum, derivatives, and stablecoins throughout the year.
Summary
-
2023 was an incredible year for digital assets, with Bitcoin rising over 172%, correcting less than 20%, and net capital inflows into BTC, ETH, and stablecoins.
-
The market broke through several key technical and on-chain pricing models this year, with October marking a significant inflection point for institutional capital inflows.
-
Long-term holders currently hold near all-time high levels of Bitcoin supply, and now most Bitcoin is in profit.
-
Major structural shifts occurred in market dynamics, such as Tether reasserting dominance in the stablecoin market, CME futures surpassing Binance, and significant growth in options markets.
2023 was an exceptional year for digital assets, with Bitcoin’s market cap growing by +172%. The broader digital asset ecosystem also performed strongly, with Ethereum and the wider altcoin sector seeing market cap gains exceeding 90%.
This highlights the rising dominance of Bitcoin, typically seen during periods when the market recovers from prolonged bear markets (such as 2021–22). Ethereum underperformed relatively, despite successfully completing the Shanghai upgrade and growth in its Layer-2 ecosystem, with the ETH/BTC ratio falling to a multi-year low of around 0.052.
Although digital assets significantly outperformed traditional assets such as equities, bonds, and precious metals throughout the year, the rebound since late October accounted for much of the price appreciation. It first broke through the psychologically important $30,000 level, along with numerous other critical price thresholds.
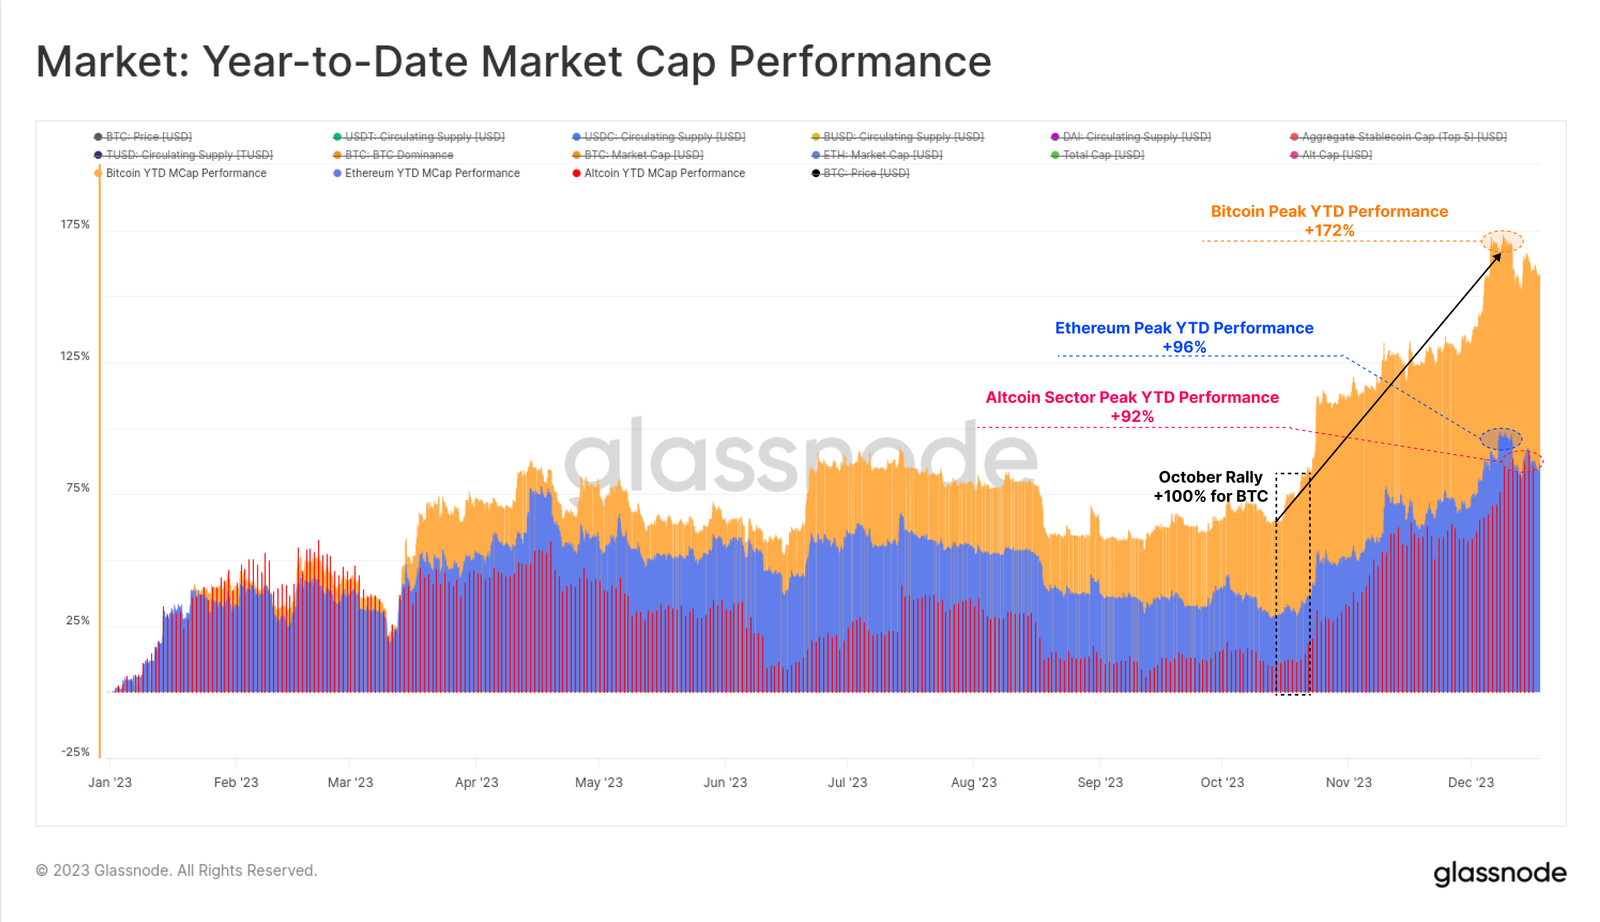
Shallow Market Corrections in 2023
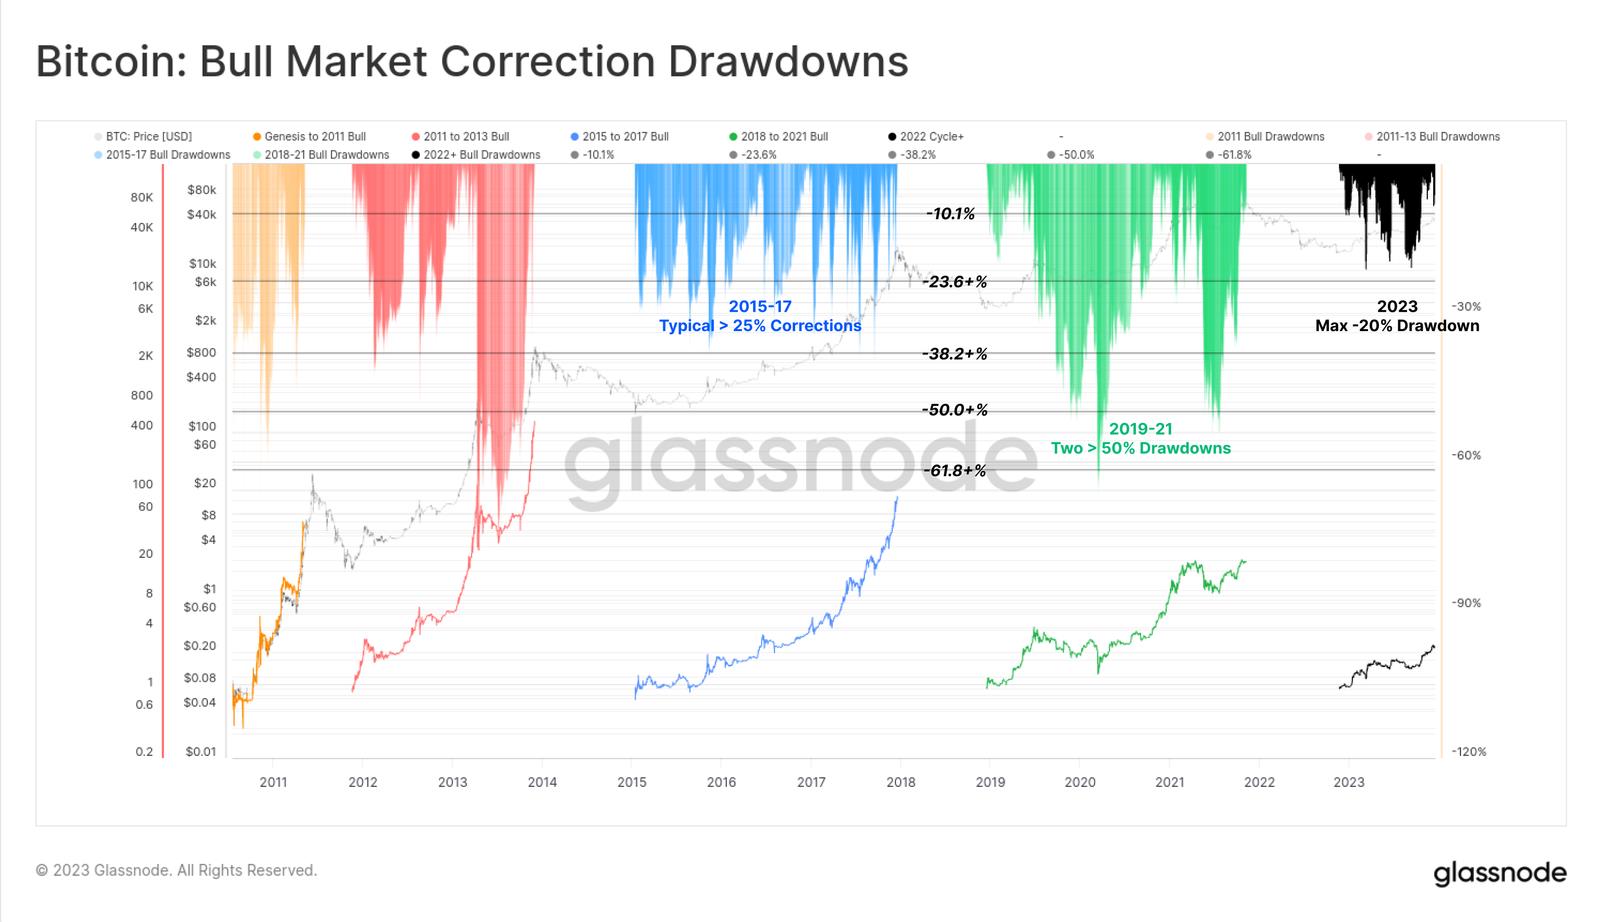
One notable feature of the 2023 market was the exceptionally shallow depth of all price pullbacks and corrections. Historically, BTC bull run recoveries and uptrends typically see drawdowns of at least -25% from local highs, sometimes even exceeding -50%.
However, the deepest closing drawdown in 2023 was only -20% below local peaks, indicating strong buyer support and consistently favorable supply-demand balance throughout the year.
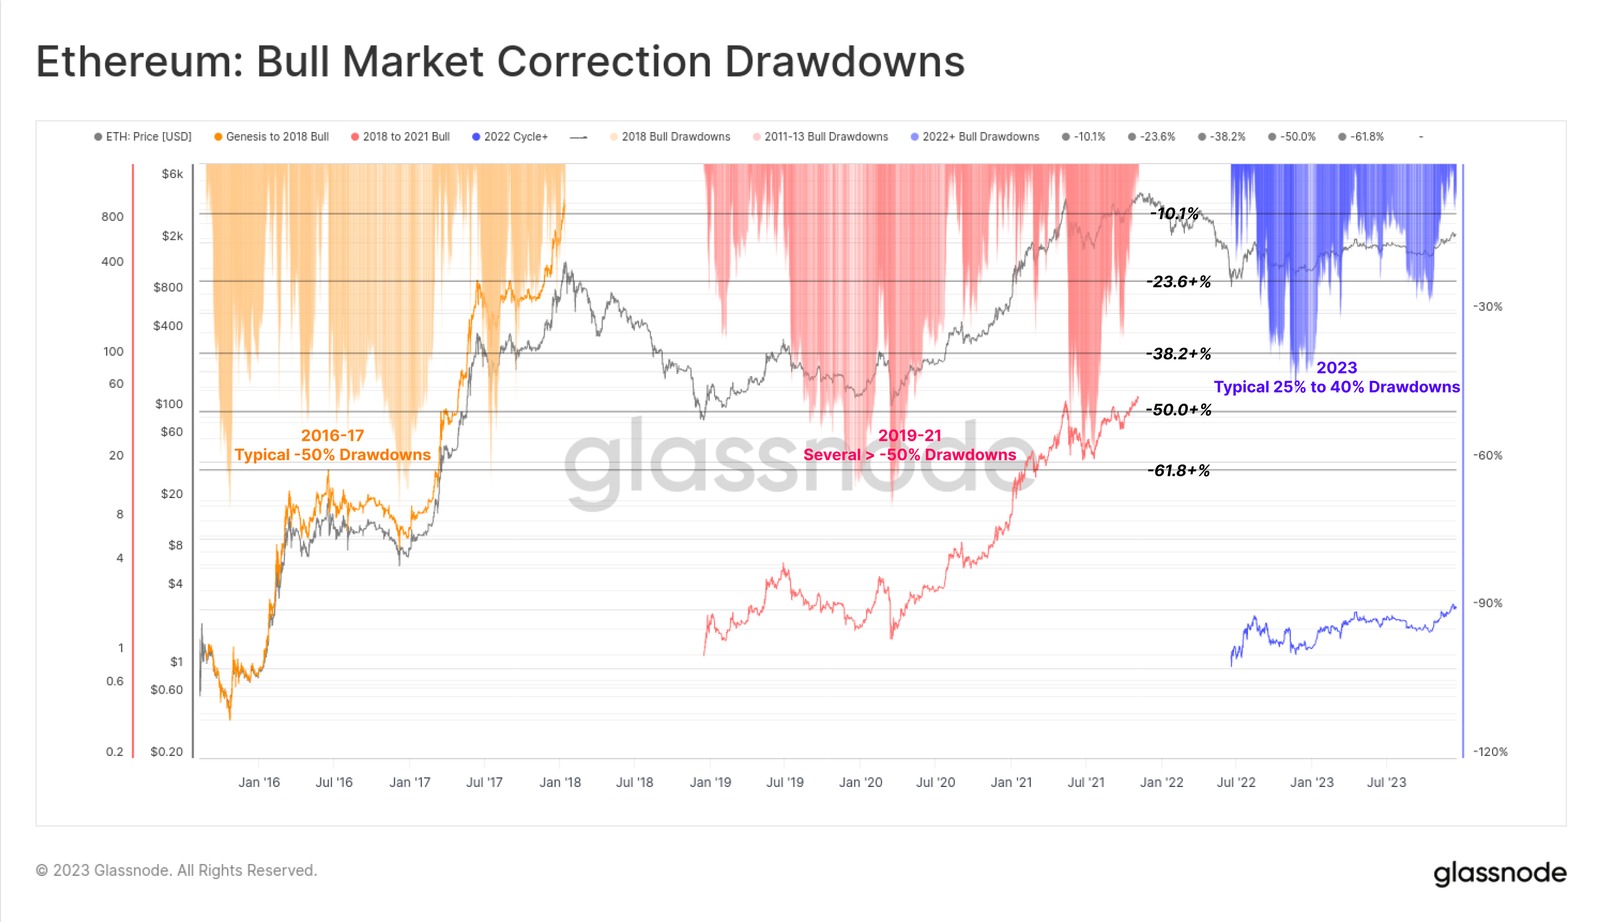
Ethereum also experienced relatively shallow adjustments, with the deepest correction reaching -40% in early January. Despite weaker performance relative to BTC, this paints a constructive picture where supply reductions caused by the Ethereum merge are meeting relatively elastic demand.
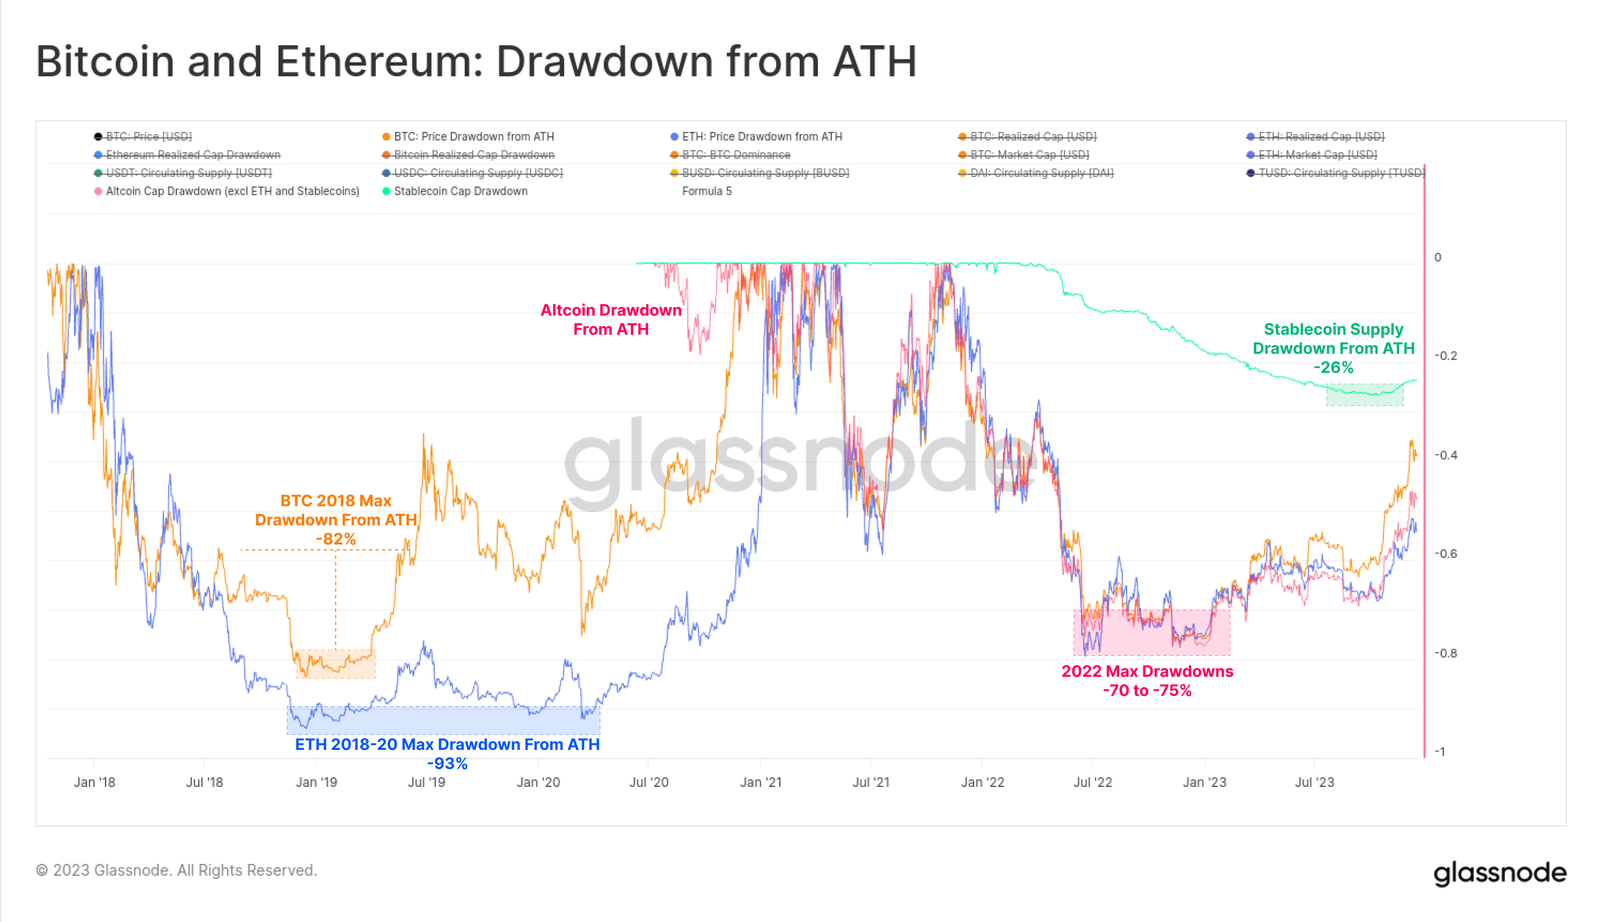
The severity of the 2022 bear market was slightly less brutal than the 2018–20 cycle, with most major digital assets starting 2023 down approximately -75% from their all-time highs (ATH). Strong performance since the lows has recovered much of these losses. Major assets are currently -40% (BTC), -55% (ETH), -51% (altcoins excluding ETH and stablecoins) and stablecoin supply (-24%) below their ATHs.
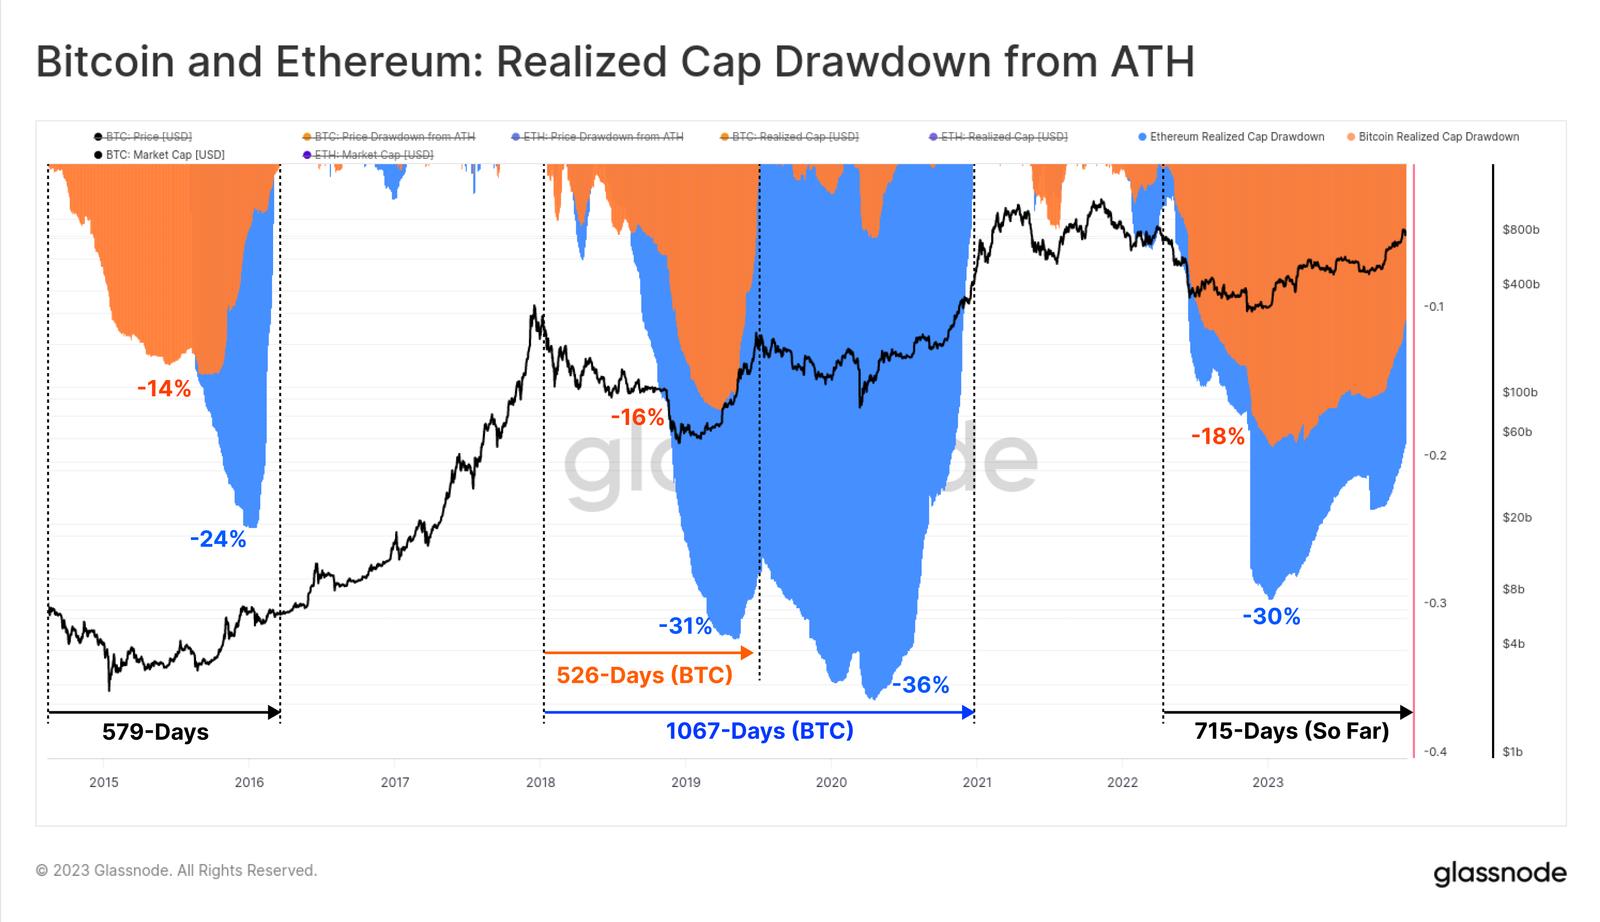
From an on-chain perspective, the realized cap of BTC and ETH provides an excellent tool for tracking capital recovery flowing into each respective asset. During the 2022 bear market, total realized cap contraction reached levels similar to prior cycles, reflecting net capital outflows of -18% for BTC and -30% for ETH.
However, the pace of capital inflow recovery has been much slower. Bitcoin’s realized cap surpassed 100% ATerH (Note: This metric refers to the recovery status of Bitcoin’s realized market value at a specific point in time) 715 days ago. In contrast, previous cycles fully recovered market value within about 550 days.
Breaking Through the $30K Resistance Level
The Bitcoin market overcame multiple technical and on-chain pricing models this year, underscoring just how strong the performance has been. At the start of the year, a short squeeze in January pushed prices above the 200W-SMA 🟠, which had effectively capped prices since June 2022. This rally also broke above the 200-day moving average 🔵, before encountering resistance at the 200-week moving average 🔴 in March. Bitcoin then consolidated between the 200-day MA 🔵 and the Realized Price 🟢 until August—one of the least volatile periods in Bitcoin’s history. A rapid deleveraging event subsequently dropped prices from $29K to $26K in a single day, briefly breaking both long-term technical averages. The October rebound truly changed the game, breaking through all remaining pricing models and crossing the critical psychological $30K threshold. Since then, Bitcoin has reached a yearly high of $44.5K and stabilized around $42K at the time of writing.
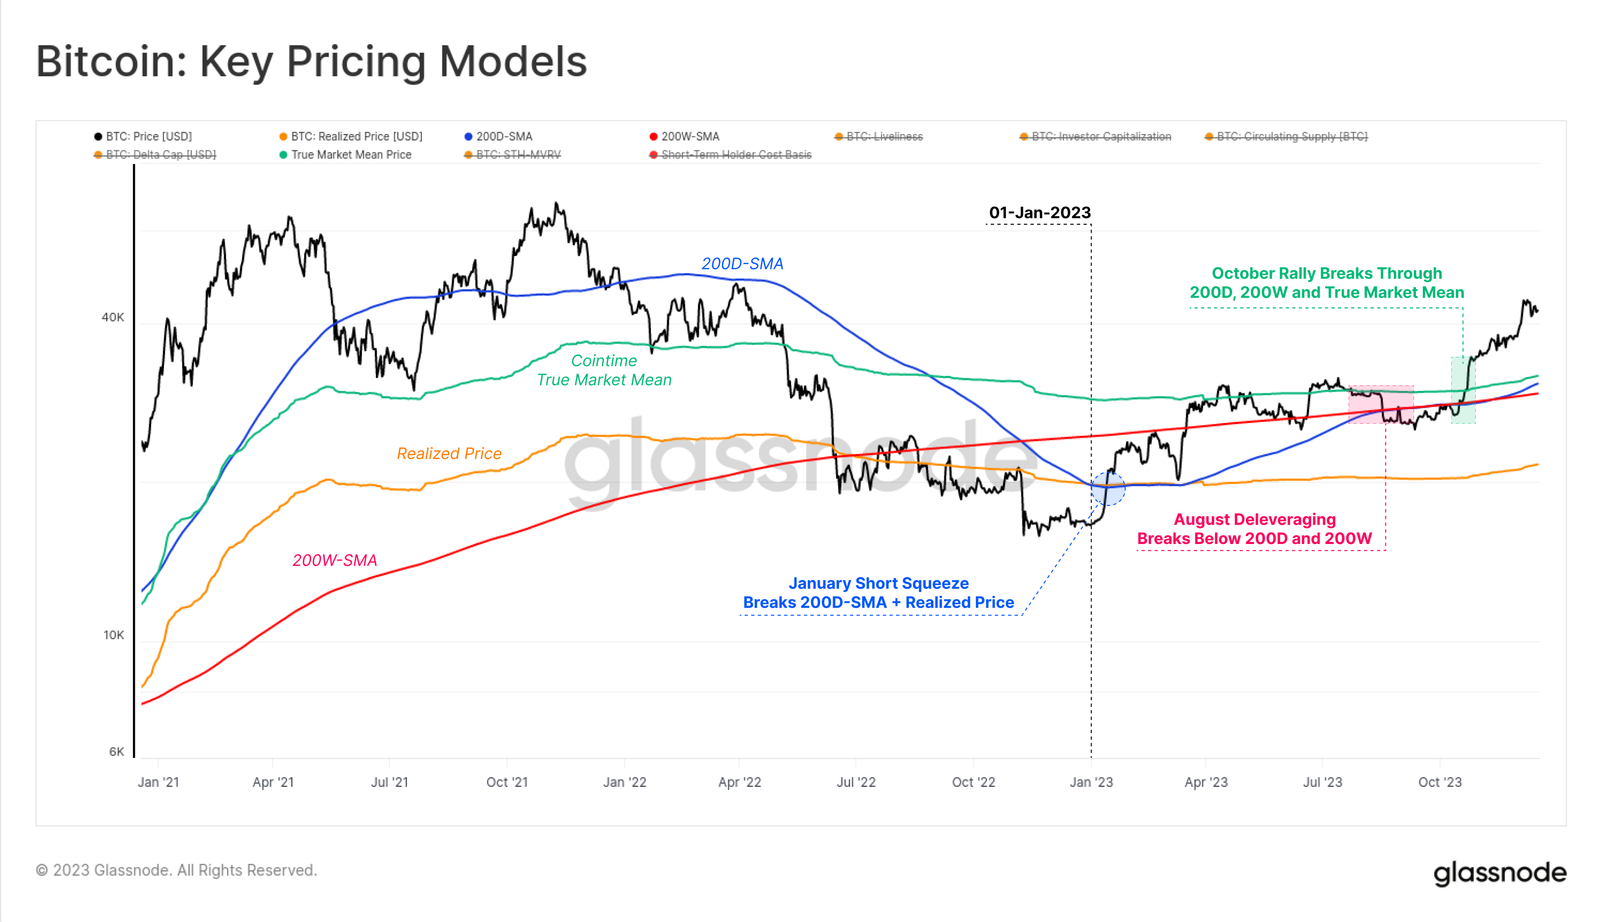
A recurring theme readers may notice throughout this article is how capital flows, market momentum, and performance accelerated since late October. In previous analyses, we explored the relationship between this acceleration and Bitcoin’s price breakout above $30,000, describing it as a transition from a “tentative recovery” phase to an “enthusiastic uptrend.”
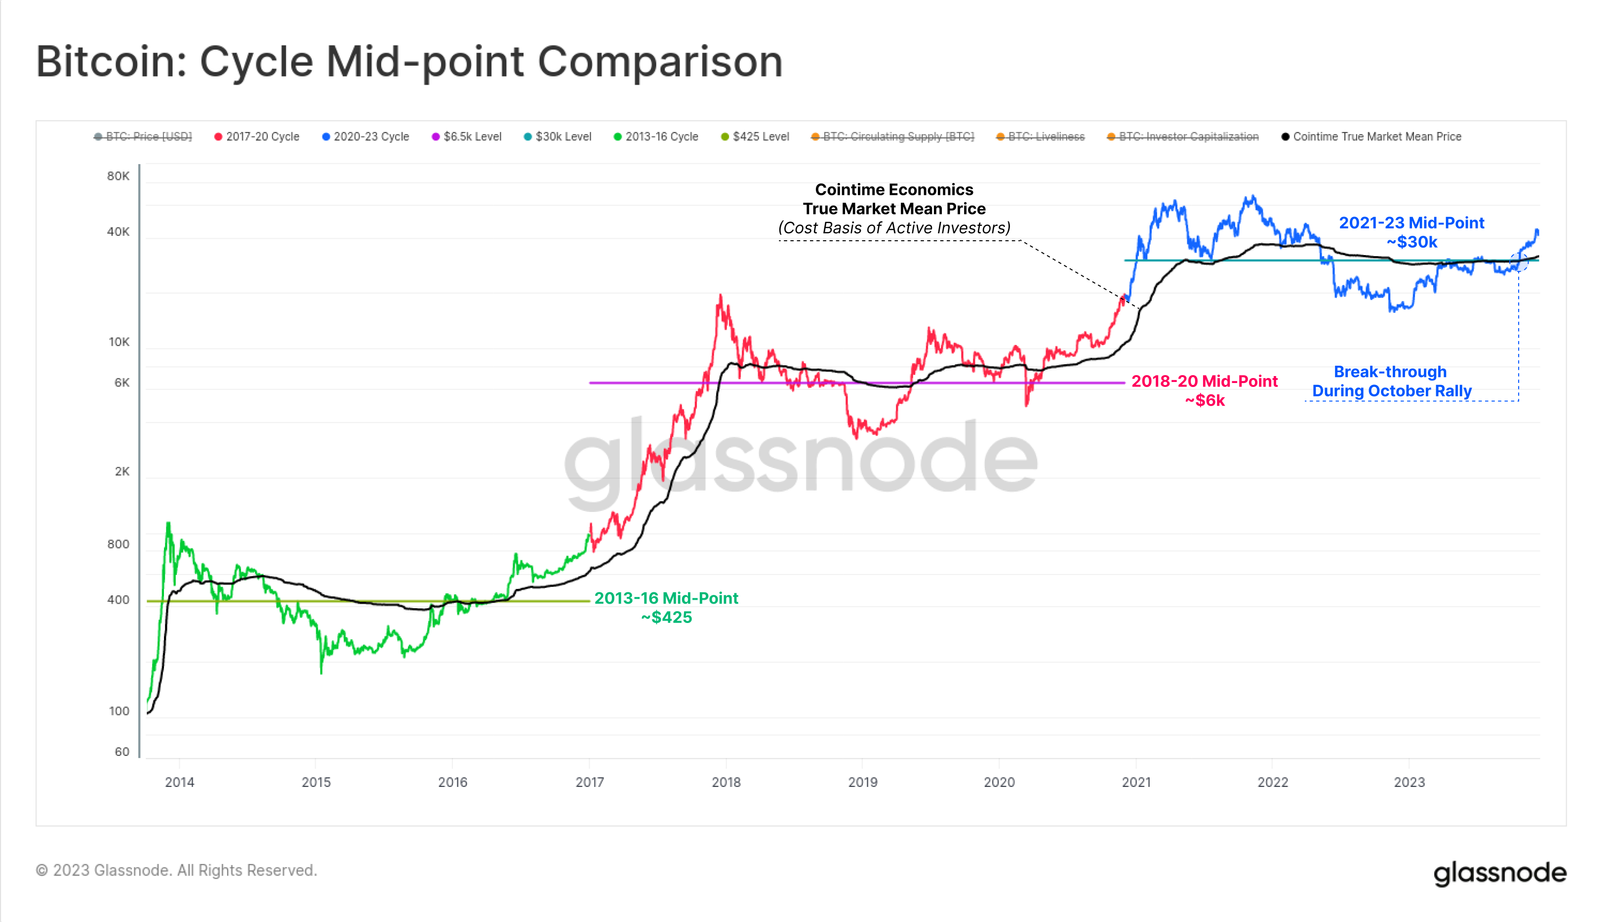
Notably, the October rebound breached two key levels that historically mark such transitions:
-
Technical market midpoint: A broad price zone that acts as support early in bear markets and resistance later. In this cycle, $30K was the last major support area before a series of capitulation sell-offs ultimately led to the FTX collapse.
-
Cointime Realized Price: Reflects the cost basis of active investors. This model was developed in our joint research with ARK Invest in the Cointime Economics study.
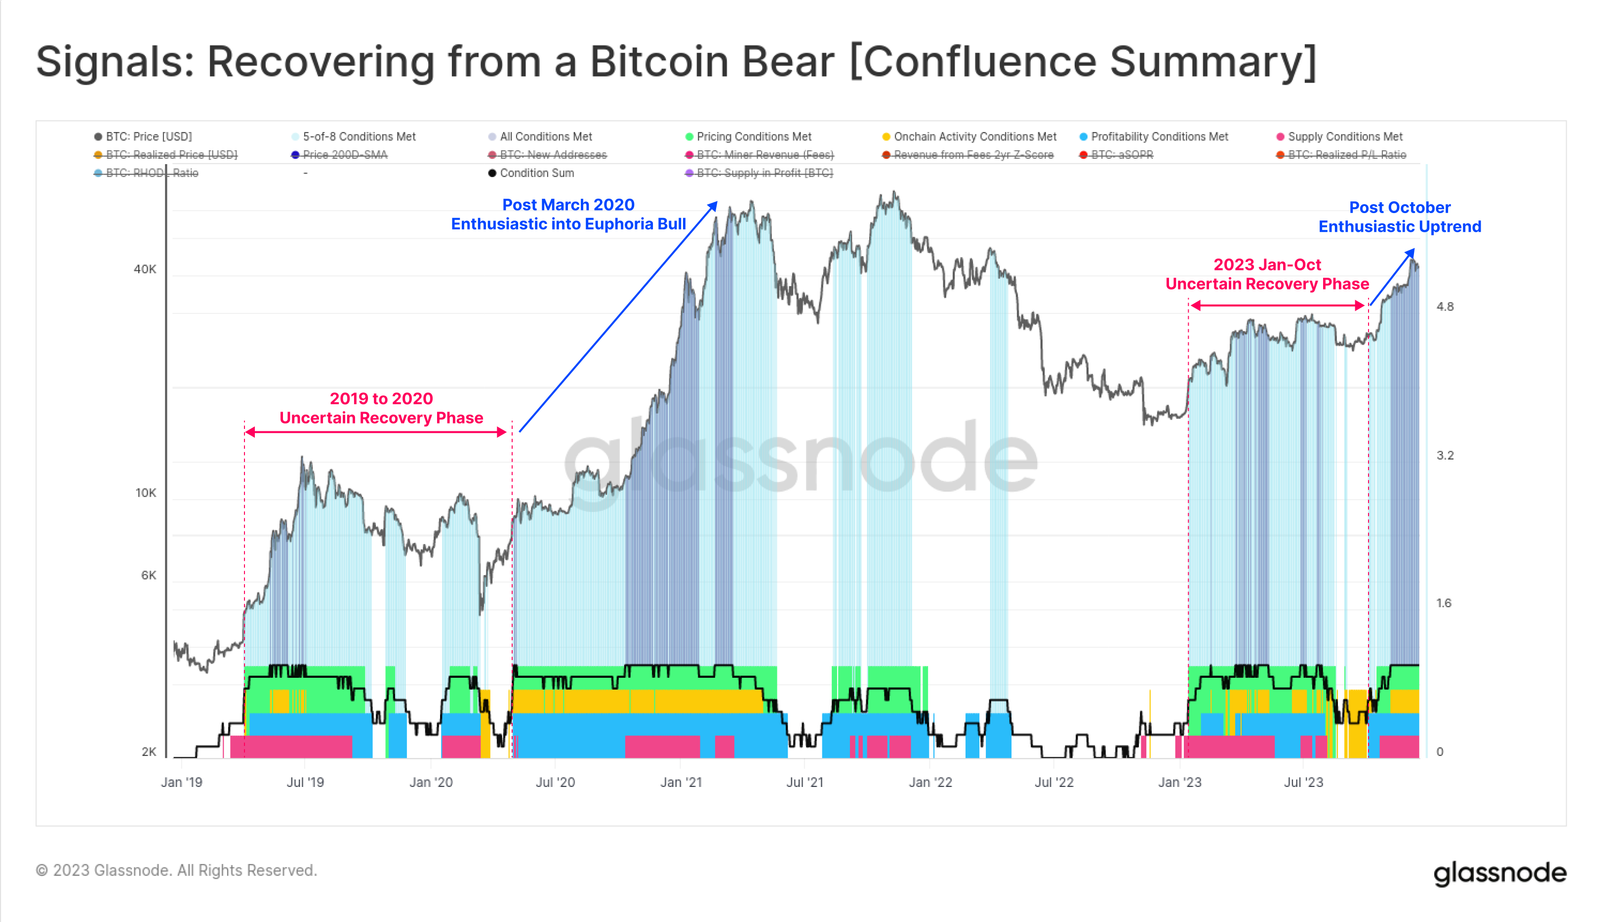
We can also observe a marked shift in the recovery characteristics from Bitcoin bearish signals, as all eight indicators have now entered positive territory since October. For much of 2023, readings were mixed, resembling patterns seen during 2019–20.
With all eight metrics now activated, this suggests the market has entered positively aligned zones across multiple dimensions of Bitcoin’s market structure—typically associated with resilient uptrends.
Increase in Transaction Volume, Fees, and Inscriptions
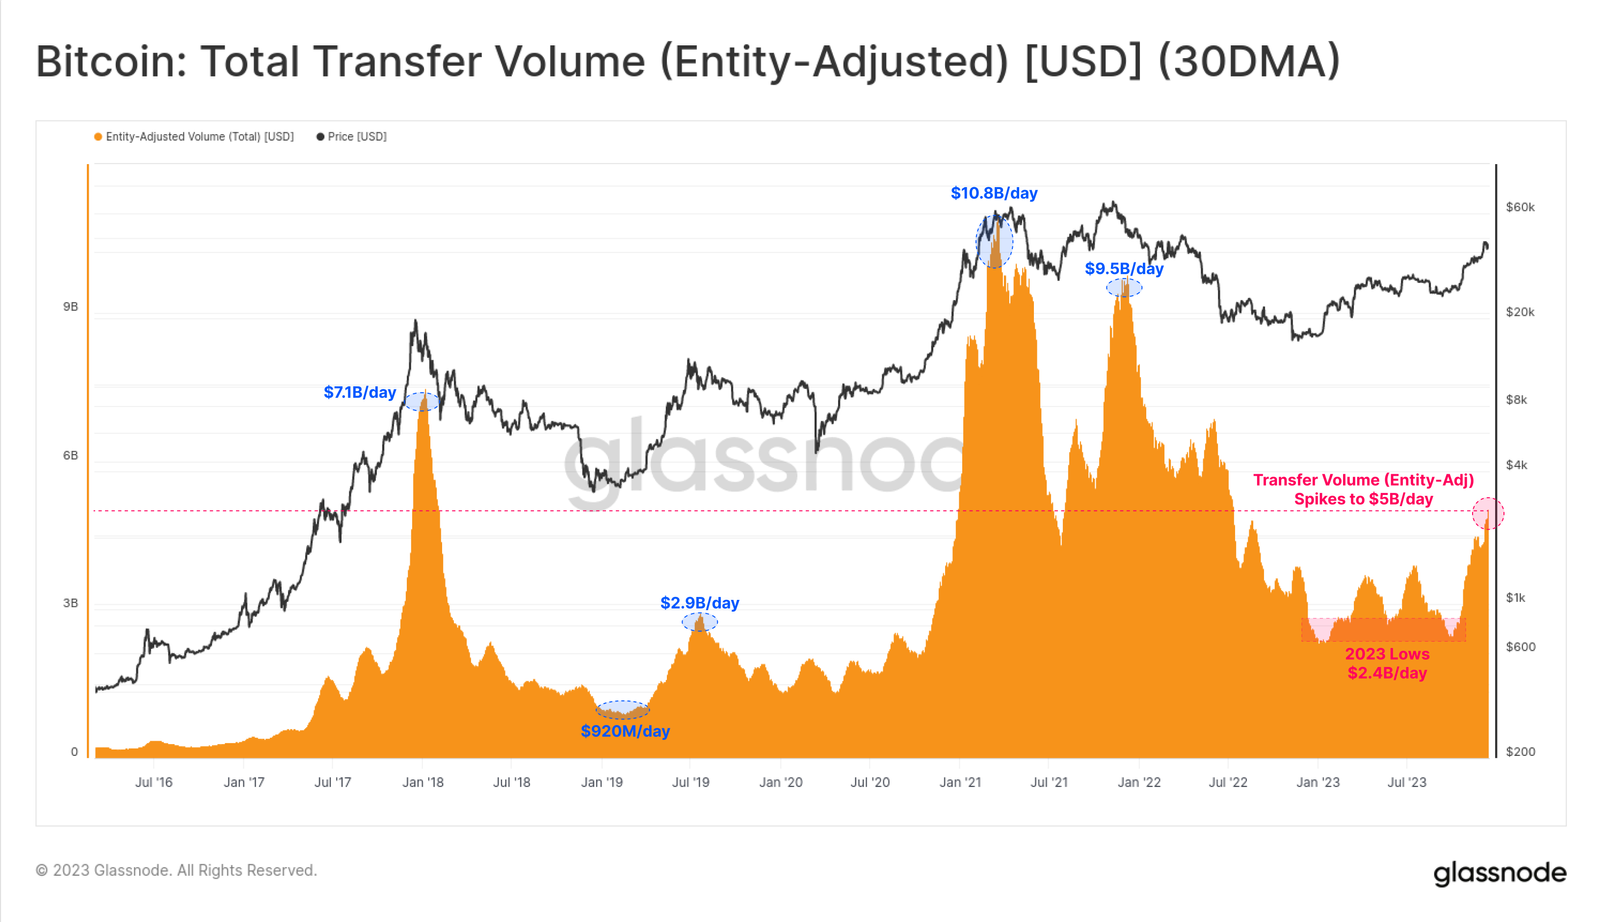
Previously, Bitcoin transaction volume had remained relatively stagnant. The October rebound doubled Bitcoin’s transfer volume from $2.4B/day to over $5B/day—the highest level since June 2022.
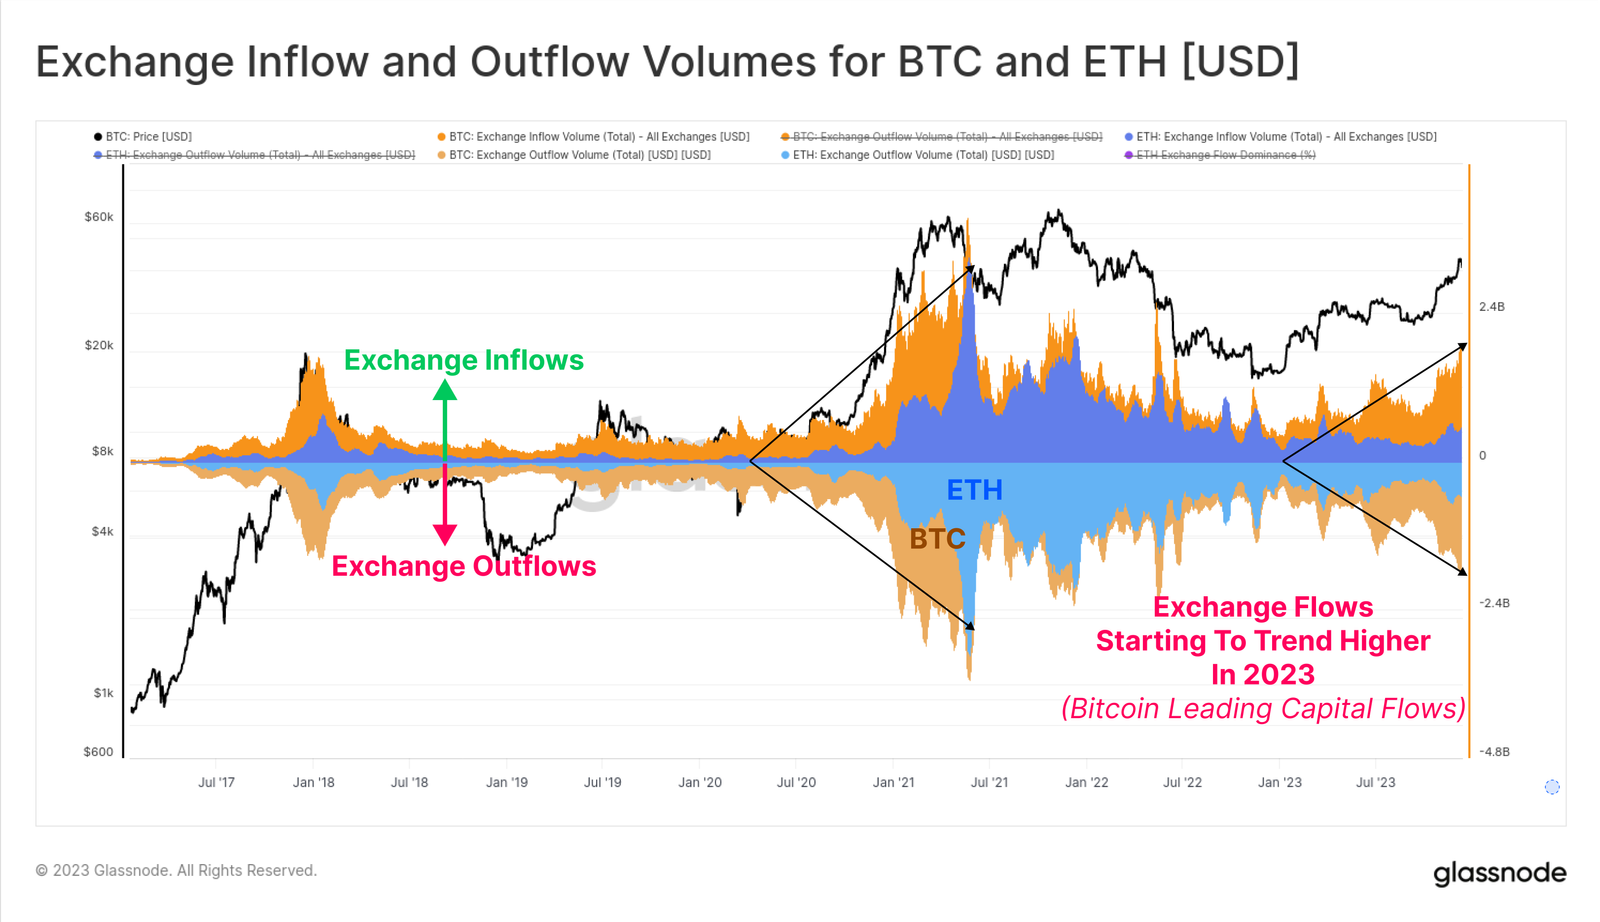
We also observed increased exchange inflows and outflows for both BTC and ETH throughout the year, indicating broadening spot trading interest. Notably, BTC transaction volume grew faster than ETH’s, consistent with observations of rising Bitcoin dominance. It's common for Bitcoin to lead the recovery in investor confidence after prolonged bear markets, and this chart visually illustrates that phenomenon.
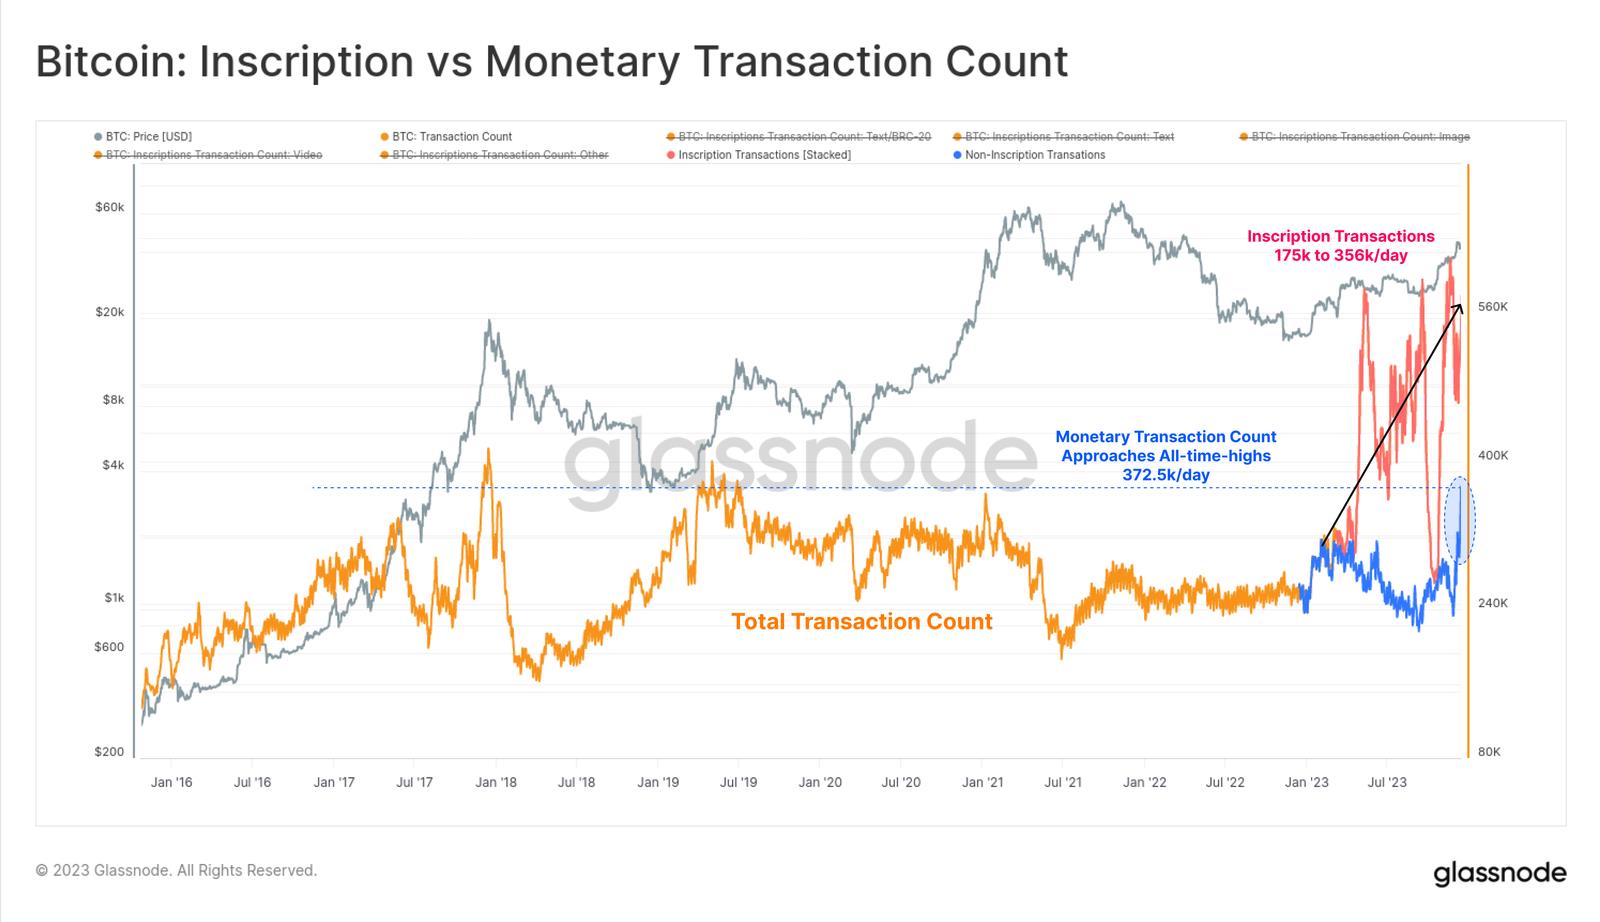
Bitcoin transaction counts hit record highs this year, primarily driven by the unexpected rise of Ordinals and inscriptions. These transactions embed data such as text files and images into the signature section of transactions.
As a result, we can now assess two types of Bitcoin transactions:
-
🟠 Total transaction count
-
🔵 Monetary transaction volume reached multi-year highs, nearly hitting the all-time peak of 372.5k/day.
-
🔴 In addition to traditional monetary transactions, inscription transactions added 175K to 356K daily transactions.
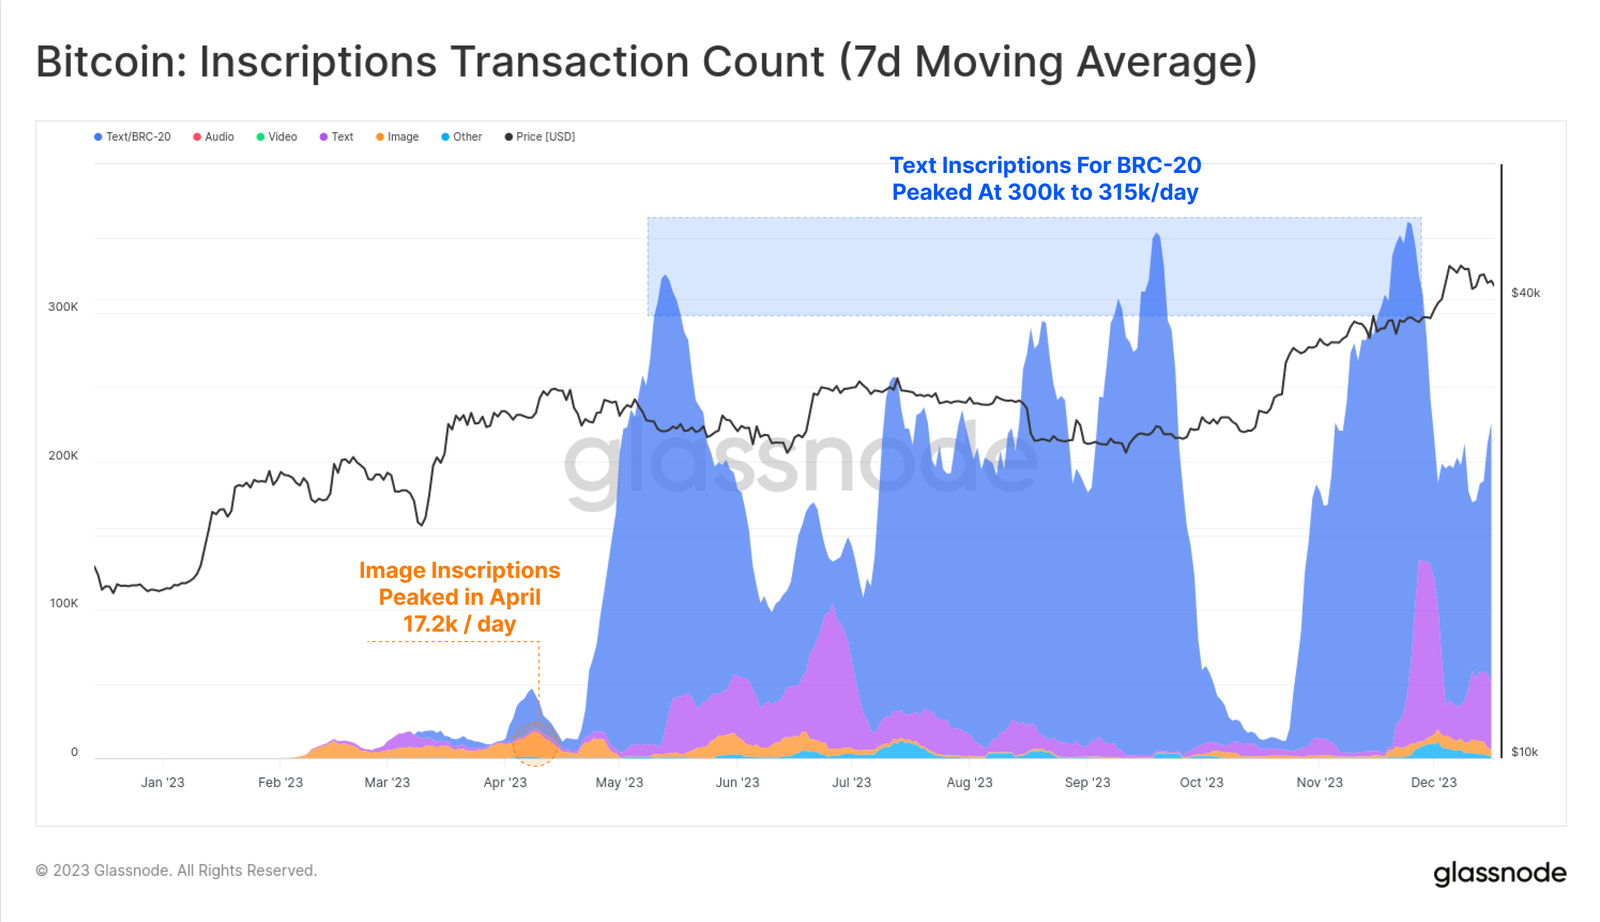
The majority of inscriptions are text-based and linked to the novel BRC-20 🔵 token standard. At its peak, the Bitcoin network saw over 300,000 inscriptions per day, far surpassing the April peak of 172,000 image-based inscriptions 🟠 (images are larger, so inscription costs rose as fees increased).
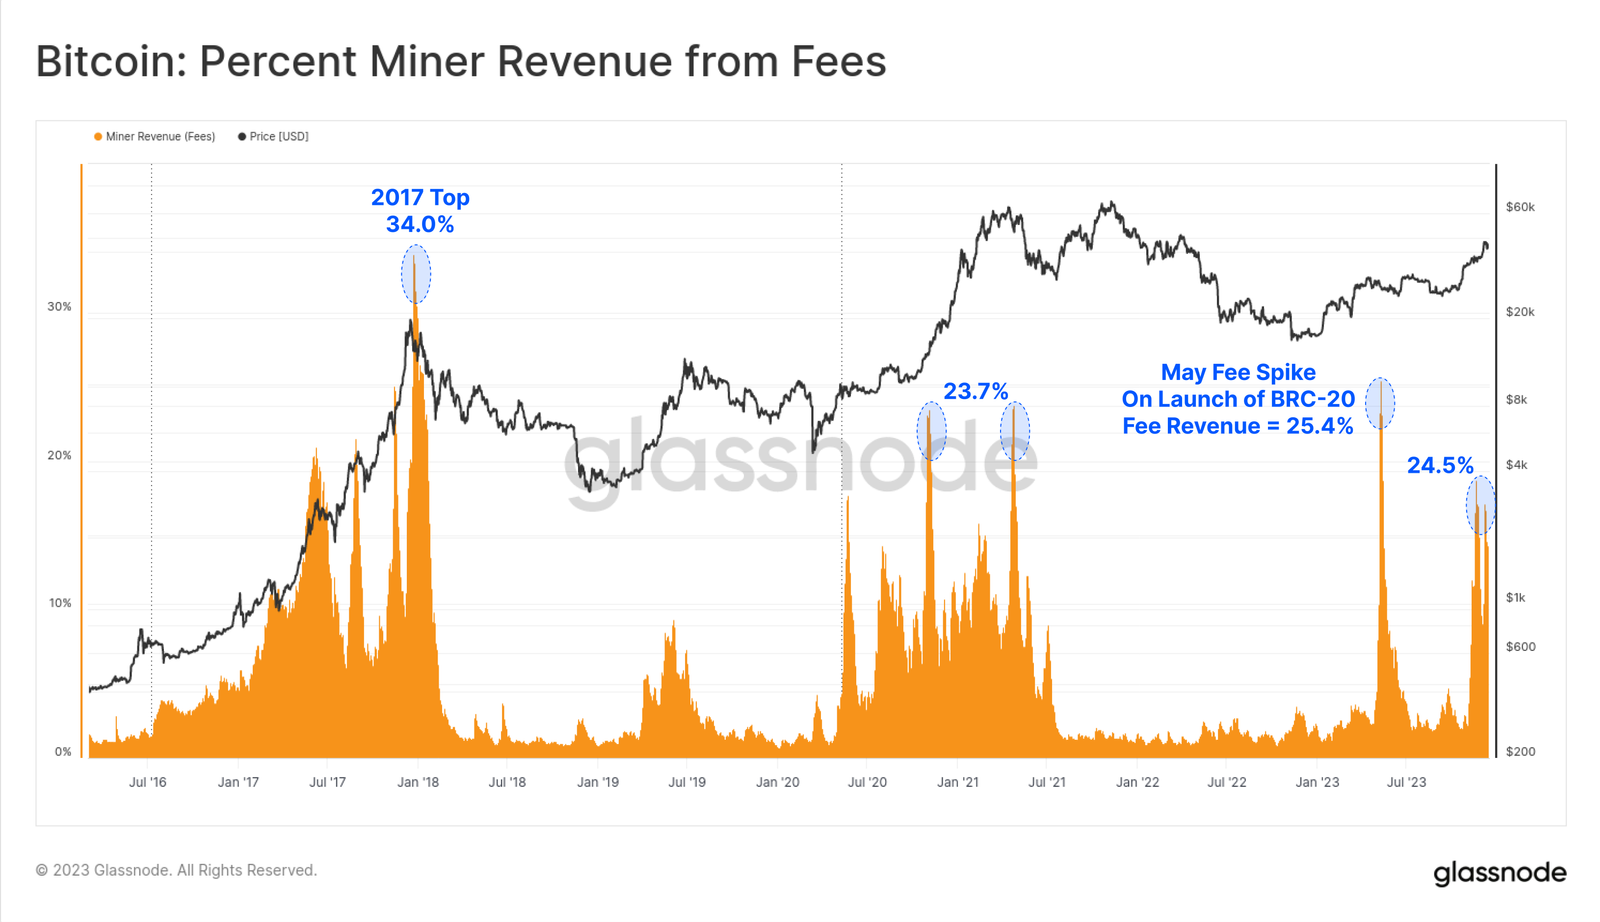
Due to the explosion of activity in the Bitcoin ecosystem, miner fee revenue surged dramatically, with several blocks in 2023 paying fees exceeding the 6.25 BTC block subsidy. There were two major spikes in fee income this year, with fees now accounting for roughly a quarter of miner revenue—comparable to bull market phases in 2017 and 2021.
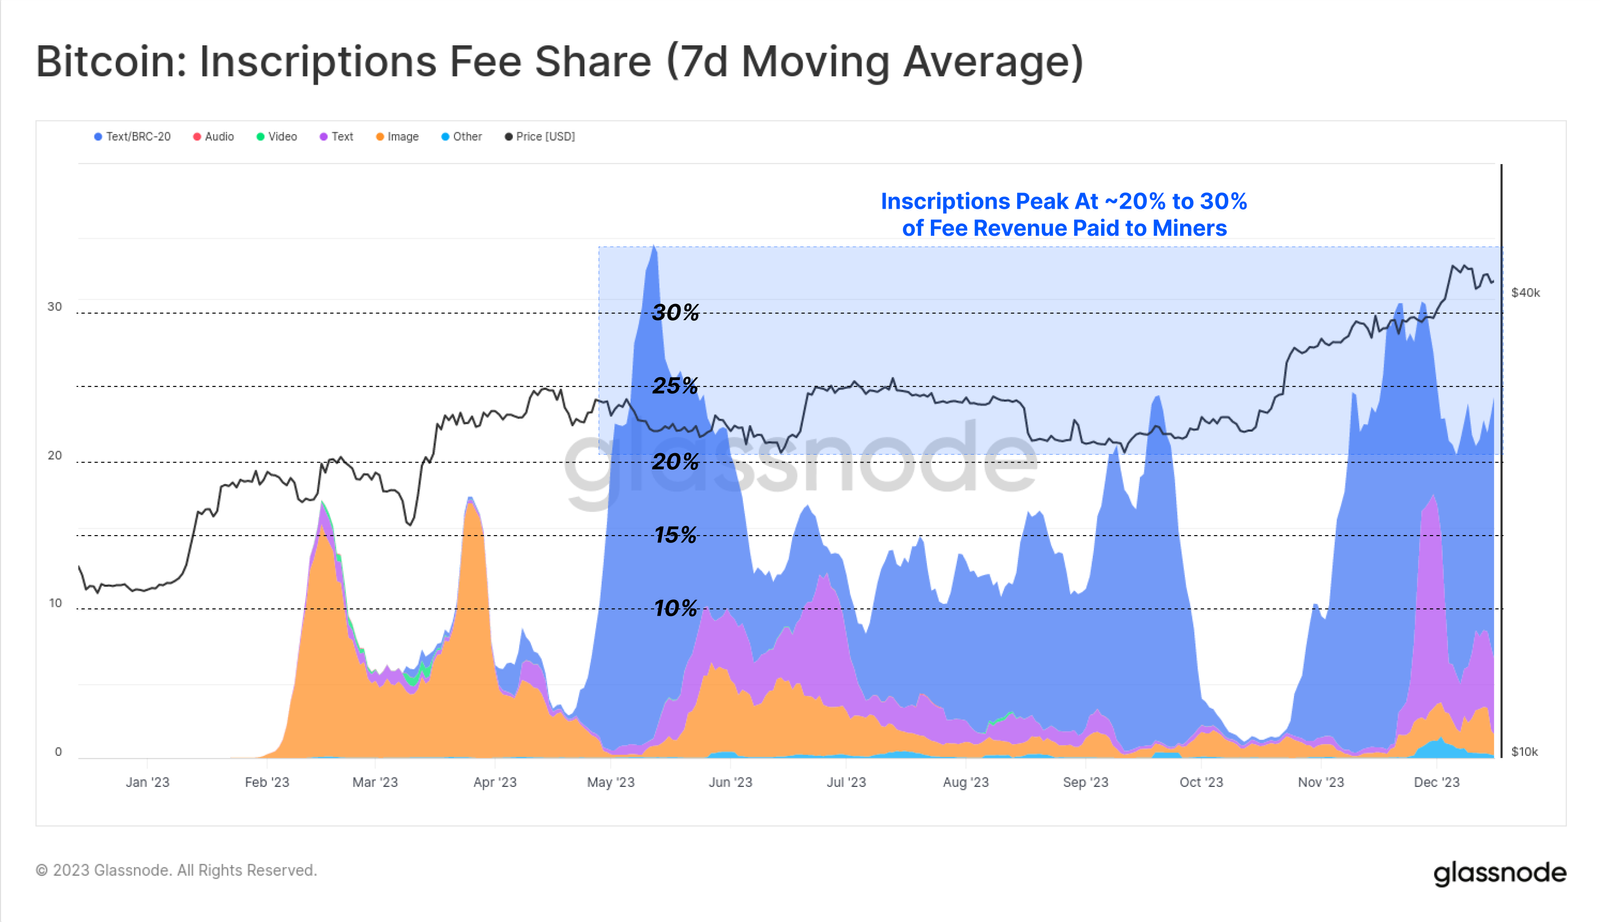
Interestingly, while inscriptions account for 50% of confirmed transactions, they surprisingly consume only 10% to 15% of block space. This is due to the small size of text files and nuances related to SegWit data discounts (a topic covered in WoC-39).
This year, inscription transactions contributed 15% to 30% of total miner transaction fee revenue. This highlights the counterintuitive nature of SegWit discounts: inscription transactions consume a minority share of block space (in bytes), pay a large portion of fees, and yet represent about half of all confirmed transactions.
Effectively, inscriptions and SegWit data discounts allow miners to pack more transactions into maximum-sized blocks, thereby collecting higher fees. If demand for inscriptions persists, the impact on miner revenue could meaningfully improve miner economics—especially with the fourth halving approaching.
Ethereum Ecosystem Data
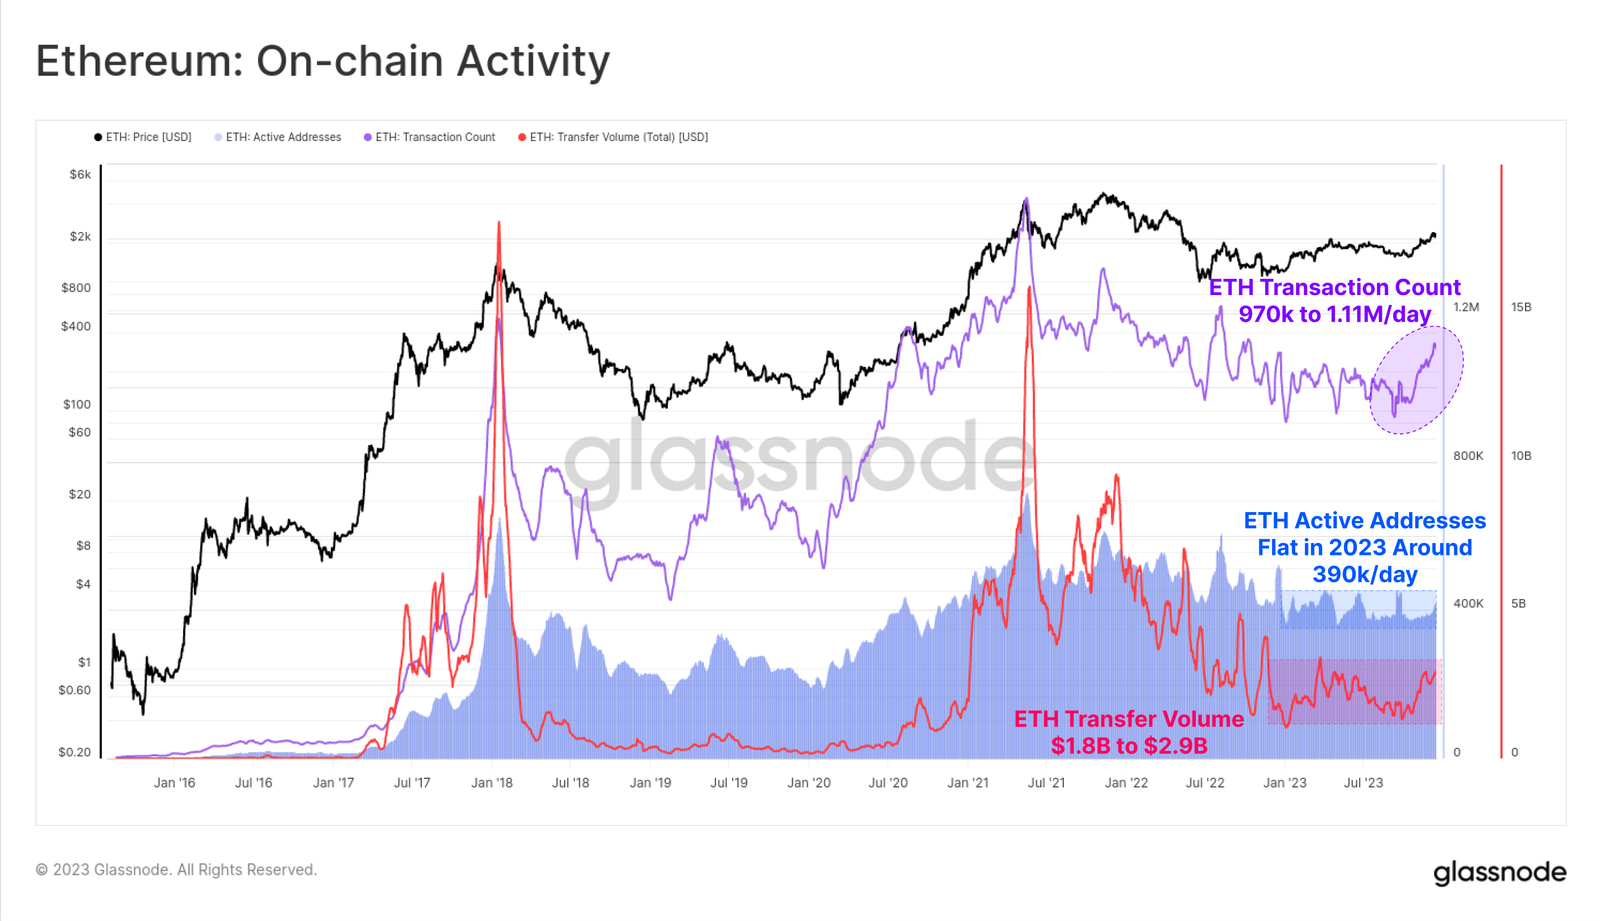
For Ethereum, on-chain activity was somewhat subdued this year, with October again emerging as a clear turning point.
-
Active addresses remained relatively stable at around 390K/day
-
Transaction volume recently increased from 970K/day to 1.11M/day
-
ETH transfer volume rose from $1.8B/day to $2.9B/day
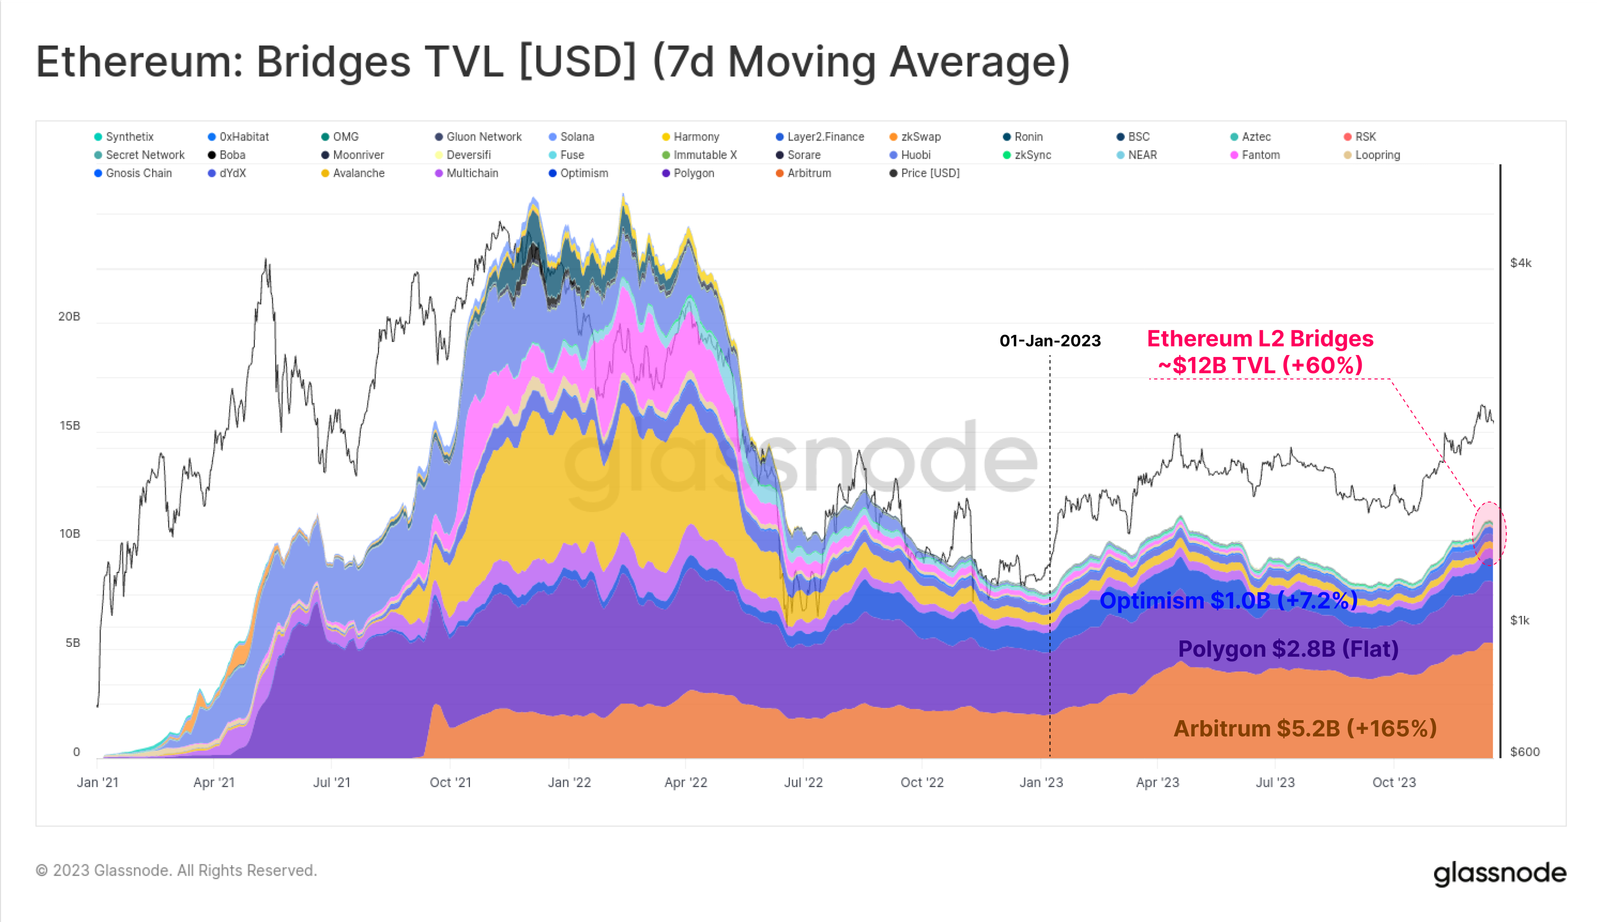
Although Ethereum’s market price underperformed the broader market, its ecosystem continues to expand, mature, and develop. Notably, the total value locked (TVL) in the growing network of Layer-2 blockchains increased by 60%, with over $12 billion now locked in bridges.
These Layer-2 chains aim to scale and extend Ethereum’s block space while anchoring their data and finality back to Ethereum’s mainnet to maintain security.
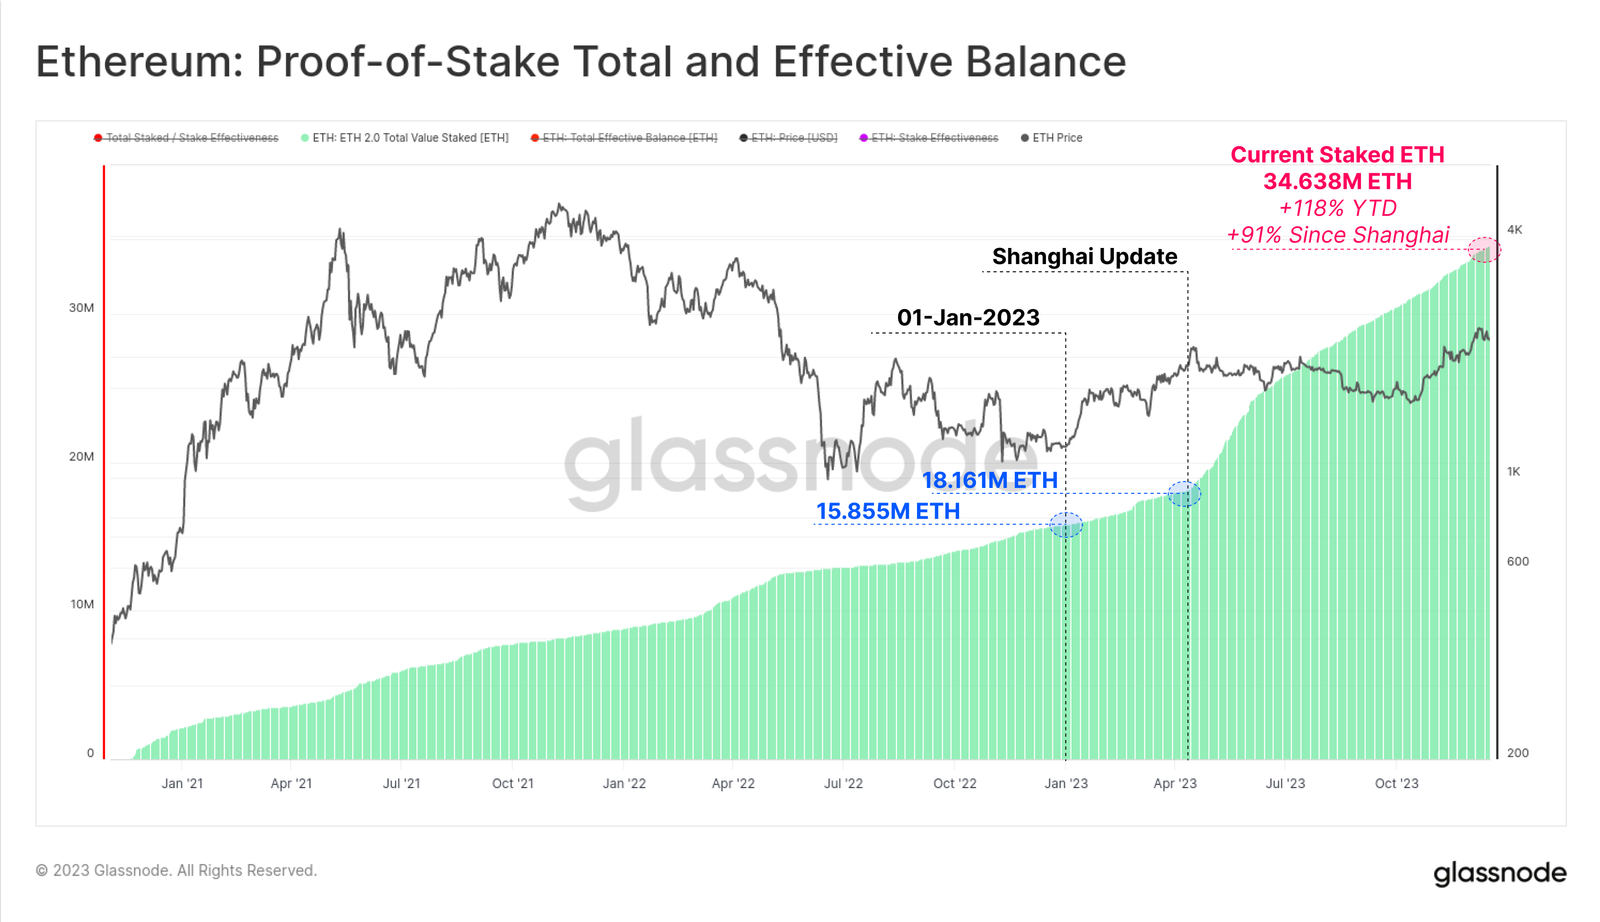
Another key growth area for Ethereum is the total amount of ETH staked through the new Proof-of-Stake consensus mechanism. Since the beginning of the year, staked ETH has grown by 119%, with over 34.638 million ETH now locked in staking protocols. The Shanghai upgrade was also successfully launched in April, allowing stakers to withdraw funds for the first time since the Beacon Chain launched in December 2020, reshuffling staking providers and setups.
Looking Ahead
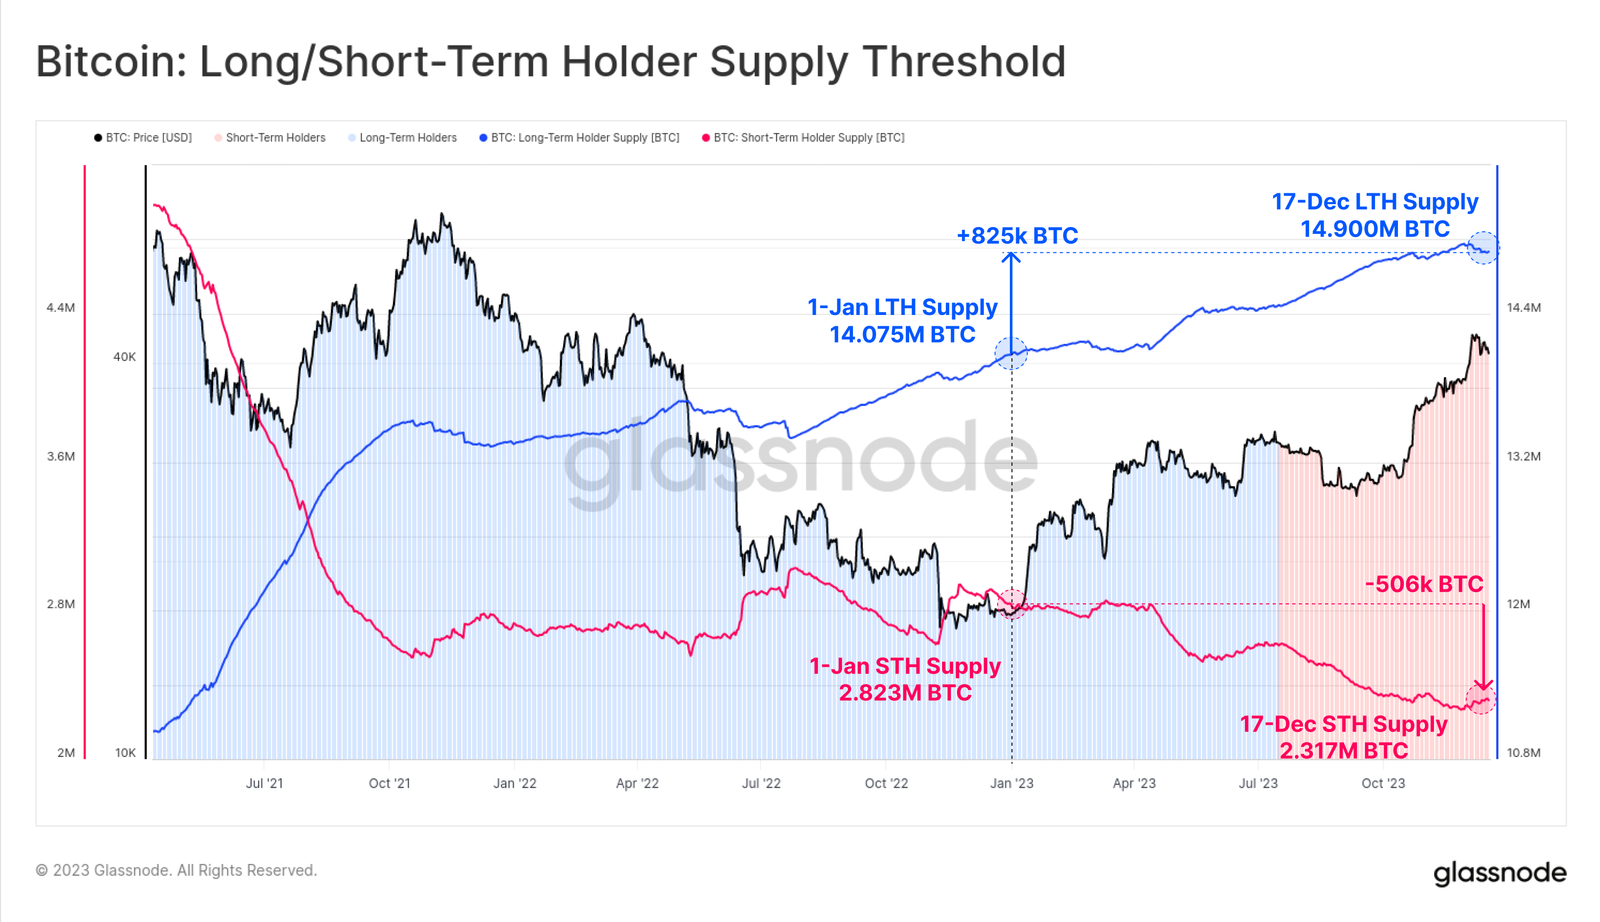
Despite strong price performance, a large portion of Bitcoin remains dormant, held in investor wallets as long-term holdings. Out of the total circulating supply of 19.574 million BTC, more than 14.9 million (76.1%) are held outside exchanges and have not moved for over 155 days—an increase of 825,000 BTC year-to-date. This has brought the short-term holder supply down to a historic low of 2.317 million BTC.
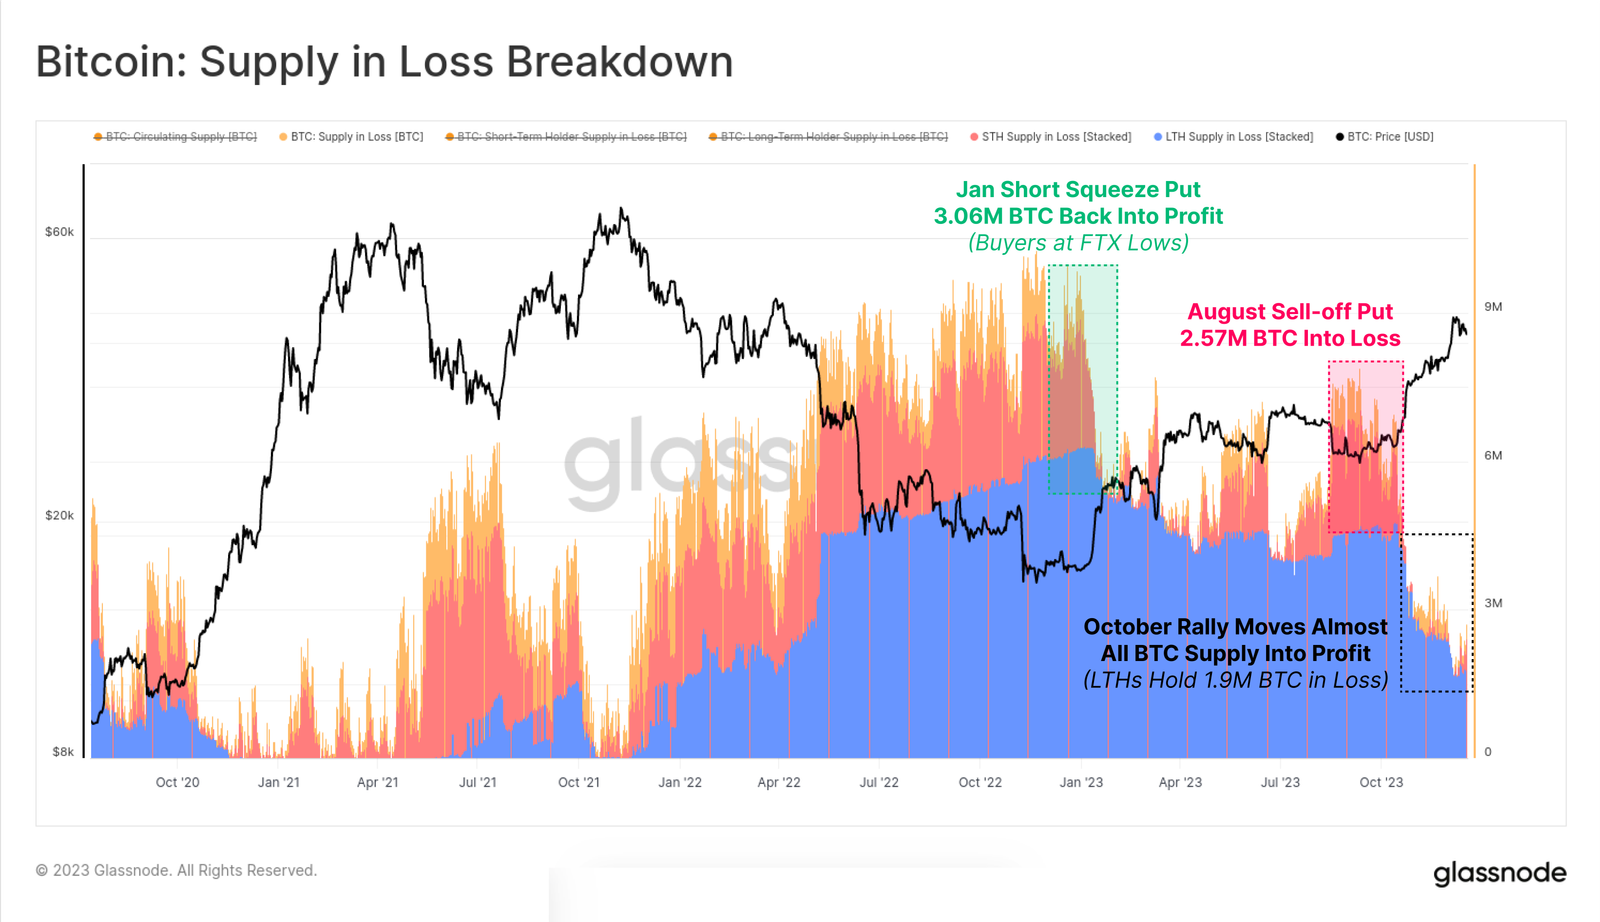
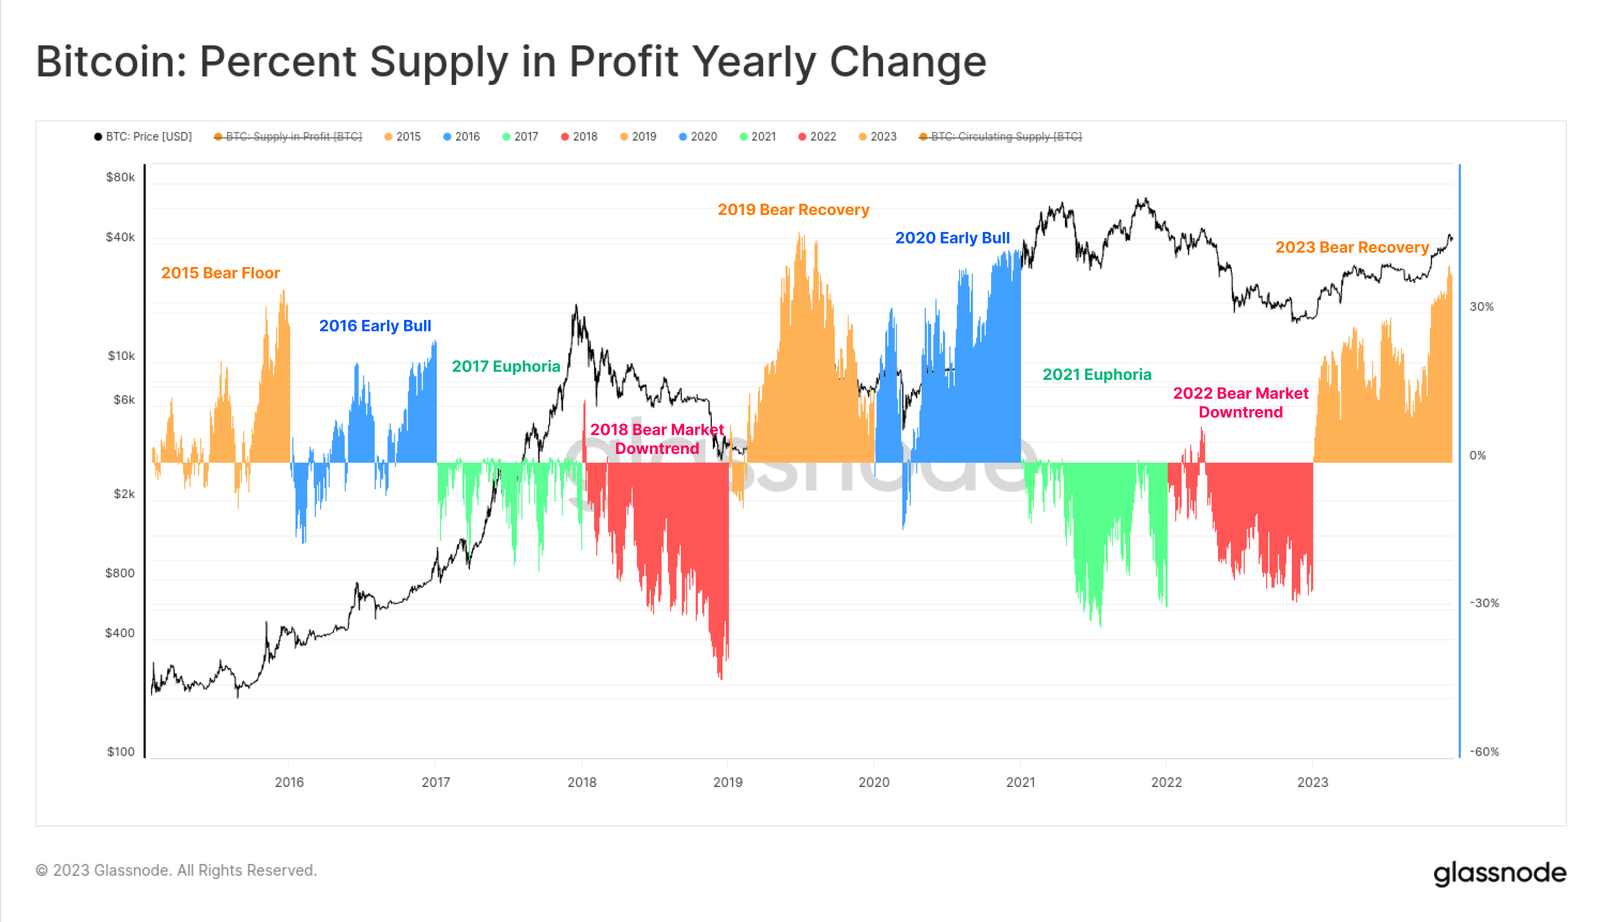
As the market recovers, the vast majority of investors now hold tokens in profit. The chart below shows that the total amount of coins held at a loss has declined to around 1.9 million BTC, mostly held by long-term holders who bought near the 2021 peak.
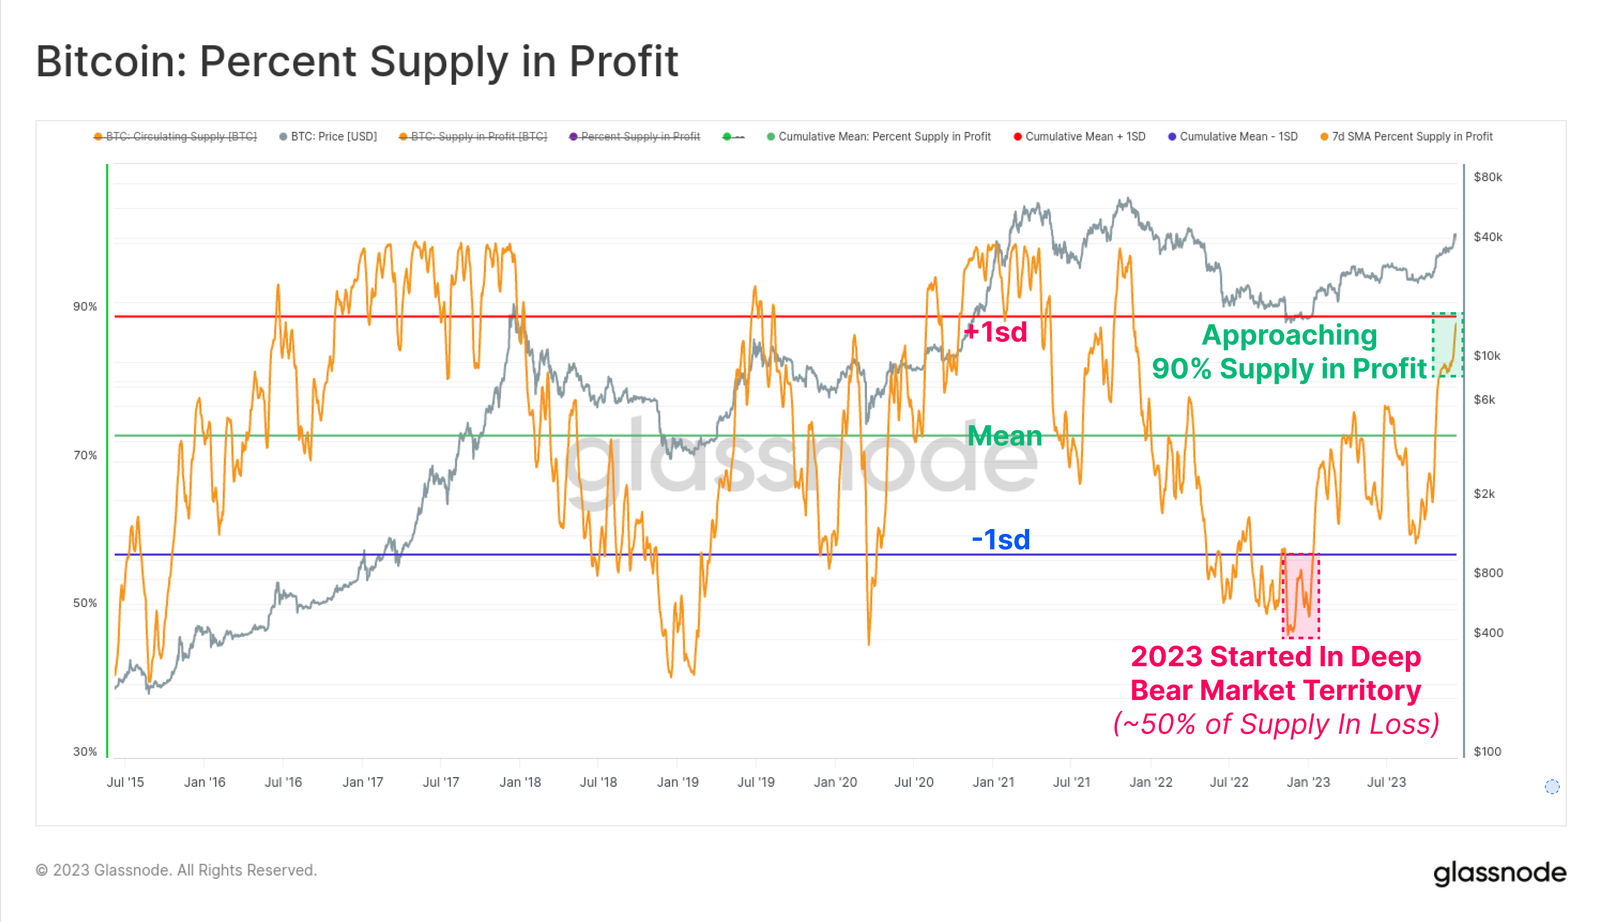
Conversely, the supply in profit has now exceeded 90% of circulating supply, surpassing historical averages after the October rebound. Given that over 50% of supply was underwater at the start of 2023, this represents one of the fastest recoveries in history (second only to the 2019 rebound).
The chart below shows annual percentage changes in supply in profit since 2015. While annual segmentation isn't perfect, Bitcoin’s classic four-year cycle reveals some interesting patterns:
-
🟠 Bear market bottoms/recovery phases see sharp increases in supply in profit, as coins sold near lows return to profitability.
-
🔵 Early bull markets, where broad uptrends push most coins into profit and drive toward new all-time highs.
-
🟢 Late bull markets, where the market reaches all-time highs, nearly all tokens are in profit, and market exhaustion approaches.
-
🔴 Major bear markets, following market peaks, where large volumes of tokens fall into loss.
While simple in structure, this framework does highlight similarities in progress between 2015–16, 2019–20, and 2023 to date.
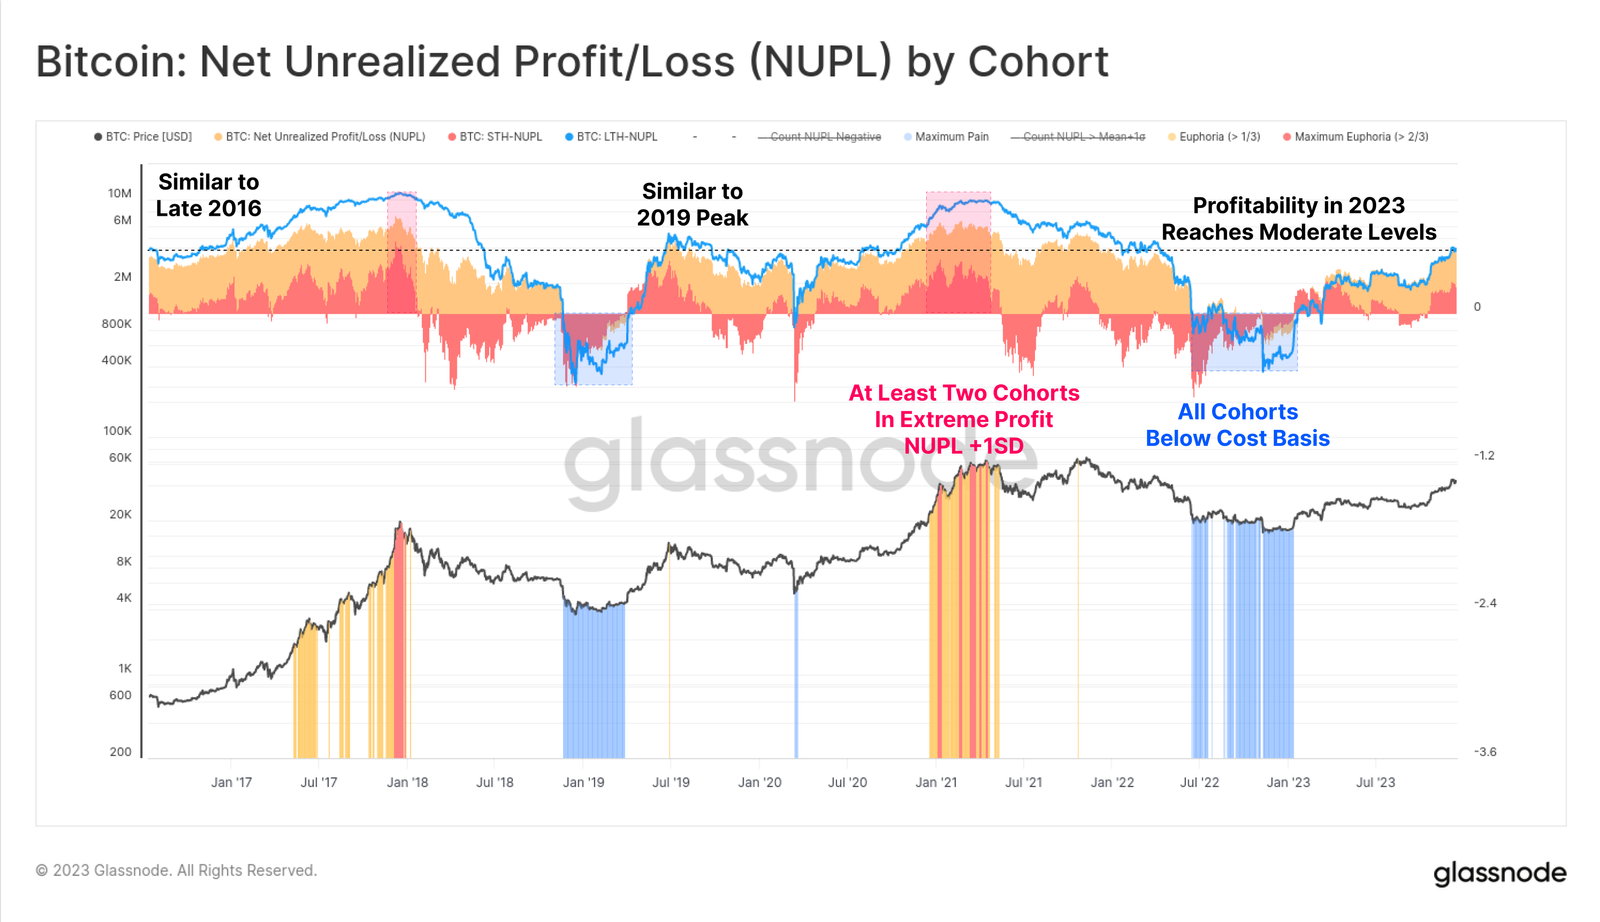
Finally, regarding investor profitability, 2023 shifted long-term holders, short-term holders, and average holders from unprofitable to moderately profitable positions. NUPL indicators for each cohort have not yet reached euphoric highs but are clearly above their respective breakeven levels.
Maturing Derivatives Markets
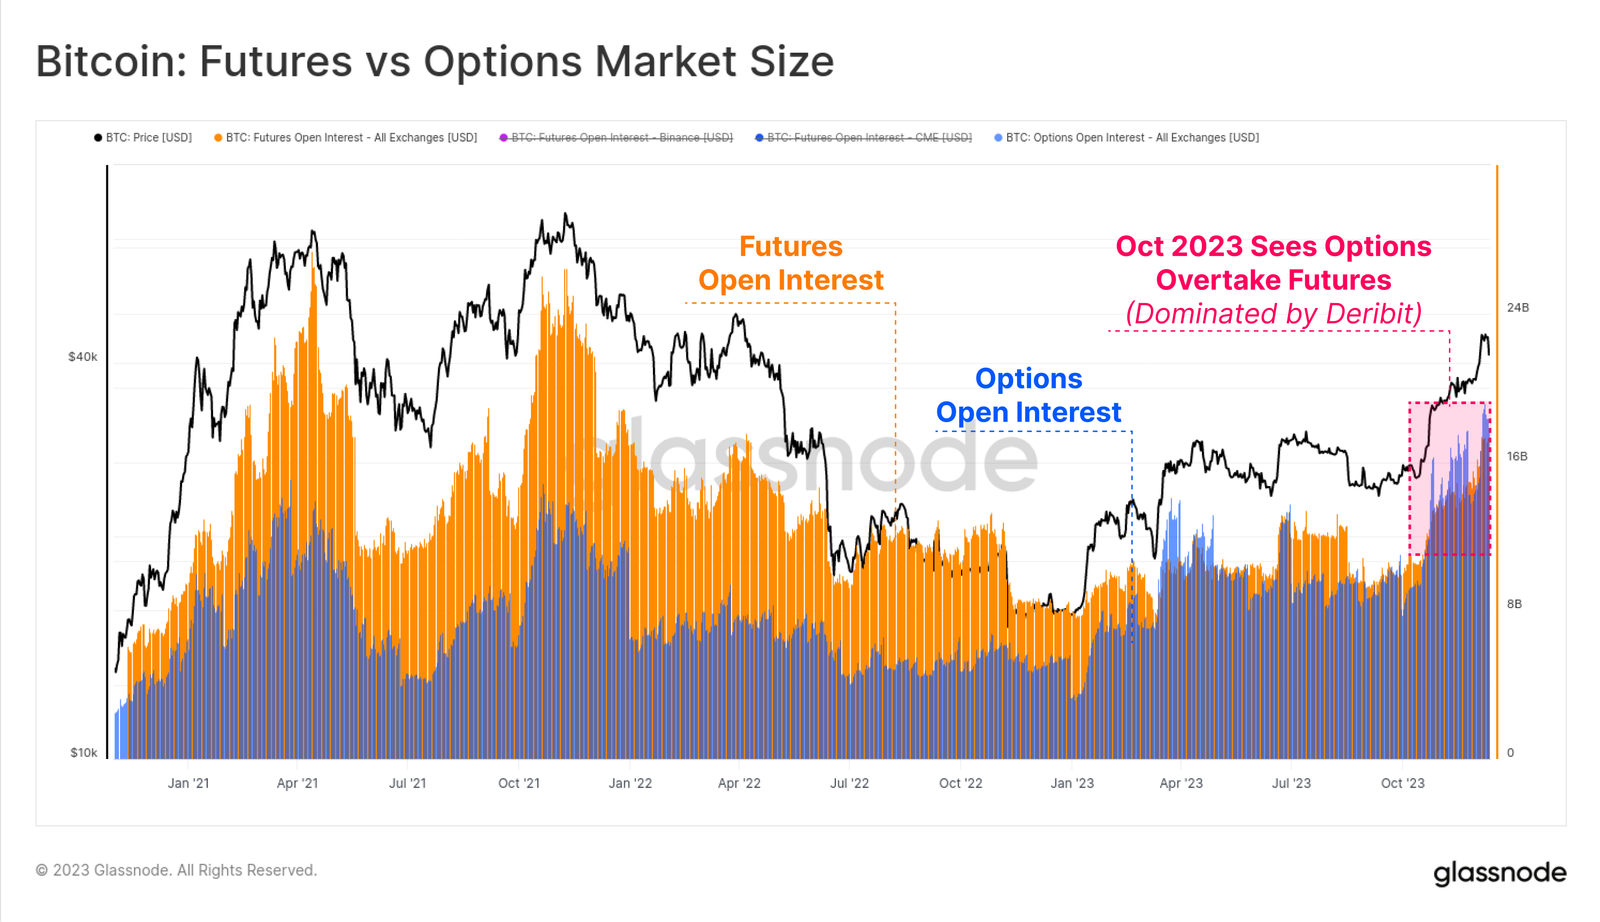
A defining feature of the 2020–23 cycle has been the emergence of futures and options markets as primary venues for price exposure and liquidity. 2023 was pivotal, as open interest in the options market expanded to match—and at times exceed—that of the futures market.
Both now boast open interest between $16B and $20B, with Deribit continuing to dominate (over 90%) the options space. This reflects growing institutional interest in Bitcoin, with traders deploying more sophisticated strategies, risk management, and hedging via options markets.
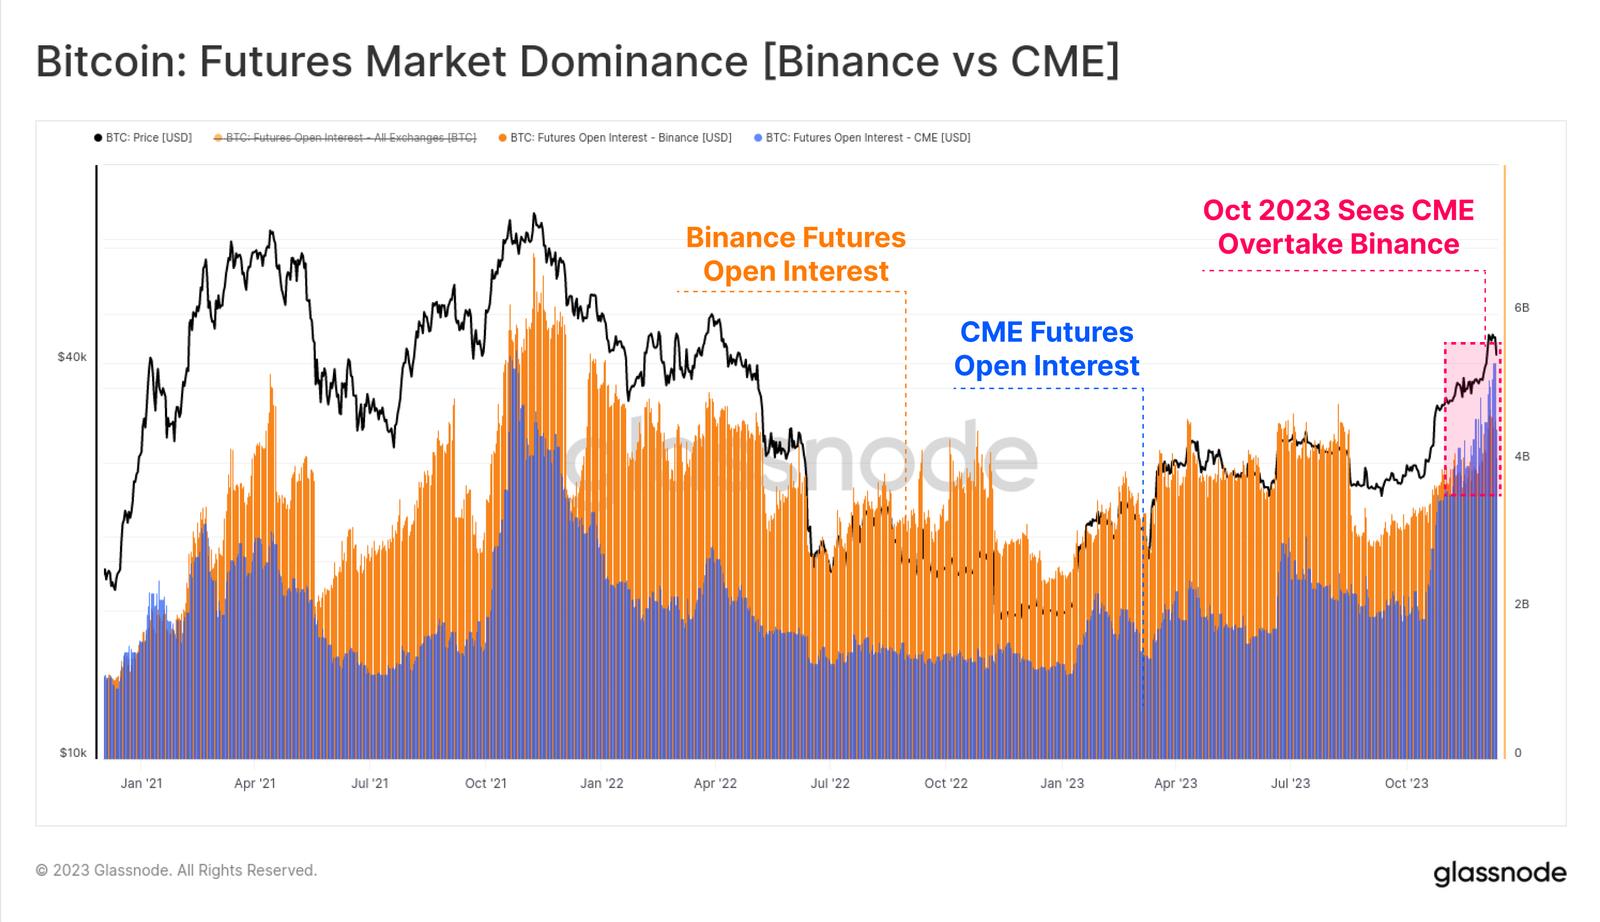
Within the futures market, a notable shift in dominance also occurred: regulated Chicago Mercantile Exchange (CME) futures open interest historically surpassed Binance for the first time. October again appears to be a pivotal moment, suggesting a surge in institutional capital.
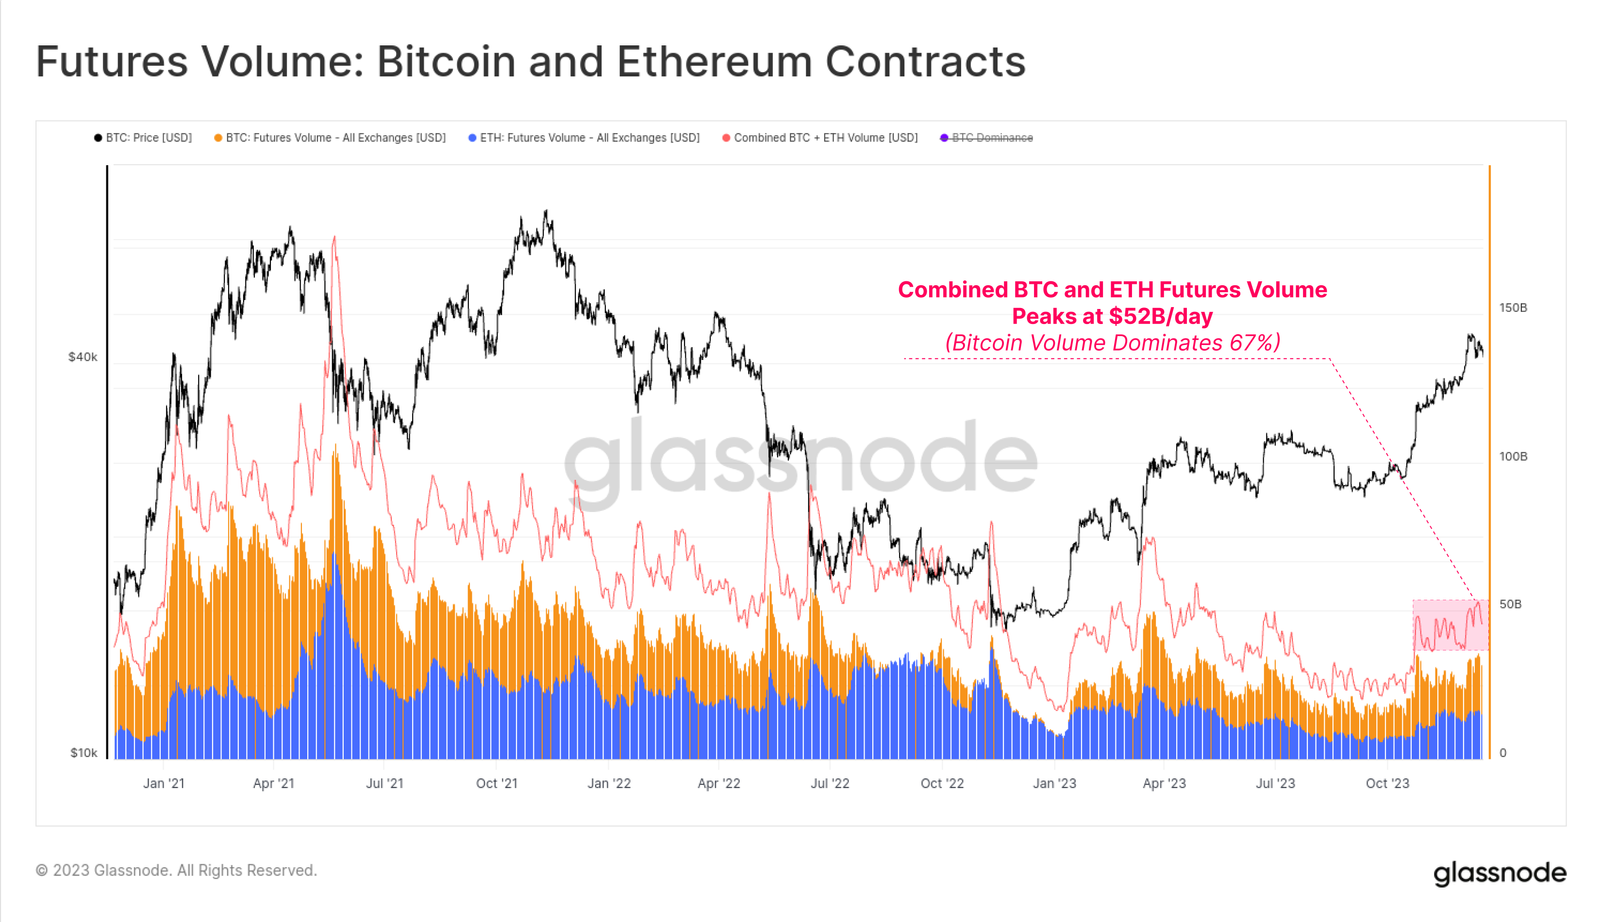
Futures trading volume for BTC and ETH increased in October, averaging $52B per day. Bitcoin contracts accounted for 67% of volume, Ethereum contracts for 33%.
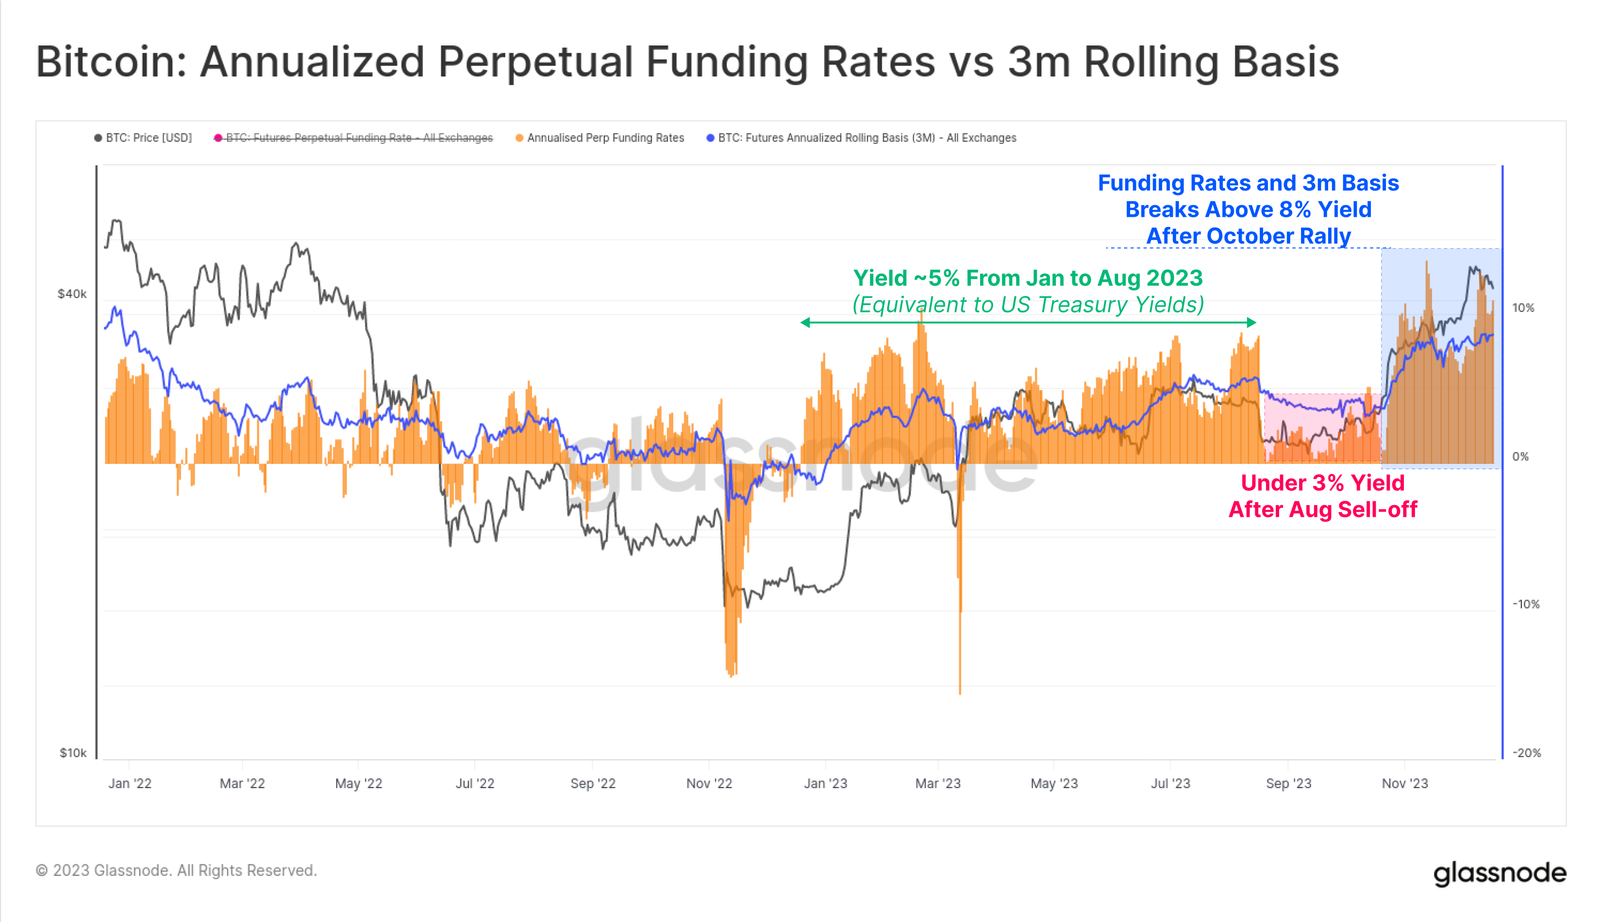
Cash and arbitrage yields in the futures market went through three distinct phases during the year, telling a story of capital inflows into the space:
-
January to August: Yields fluctuated around 5%, largely in line with short-term U.S. Treasury yields, making them relatively unattractive given the additional risks and complexity of trading.
-
August to October: Yields fell below 3%, following price drops to $26K and low volatility.
-
After October: Yields surged beyond 8%. With futures basis now maintaining 300 basis points above Treasury yields, market maker capital now has incentives to return to digital assets.
Stablecoin Supply
A relatively new phenomenon in the last cycle is the significant role stablecoins play in market structure, serving as traders’ preferred quote currency and a primary source of market liquidity.
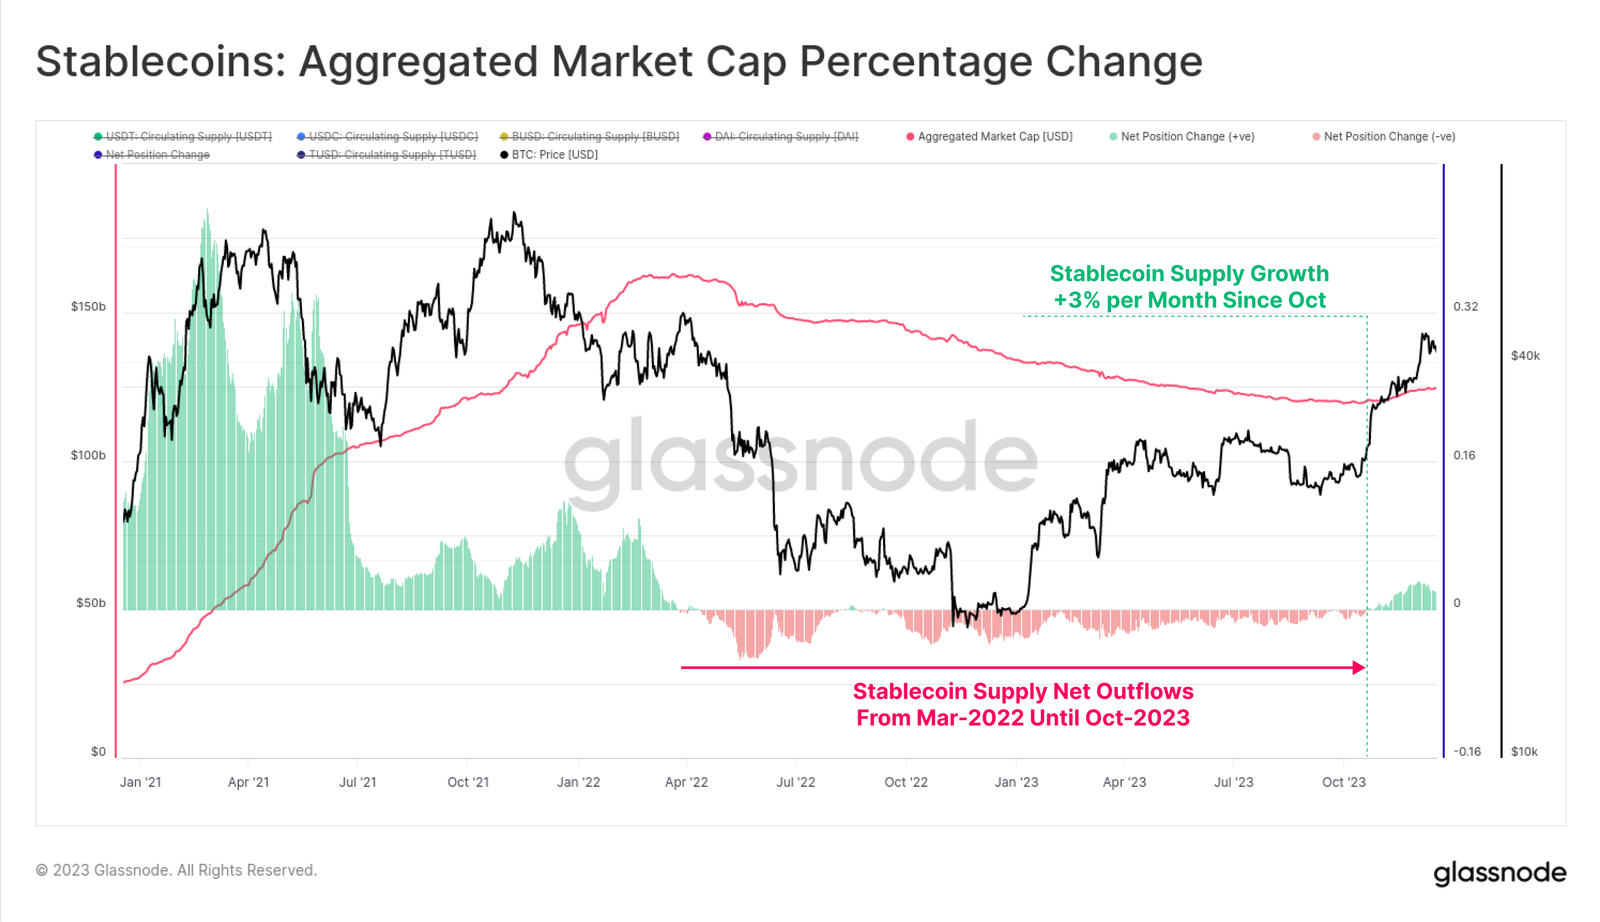
Since March 2022, total stablecoin supply has been declining, down 26% from its peak—a major headwind for market liquidity. This was driven by multiple factors, including regulatory pressure (SEC alleging BUSD is a security), capital rotation (preference for U.S. Treasuries over non-interest-bearing stablecoins), and reduced investor interest during the bear market.
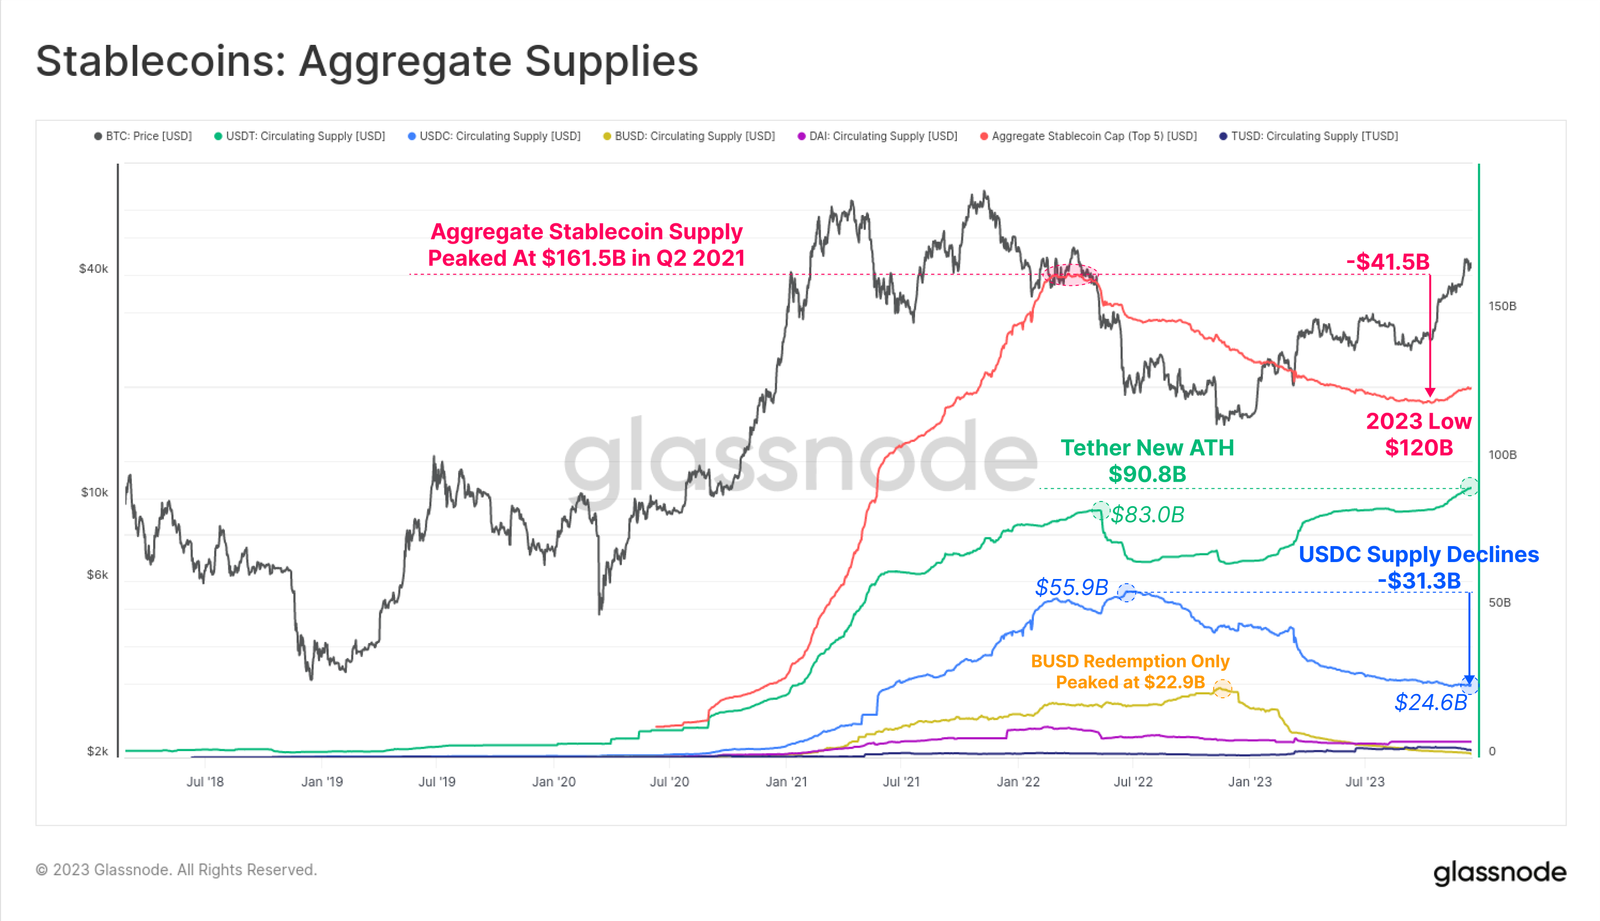
However, October became a turning point, with total stablecoin supply bottoming at $120B and beginning to grow at up to 3% per month. This marks the first expansion in stablecoin supply since March 2022, potentially signaling a return of investor interest.
Relative dominance among various stablecoins also shifted significantly between 2022 and 2023. Previously dominant stablecoins like USDC and BUSD have seen their market shares shrink substantially, with BUSD entering redemption-only mode and USDC’s dominance falling from 37.8% in June 2022 to 19.6%.
Tether (USDT) has once again become the largest stablecoin by supply, climbing to over $90.6B and capturing 72.7% of the market share.
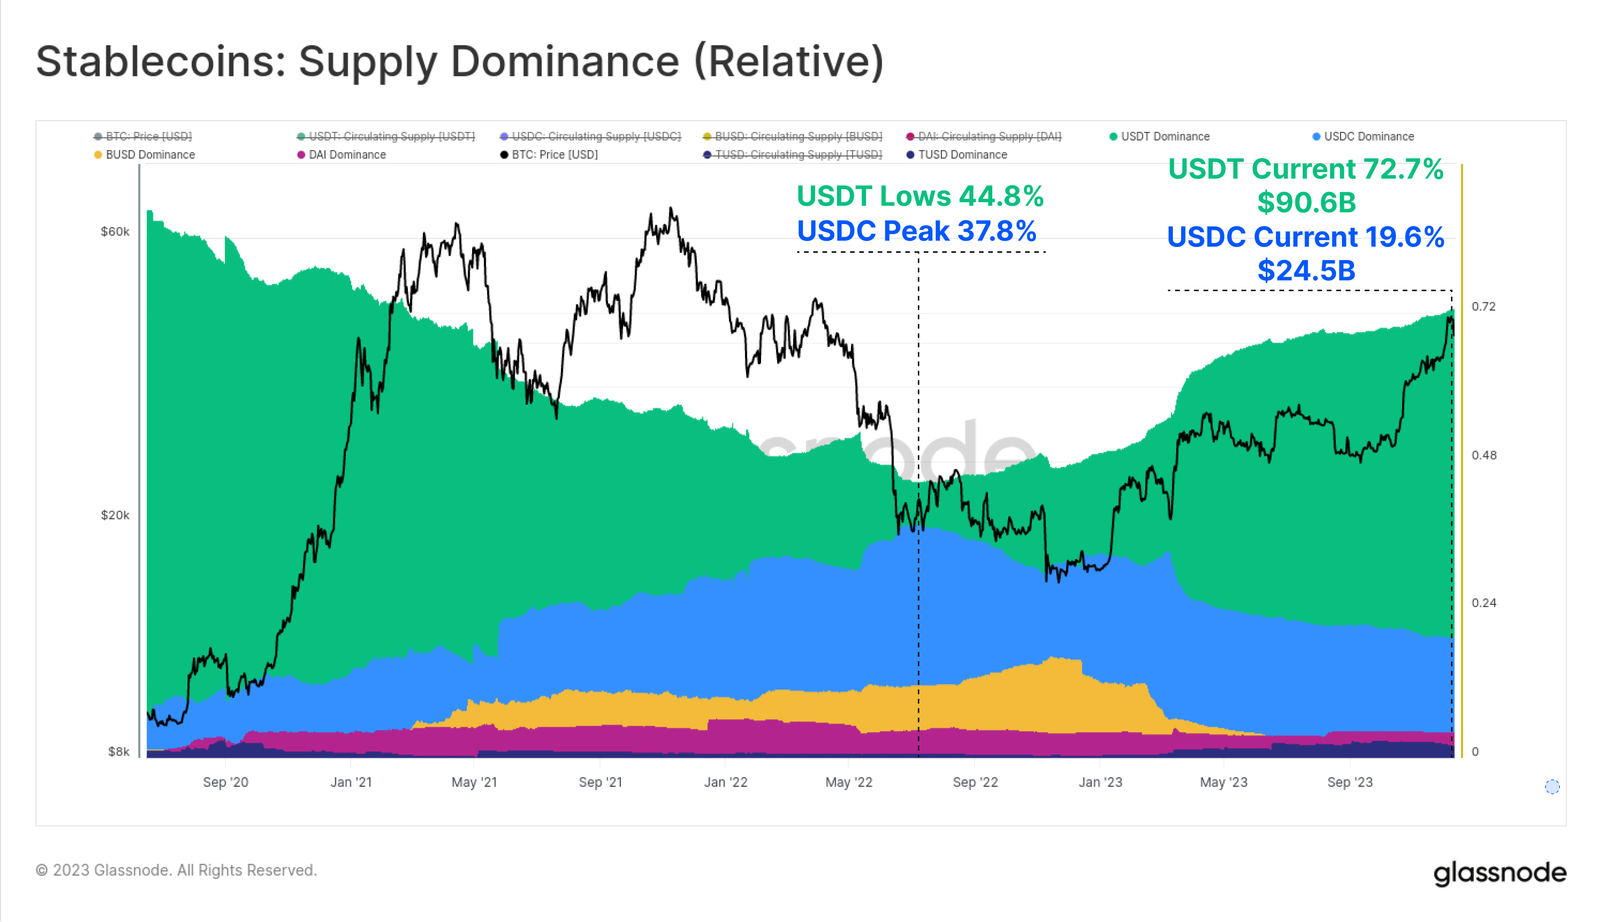
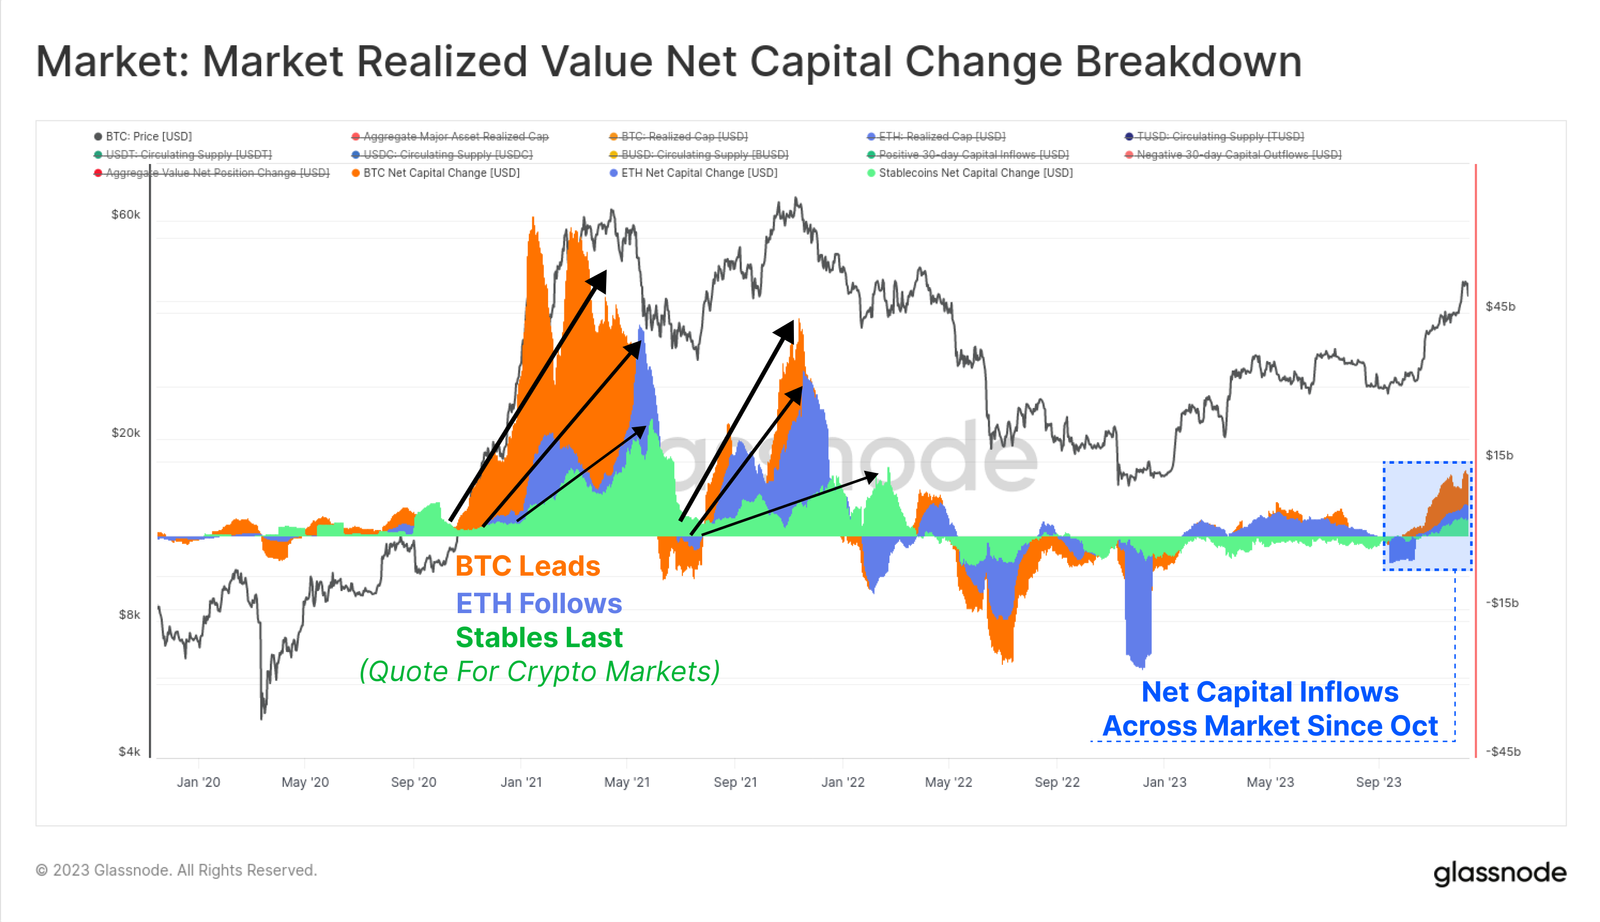
Finally, we can compare 30-day changes in realized market cap for BTC and ETH against total stablecoin supply. These three metrics help visualize and measure relative capital flows and rotations across sectors.
October again emerged as a pivotal moment, with capital inflows turning positive across all three assets—consistent with the market breaking above $30K, expanding institutional interest in derivatives, and net capital inflows into the three major digital assets.
Conclusion
2023 stood in stark contrast to the devastating deleveraging and downtrend of 2022. Instead, renewed interest in digital assets emerged, extending market narratives with innovations like Bitcoin inscriptions.
Bitcoin supply is now tightly held by long-term holders, and most investors hold profitable positions. With increasing likelihood of U.S. ETF approvals in early 2024 and the Bitcoin halving scheduled for April, 2024 promises to be an exciting year.
Join TechFlow official community to stay tuned
Telegram:https://t.me/TechFlowDaily
X (Twitter):https://x.com/TechFlowPost
X (Twitter) EN:https://x.com/BlockFlow_News
 @glassnode