TechFlow news, SignalQuant revealed on CryptoQuant that the current market is dominated by bears, and there are more bears now than during the FTX crisis.
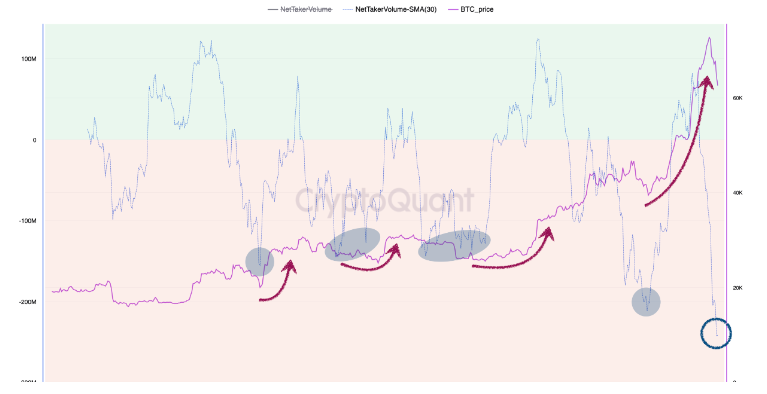
The thick purple line in the chart represents Bitcoin's price, while the thin blue line represents Taker Buy&Sell CVD. Taker Buy&Sell CVD shows the trend of the difference between bullish and bearish trading volumes. This indicator shows 0 as neutral, green areas indicate bulls exceeding bears, and red areas indicate bears exceeding bulls.
The trend of this indicator (30DMA) is at a very low level, with more bears present now than at the time of the FTX crisis on November 23.
SignalQuant stated that historical patterns suggest after periods when bears dominate the market, Bitcoin's price either moves sideways or experiences a significant rebound.