
ETF Milestone Approaches: What Trading Data Reveals About the Underlying Battles?
TechFlow Selected TechFlow Selected
ETF Milestone Approaches: What Trading Data Reveals About the Underlying Battles?
As the ETF timeline approaches, the actions and dynamics behind on-chain, futures, and options trading data carry significant directional implications.
 Navigating Web3 tides with focused insights
Author: Frank, Foresight News
Since entering January 2024, spot Bitcoin ETFs have almost become the dominant narrative determining market direction in the short term. Against this backdrop, data has also emerged as an effective window for observing market sentiment and capital positioning.
This article aims to examine key derivatives market metrics—such as open interest, funding rates, expiration dates and strike price distributions, and implied volatility (IV)—to uncover underlying signals of capital positioning.
Two Key Timeframes
From a news perspective, two main timeframes stand out:
First, Reuters reported over the weekend, citing sources, that the U.S. Securities and Exchange Commission (SEC) could potentially approve several spot ETF applications as early as January 3–4.
That is, as early as this Tuesday or Wednesday, the U.S. SEC may officially announce approvals for certain issuers applying for spot Bitcoin ETFs.
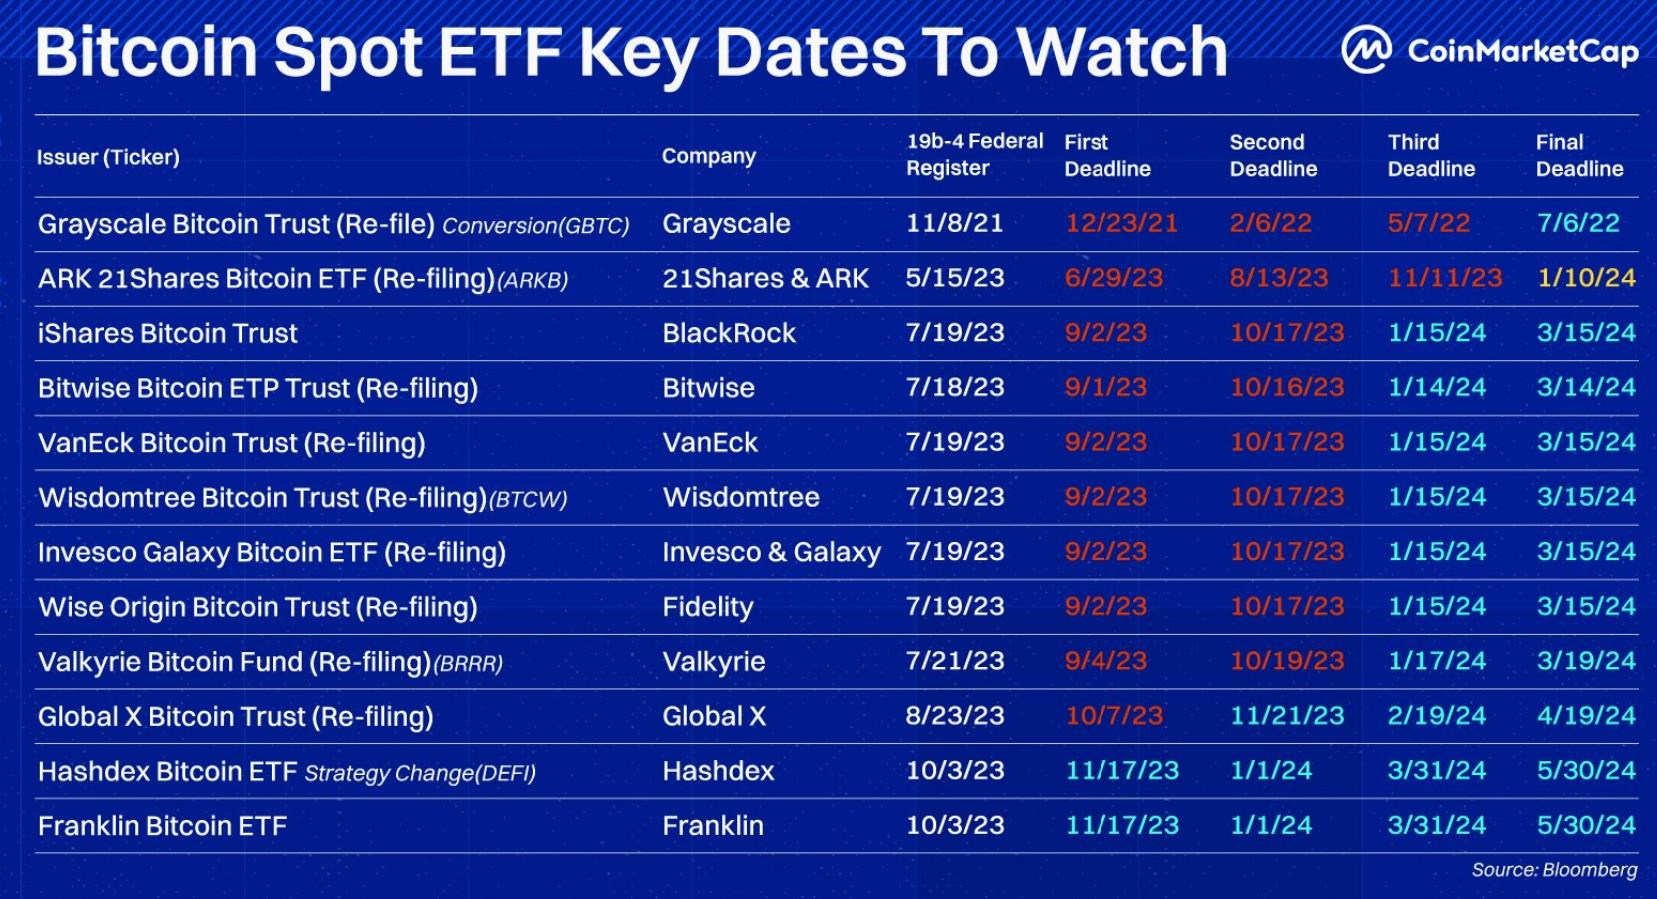
Second, according to prior schedules, the latest date by which the U.S. SEC must make a decision on 21Shares/ARK’s spot Bitcoin ETF application is January 10, followed by密集 decisions for seven other applicants between January 14 and 17.
However, if delayed until January 10, it's still possible the SEC could push back further to mid-March—the final deadline window.
Overall, January 3–4 and January 10–17 represent the two primary focal points for current market positioning.
Capital Positioning Signals Behind the Data
Bitcoin Open Interest: No Significant Growth
According to Coinglass data, total open interest across all Bitcoin futures contracts stands at 432,400 BTC (approximately $19.688 billion).
Among them, CME Bitcoin futures lead with 114,800 BTC ($5.215 billion), followed by Binance with 103,200 BTC (~$4.7 billion).
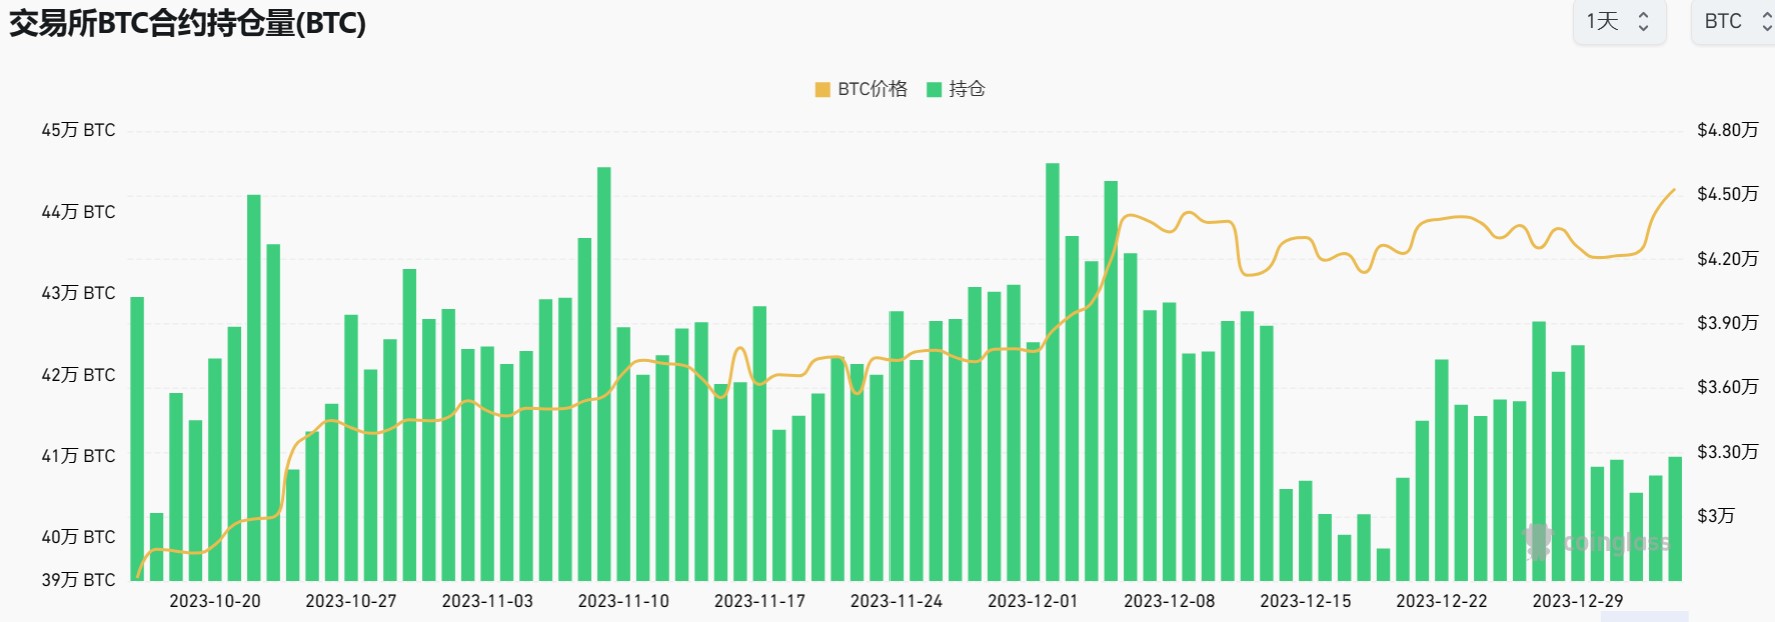
Notably, since the annual settlement day on December 30, Bitcoin open interest has oscillated between 405,000 and 410,000 BTC over the past week, showing no clear upward trend. This suggests limited intensity in futures market positioning regarding future price movements.
Perpetual Contract Funding Rates: Persistently High
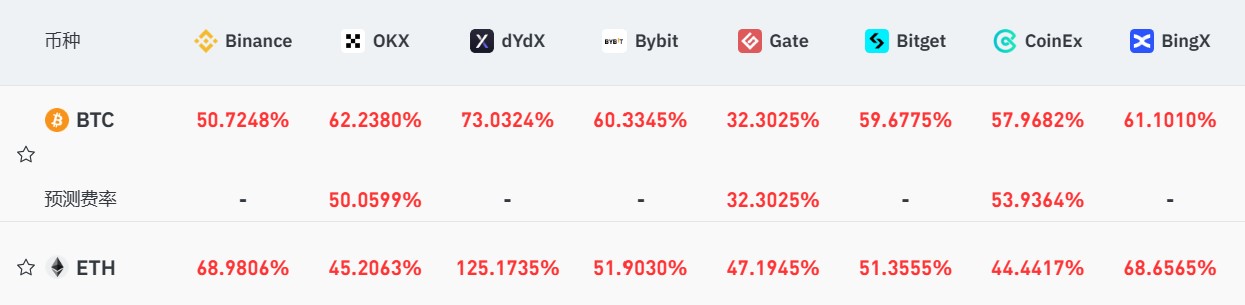
Meanwhile, Coinglass data shows that funding rates for BTC and ETH perpetual contracts have remained above 30% annualized for over a week since December 25—indicating long positions are consistently paying substantial funding fees, reflecting strong conviction in an upcoming breakout.
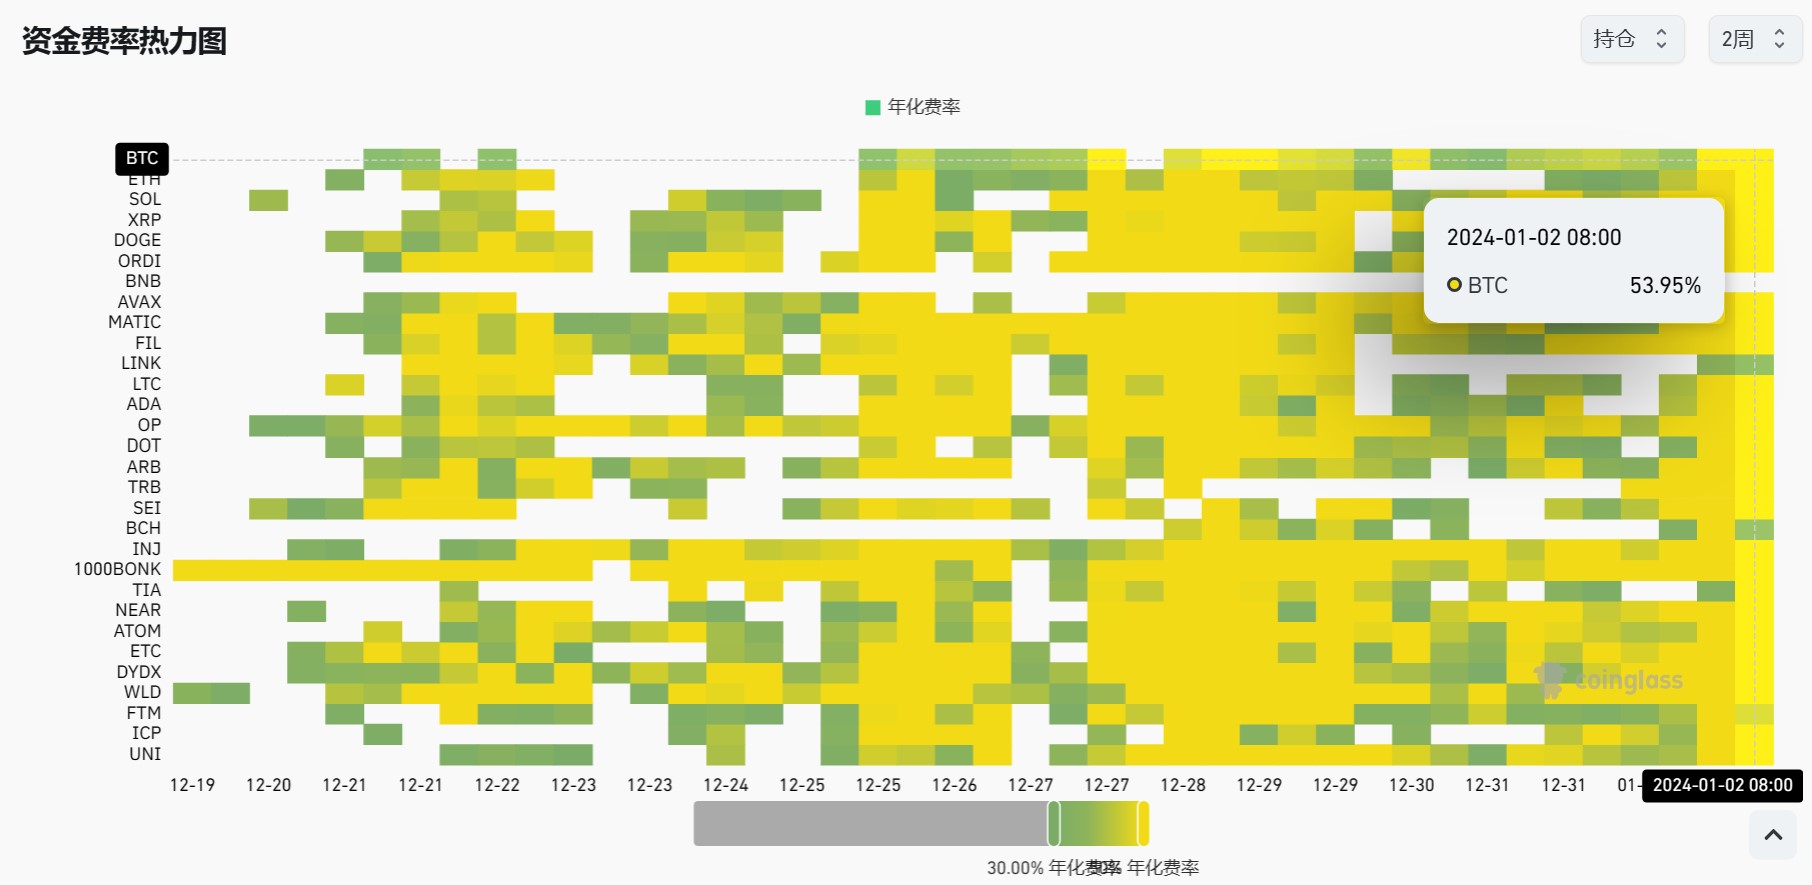
In particular, starting today (January 2, 00:00 UTC), both rates surged above 50% annualized, meaning longs are heavily subsidizing shorts daily, leading to continuous capital outflows.
This implies that if, at the critical junctures of January 3–4 or January 10, spot Bitcoin ETF news fails to meet expectations and prices fail to break higher, these highly leveraged longs—who have been steadily paying large funding fees—could face forced liquidations due to mounting pressure.
This scenario played out previously on December 9–10 (Saturday–Sunday): after days of bleeding under >30% funding costs with no price breakout over the weekend, a $3,000+ dump occurred early Monday morning (see “Longs Wiped Out, Where Is the ‘Christmas Rally’ Headed?” for details).
Option Expirations Cluster Around Key Dates
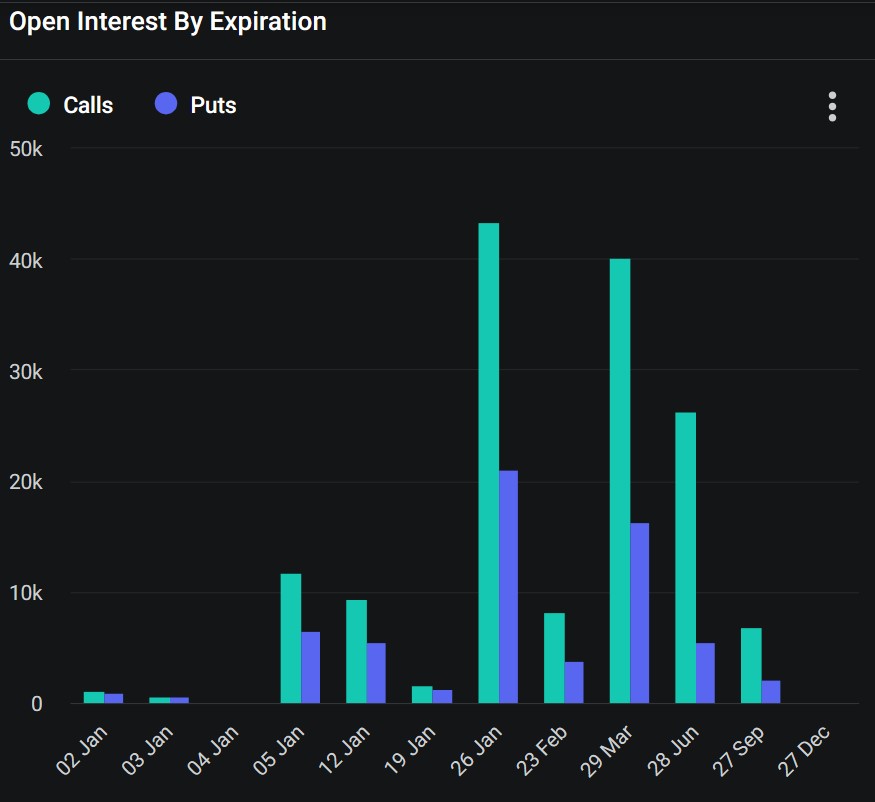
Deribit statistics show that Bitcoin option open interest is concentrated on three dates this month—January 5, January 12, and January 26—with call options exceeding puts on each date.
January 5 and January 12 align closely with the rumored approval dates of January 3–4 and the expected decision on 21Shares/ARK’s application.
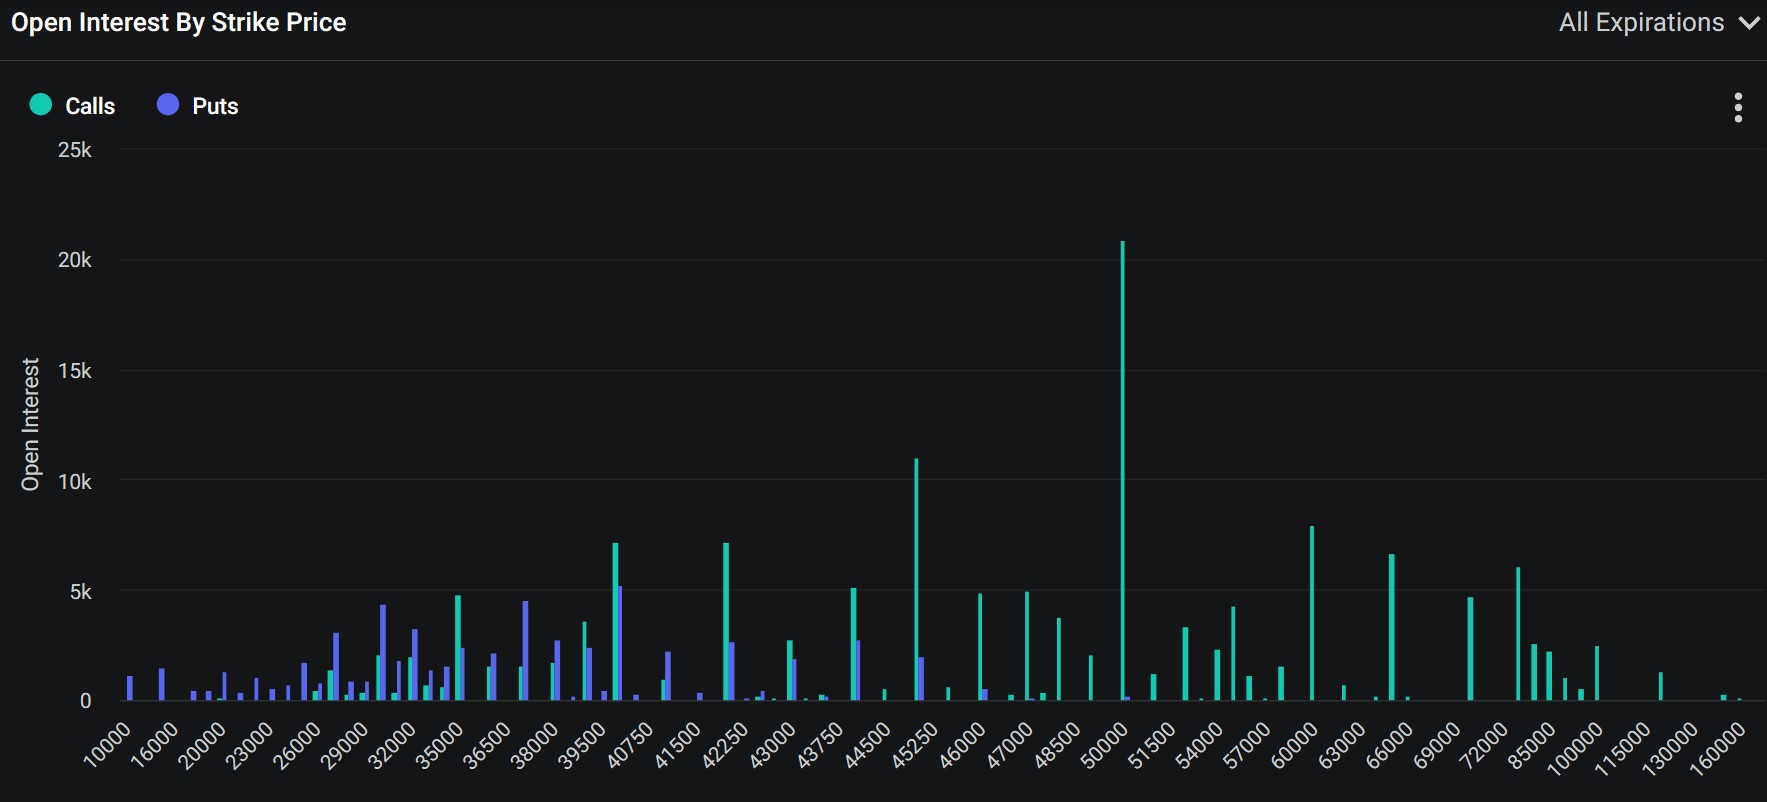
In terms of strike prices, the bulk of open option contracts center around $50,000—suggesting market participants are betting that a successful ETF approval would drive prices above this level.
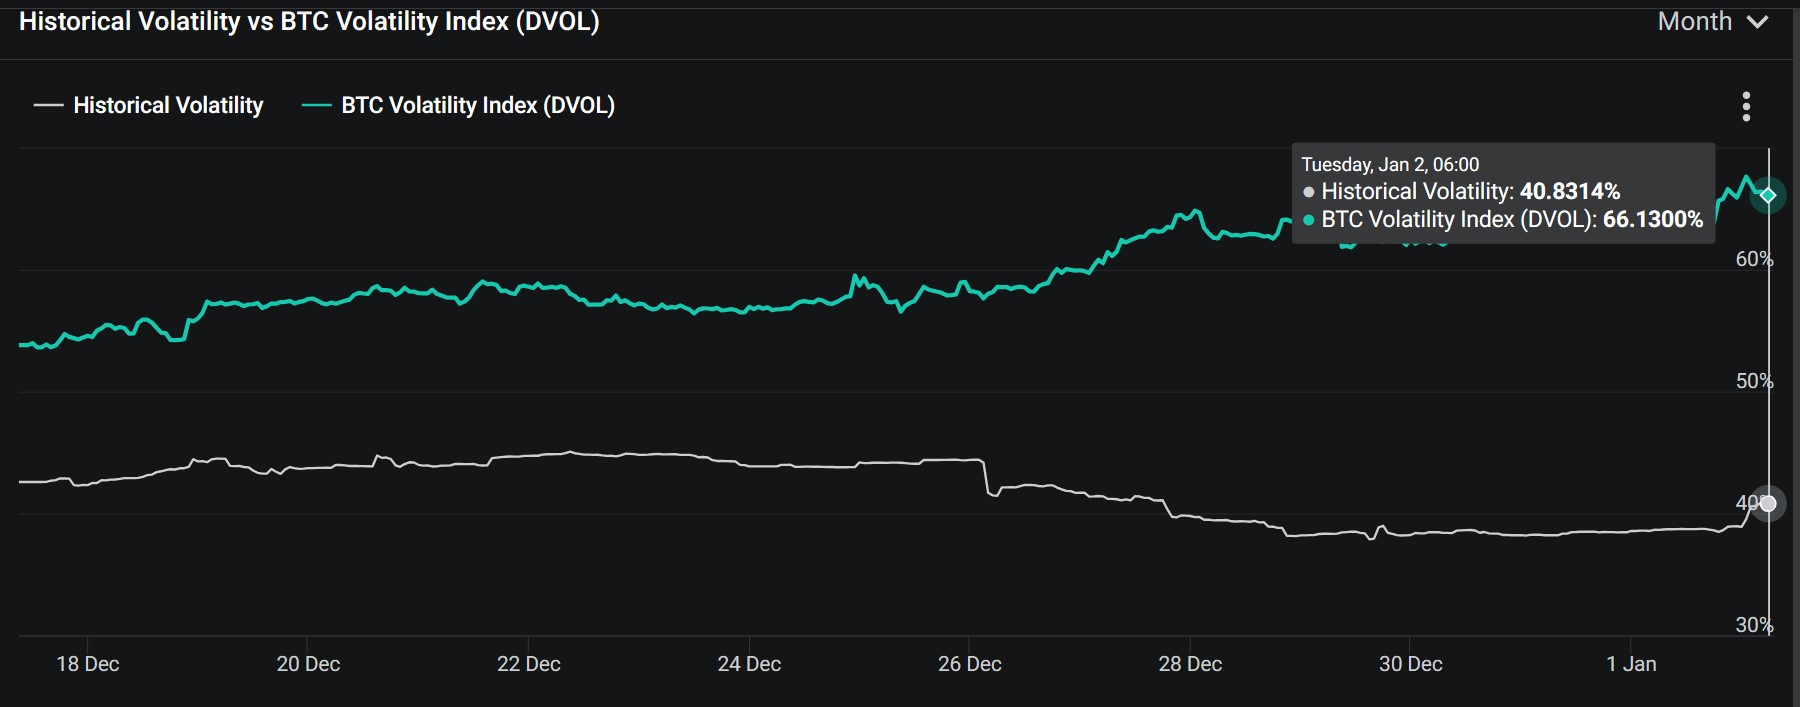
Additionally, Deribit’s BTC Volatility Index (DVOL) has risen counter-seasonally compared to previous years, increasing nearly 50% over the past seven days from around 44% to near 66%—whereas in prior years, DVOL typically declines steadily during this period, hovering around 40%.
Summary
Recently, market observers have been tracking a mysterious whale that accumulated nearly $1.8 billion worth of crypto assets over 50 days (see “$1.8 Billion in 50 Days: Has the Engine Behind This Bull Run Emerged?”). From October 20 to December 9, this address purchased $1.76 billion in digital assets, perfectly aligning with the timing of the market rally.
Notably, after 20 days of inactivity, this address re-emerged on December 28, withdrawing 50 million USDT from Tether and depositing funds into Kraken, Bitgo, and Coinbase. Regardless of who controls this wallet, such a massive $1.81 billion buying spree itself sends a powerful signal.
Combined with the approaching deadlines for spot Bitcoin ETF decisions, these on-chain and trading data patterns carry significant directional implications.
Join TechFlow official community to stay tuned
Telegram:https://t.me/TechFlowDaily
X (Twitter):https://x.com/TechFlowPost
X (Twitter) EN:https://x.com/BlockFlow_News
 Foresight News