

How Token Unlocks Affect Price: Big Data Analysis Based on 5,000 Projects
TechFlow Selected TechFlow Selected
How Token Unlocks Affect Price: Big Data Analysis Based on 5,000 Projects
This article will explore the relationship between token unlocks and price performance, offering founders best practices to minimize the impact of price volatility and promote healthy community participation.
Written by: MUSTAFA, CARL
Translated by: TechFlow
Like any other investment, cryptocurrencies come with their own unique risks and challenges—one of which is understanding how token unlock schedules impact price volatility and overall performance. In this article, we explore the relationship between token unlocks and price performance, and provide best practices for founders to minimize price volatility and foster healthy community participation.
TL;DR
As token engineers, our goal is to understand how different elements of token unlock design—scale, frequency, duration, and distribution—affect token price stability and long-term health.
We collected and analyzed data from over 5,000 distinct unlock events, leading to the following conclusions:
-
Small-scale unlock events (increasing circulating supply by 0% to 1%) show no meaningful relationship with price.
-
Large-scale unlock events (increasing circulating supply by more than 1%) exhibit a clear negative correlation: as unlock size increases, price tends to decline.
-
Tokens that have unlocked most of their supply (over 70%) show significantly lower volatility and relatively higher prices, while tokens in early stages of their unlock schedule tend to trade at lower valuations.
-
Protocols with greater allocations to private rounds (e.g., team, investors) slightly outperform those with larger public allocations (e.g., ecosystem, community). However, in our view, this result is not strong enough to be a primary consideration for token engineers.
From these findings, we propose three key considerations for founders when designing tokenomics, summarized briefly below:
-
Consider limiting unlock sizes to no more than 1% of circulating supply. Favor daily or weekly unlocks over quarterly or annual releases.
-
Reconsider including large unlock events, which may create significant and unnecessary downward price pressure.
-
Be aware that token prices may experience heightened volatility during the early phases of the distribution schedule.
Objective
Despite being a common feature in nearly every funded project, the impact of large token unlocks remains an under-researched aspect of token design. These unlocks can introduce significant volatility, causing distress for communities, token designers, and traders alike.
Yet, when done correctly, token unlocks can help align incentives among stakeholders. So what is the optimal approach? We dive into the data to understand how token unlocks have historically influenced price movements and overall protocol success. Can we extract generalizable principles from the data? And how can founders act on these insights?
Our objective is to derive general insights into how different unlock design elements—scale, frequency, duration, and distribution—affect token price stability.
We hypothesize that larger unlock events will have a greater negative impact on price, and that tokens with most of their supply already unlocked will outperform those with mostly unvested supplies, as many recipients may sell upon receiving unlocked tokens.
Dataset
We collected and verified data from 20 protocols, including Uniswap (UNI), Galxe (GAL), and BitDAO (BIT), resulting in over 5,000 distinct unlock events for analysis. Data verification included reviewing on-chain data and/or confirming vesting schedules with core protocol teams.
Vesting percentage as of April 2023:
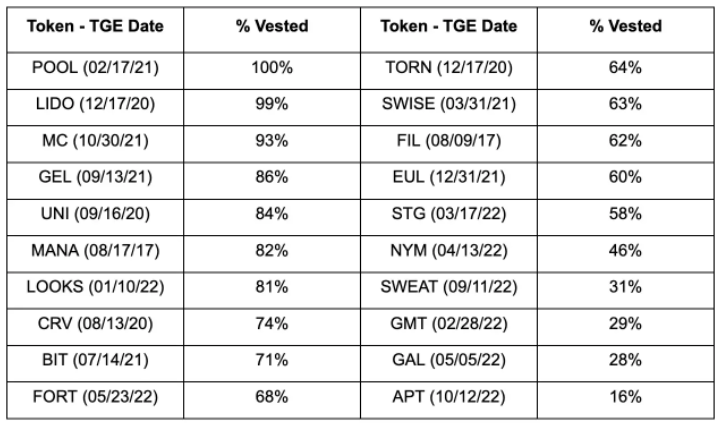
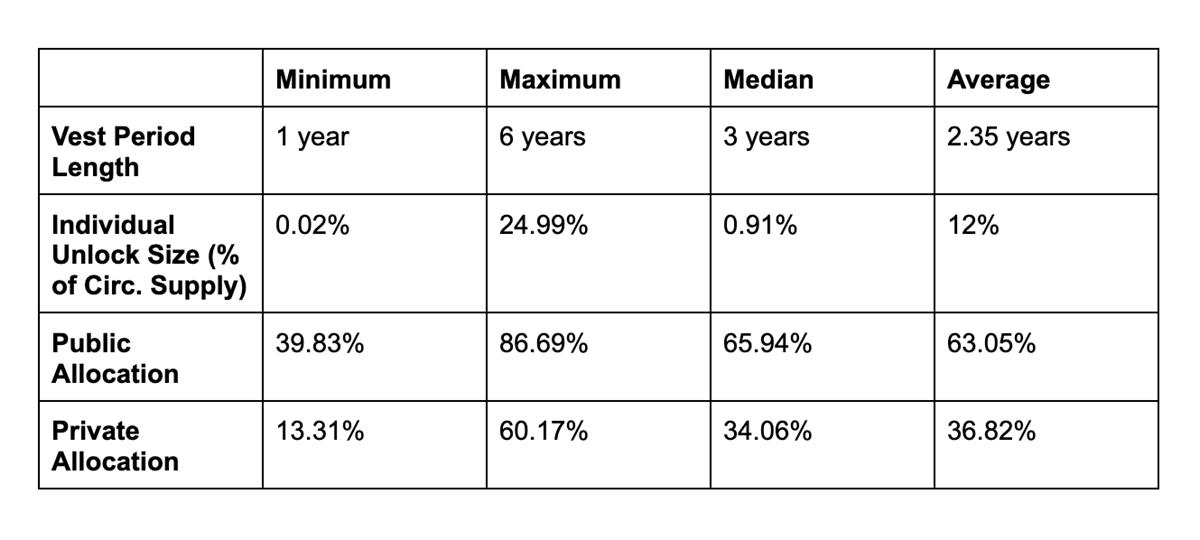
This dataset represents diverse vesting schedules and market conditions:
Analysis
Initially, we examined the direct relationship between token unlock size and historical price changes. To capture general trends, we gathered normalized price data for each unlock and plotted average and median lines on a single chart, focusing on a 30-day window centered on the unlock date (15 days before and after).
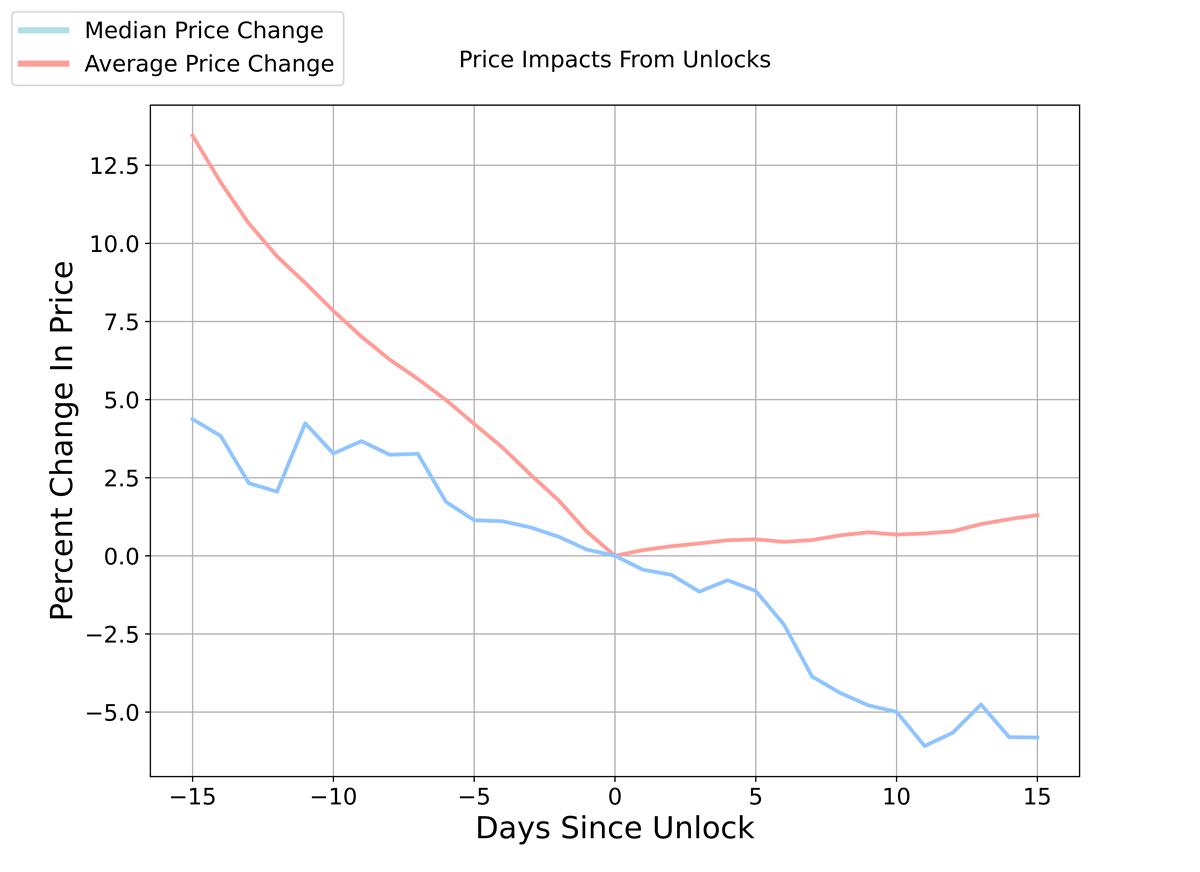
On average, token prices were about 13% higher 15 days before the unlock and modestly increased afterward. The median line shows a stronger downward trend, with prices dropping about 5% post-unlock. We attribute the divergence between median and mean to outlier events driven by extreme market conditions. Therefore, we consider the median a better representation of marginal unlock effects.
These results align with basic economic intuition: if supply increases rapidly without corresponding demand growth, prices should fall. However, the reality is more complex. Unlock schedules are typically public, allowing room for narrative-building and event-driven trading. Recently, some token unlocks have even become bullish narratives due to short squeezes*. This anticipatory behavior complicates the picture. Can it be mitigated? And is mitigation worthwhile?
(TechFlow Note: Short squeeze—a stock market term referring to a situation where short sellers are forced to cover their positions by buying back shares, causing demand to exceed available supply and driving prices sharply upward due to scarcity.)
While this level of analysis confirms intuitive expectations around price behavior near unlocks, we can apply more rigorous techniques to uncover deeper insights.
Correlation Analysis
Same-Day Analysis
We first assessed market reactions by analyzing same-day price changes. Below, we plot percentage price change (vs. previous day) against percentage change in circulating supply. This aims to measure the relationship between unlock scale and price impact. A negative correlation would indicate that larger unlocks are associated with greater price declines.
We categorized two types of unlocks: private and public. Private unlocks include allocations to team members, collaborators, investors, and advisors, while public unlocks cover treasury, ecosystem funds, community distributions, and airdrops. In total, we collected 2,187 public unlock events and 4,546 private unlocks.
When comparing private vs. public unlocks, we found public unlocks tend to be small—typically below 2% of total supply—while private unlocks vary more widely in size and price impact and show a negative correlation. This makes sense, as private unlocks often involve cliff-based or quarterly releases, after which insiders may sell their tokens.
Isolating private unlocks yields the following:
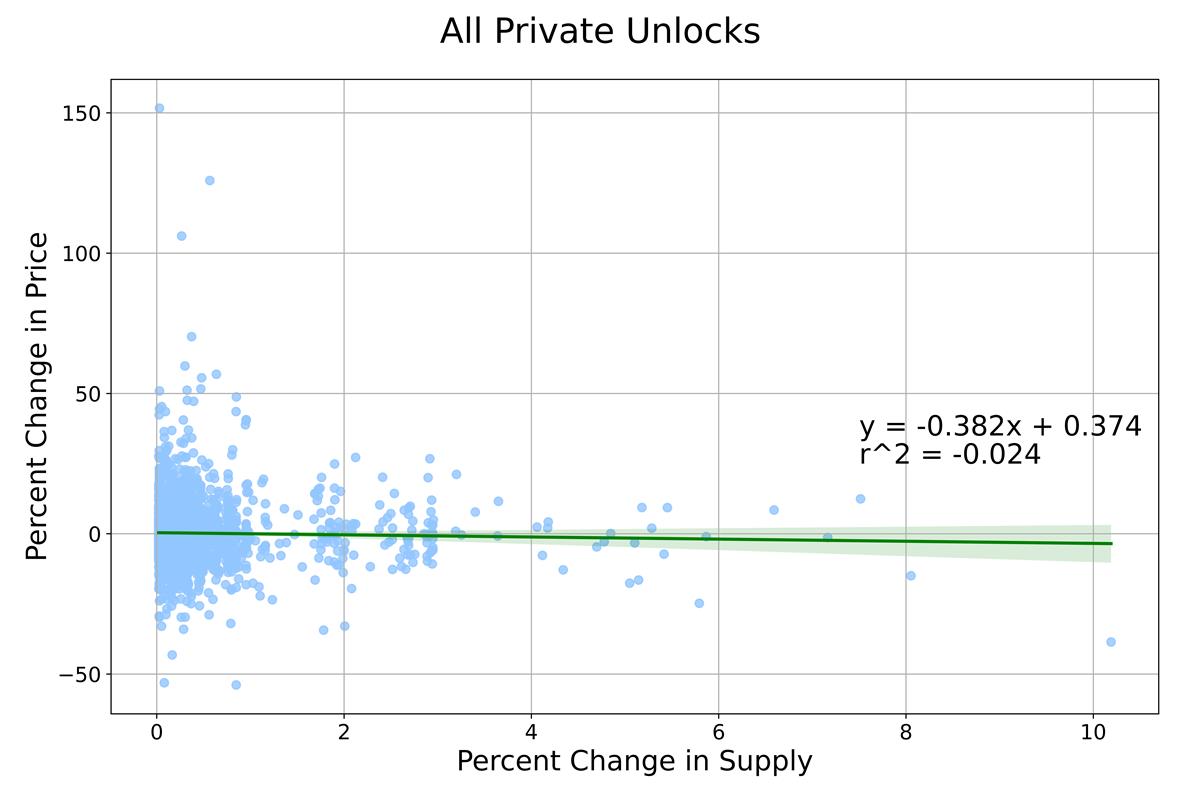
A notable feature is the cluster of points between 0% and 1% supply increase, suggesting potentially different dynamics across unlock scales. To investigate, we separately analyze unlocks below 1% and those above 1%.

For the first cluster (0%–1% unlocks), we find no linear relationship. This supports the idea that small unlocks have minimal price impact. Although one might expect increasing impact with unlock size, within this range, all sizes appear to have similar effects.
For the second cluster (>1% unlocks), we observe a stronger negative correlation, indicating that larger unlocks lead to greater price declines. This aligns with our hypothesis. Given multiple exogenous variables affecting token prices, we don’t expect high correlation, but 16% is meaningful in this context.
Additionally, macroeconomic factors play a role in our analysis. Could our data be heavily influenced by broader market forces? We conducted several tests and concluded that macroeconomic factors have little impact on changes in circulating supply.
Longer Time Windows
A key limitation of same-day analysis is the lack of pre- and post-unlock price data. We assume forward-looking and reactive effects may take days or weeks to materialize. For example, short sellers might build positions weeks before a major unlock, or insiders may take time to exit due to liquidity constraints. To examine this, we ran similar correlation analyses over longer windows: ±3 days, ±1 week, and ±15 days.
For the pre-unlock period, we calculate price change between the unlock day and the first day of the window. Thus, the sign of correlation is reversed: positive correlation means higher prices before unlock, negative means lower. If our intuition holds, we’d expect positive correlation before unlock (due to anticipated selling pressure) and negative correlation afterward (as prices continue to drop).
Again, we find negligible relationships for unlocks between 0% and 1%. Both pre- and post-unlock, best-fit lines are generally flat, indicating no sustained price impact for this scale.
For unlocks exceeding 1% of circulating supply, we observe the following:
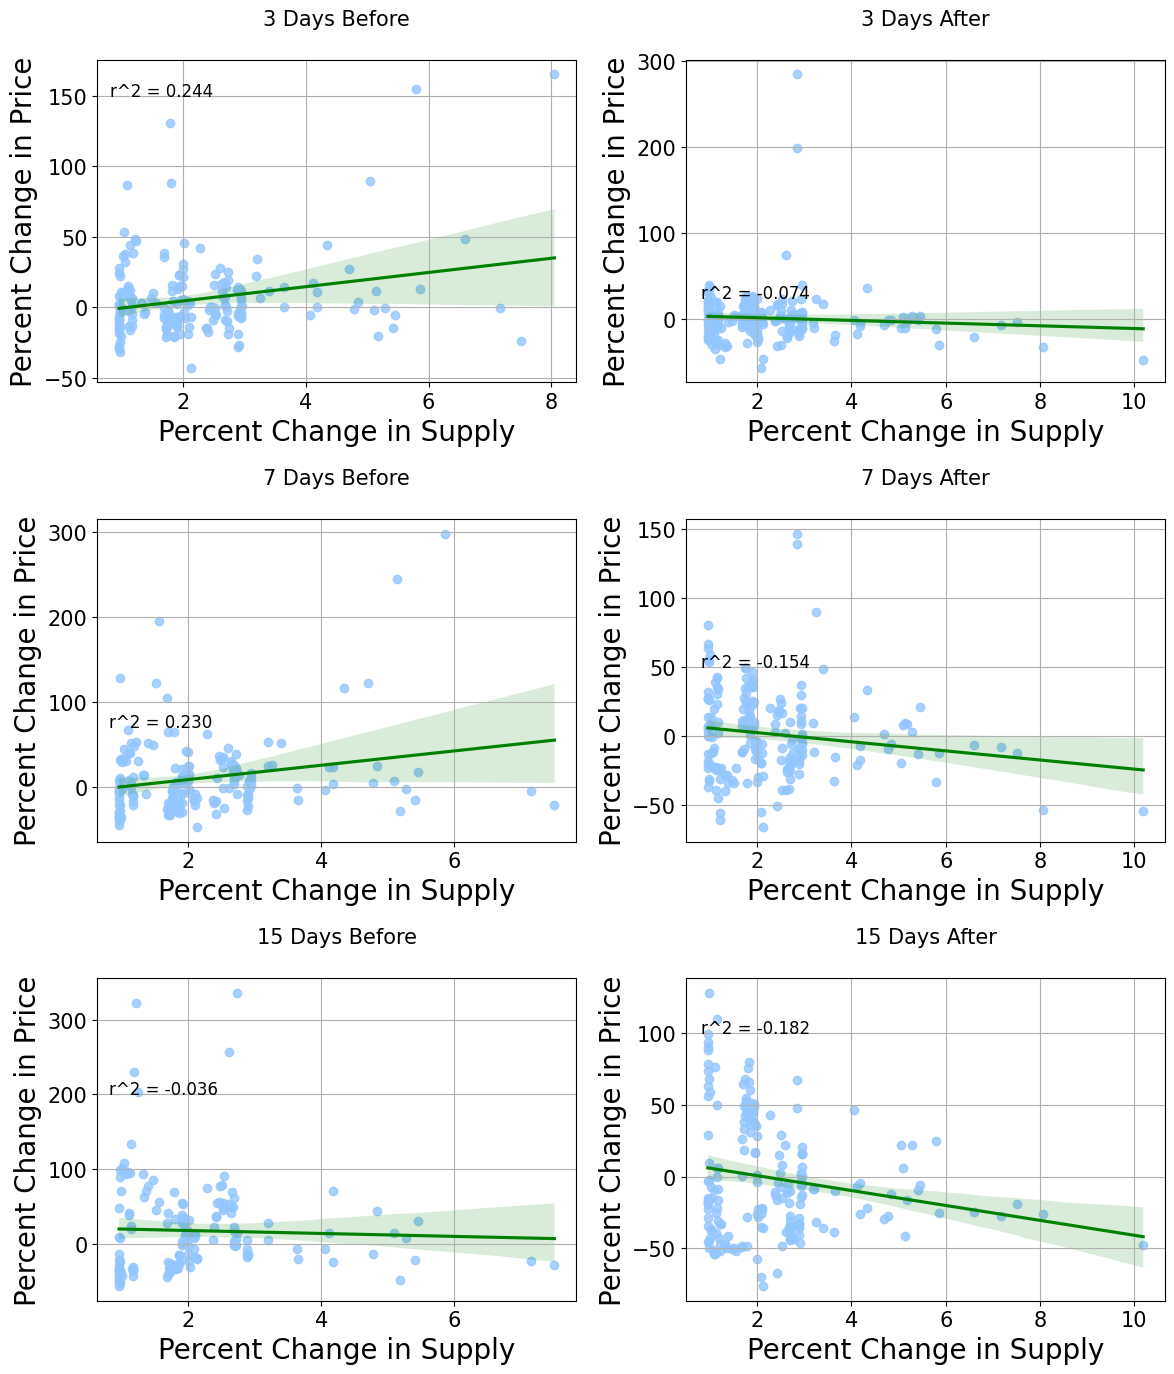
As a preliminary caveat, we strongly emphasize that causality cannot be strictly proven; these results should be viewed as suggestive correlations for further consideration and research. Moreover, we limit correlation analysis to a two-week window, as longer periods introduce unknowable or unmeasurable factors. Finally, overlapping unlocks may occur as the window expands, though we believe their impact is minimal. With these caveats, our findings serve as a useful, evidence-based indicator of typical price behavior around unlocks.
At first glance, these results support our hypothesis. Typically, positive correlations appear before unlocks (indicating higher prices), and negative correlations follow (indicating price drops).
In the 3-day and 7-day pre-unlock windows, we see relatively strong correlations (24% and 23%). Post-unlock, correlations are -7% and -15%, respectively. This suggests stronger price pressure up to a week before unlock, likely due to anticipation of publicly known events. Conversely, post-unlock correlations are closer to the regression line, giving us more confidence in these results.
In the 15-day pre-unlock window, correlation shifts to a weak -3%. We filtered out daily unlocks, focusing only on weekly or less frequent ones to reduce "cross-contamination." The lack of strong results may suggest that anticipatory effects are weaker at this horizon and more prominent closer to the unlock date. However, the 15-day post-unlock effect is the strongest across all windows, at -18%. This indicates that while anticipation may not begin 15 days prior, the suppressive price effect fully manifests over that period.
Model Analysis
We cannot rely solely on empirical data for long-term analysis due to numerous exogenous factors over extended periods. However, we can use agent-based models*—closed systems with discrete variables—to simulate long-term impacts.
(TechFlow Note: A computational model used to simulate the actions and interactions of autonomous agents—individuals or groups such as organizations or teams—to assess their effects on the system as a whole.)
We simulated three scenarios plus a control group. In the control, no tokens are allocated to institutional investors. Then, we introduced an institution holding 8% of supply, with tokens unlocking every other day, monthly, and every six months.
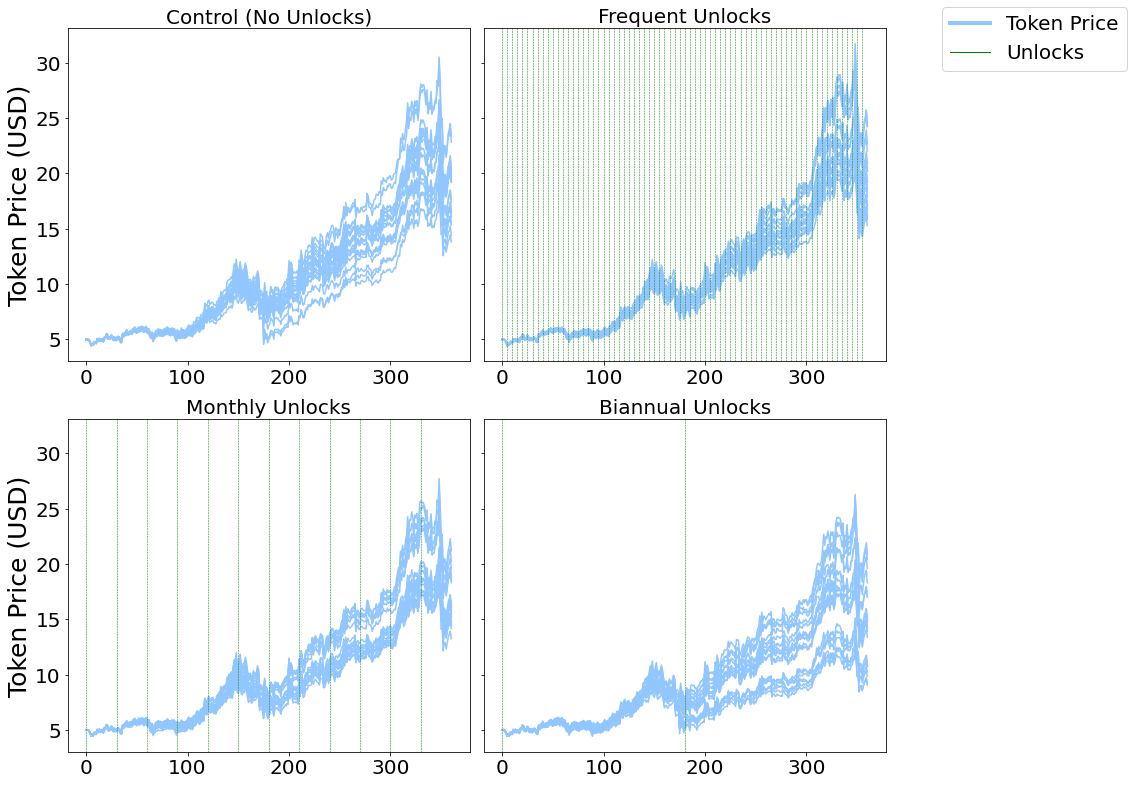
Overall, we observe results consistent with empirical findings: larger unlocks lead to greater and more persistent price declines. Over longer timeframes, differences grow with unlock size.
Correlation Summary
When examining specific unlock events, we find that prices typically decline around the unlock, with the magnitude proportional to unlock size. We do not claim strict causality, as market impacts are complex and non-experimental, making single-variable regression insufficient for definitive conclusions.
Unlock Duration
Another hypothesis is that some token recipients may sell immediately upon receipt, implying that tokens in early vesting stages could face greater and more prolonged selling pressure in lower liquidity environments compared to those that are mostly or fully unlocked.
To test this, we split the dataset into two groups: mostly unlocked (≥70% vested) and mostly locked (<70% vested). There are 9 in the former and 11 in the latter.
Note that these categorizations reflect initial launch structures, so we examine recent performance based on current vesting status. We focus on a 4-month window, from January 15 to April 15. Two metrics guide our evaluation:
- Average variance. Instead of raw variance or standard deviation, we use the coefficient of variation—standard deviation divided by mean—to enable direct comparison across assets regardless of price levels. This measures relative volatility during the period.
- Average price change. Percentage change from start to end of the period. This helps assess relative performance against the market.
After benchmarking Bitcoin and Ethereum using the same metrics, we arrive at the following:
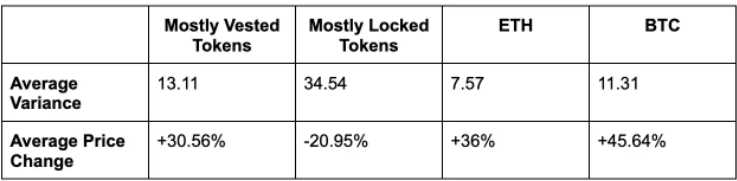
The behavioral difference between groups is stark. Tokens that are mostly unlocked move closely with ETH and BTC, tracking broader market trends. In contrast, mostly locked tokens declined significantly in price during the same period and exhibited 2.6x higher variance. Clearly, tokens with most supply unlocked are far more stable and appreciate more in value. This confirms our hypothesis: once most tokens are unlocked, price stability improves. We believe this is because tokens have transferred to community members and investors with longer-term conviction in the protocol.
Token Distribution
As our summary statistics show, the average token allocation is 63% public and 37% private. We again divided the 20 tokens into two groups: “more public allocation” (8 tokens) and “more private allocation” (12 tokens), then performed similar analysis.
We hypothesized that tokens with larger private allocations would experience greater volatility due to narratives around large insider sales. After running the analysis, we found the following:
January 15, 2023 – April 15, 2023

October 1, 2022 – January 1, 2023
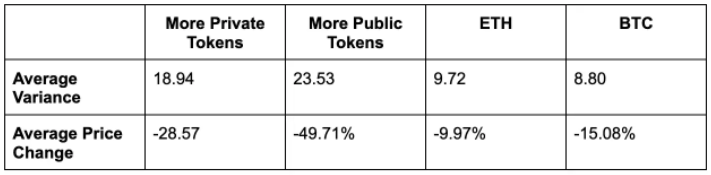
Interestingly, privately allocated tokens showed slightly better volatility and price performance in both periods. This may be because some private holders use OTC services to trade tokens without impacting market prices—services typically unavailable to the broader community (i.e., retail participants). However, these results are not strong enough to form robust recommendations for token distribution. As a general principle, we always favor greater community allocation and believe community ownership is vital for healthy protocols and the broader crypto ecosystem.
Conclusion
Overall, our simulation and empirical studies yield consistent findings. Unlock sizes exceeding 1% of circulating supply show a negative correlation with price. Notably, smaller unlocks have negligible impact. We also find that protocols with most tokens unlocked behave more like the market and outperform those still in early unlock phases. Lastly, tokens with higher private allocations show slightly lower volatility and better price performance.
These findings offer practical takeaways for project founders:
- The 1% Rule: Founders seeking to reduce price volatility should limit the amount of tokens unlocked relative to circulating supply. Our data suggests unlocks under 1% of supply have no measurable price impact, favoring block-level, daily, or weekly unlocks over quarterly or annual events. Smaller, more frequent unlocks also distribute potential selling pressure more evenly rather than concentrating it in large events.
- Reconsider Large Distributions: We observed the most pronounced price drops before major distribution events—sometimes up to 20%, taking as long as two months to recover. Reducing reliance on large unlock events can help avoid reinforcing negative narratives and unhealthy leveraged trading. Founders should carefully evaluate the consequences of unlocking a year’s worth of tokens at once. For compliance with regulations, U.S.-based teams may need to delay unlocks by one year. One solution: begin gradual unlocks after one year instead of releasing a full year’s allocation in a single event.
- Higher volatility and price suppression may occur early in the unlock schedule: Founders aware of this theory can better communicate expectations to investors and the community. Additionally, founders might consider designing vesting schedules to reach the “mostly unlocked” state faster, rather than stretching unlocks over many years. However, over long horizons, too many external factors exist to determine an optimal unlock timeline with confidence.
Join TechFlow official community to stay tuned
Telegram:https://t.me/TechFlowDaily
X (Twitter):https://x.com/TechFlowPost
X (Twitter) EN:https://x.com/BlockFlow_News


