

Hotcoin Research | Décrypter le scénario de la hausse et de la baisse du bitcoin : analyse des tendances mensuelles du bitcoin et perspectives futures
TechFlow SélectionTechFlow Sélection
Hotcoin Research | Décrypter le scénario de la hausse et de la baisse du bitcoin : analyse des tendances mensuelles du bitcoin et perspectives futures
L'histoire ne se répète pas simplement, mais elle rythme sur des notes semblables.
1. Introduction
As the world's largest cryptocurrency by market capitalization, Bitcoin’s price movements have always attracted significant market attention. April and October are often referred to as "golden windows" for Bitcoin’s market performance. But does Bitcoin truly exhibit clear seasonal patterns? Are certain months more prone to gains or losses? If such patterns exist, what drives them? More importantly, can these historical trends guide future investment decisions?
In fact, with over a decade of trading history since its inception, substantial data indicates that Bitcoin’s price behavior does show notable monthly and seasonal tendencies. For example, certain months—such as October and November—tend to rise, while others—like September—typically perform weakly. These patterns may appear coincidental, but they conceal complex market cycles and macroeconomic factors.
This study will delve into Bitcoin’s historical monthly performance, analyze the underlying market logic and potential drivers in conjunction with macroeconomic contexts, and offer analysis and forecasts for the second half of 2025. Our goal is to help investors better understand Bitcoin’s seasonal trends and make more informed investment decisions.
2. Analysis of Bitcoin’s Historical Monthly Performance Patterns
By analyzing Bitcoin’s monthly price performance from 2013 to 2024, we find that Bitcoin indeed exhibits significant seasonal patterns. Monthly performances differ markedly—some months consistently trend upward, while others tend to decline.
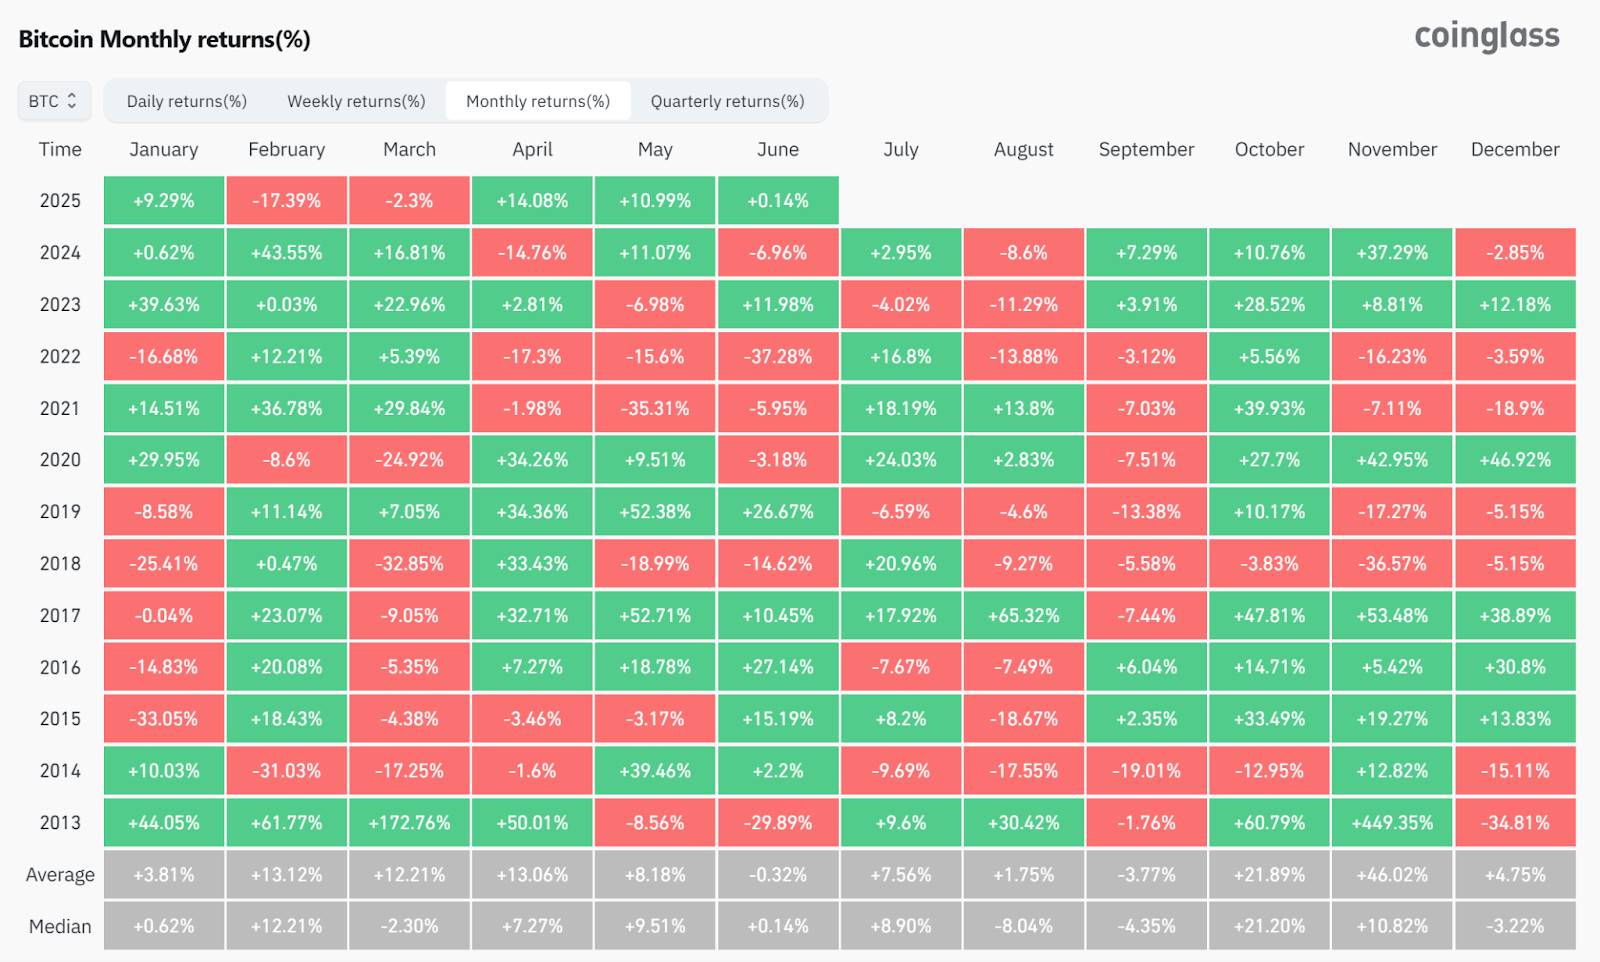
Source:https://www.coinglass.com/today
1. Strongest Performing Months: February, October, November
Historical data shows that Bitcoin typically performs exceptionally well in February, October, and November:
- February often sees strong rallies. Since 2013, major increases occurred in this month—for instance, +43.55% in 2024, +36.78% in 2021, and +61.77% in 2013. On average, February delivers a solid 13.12% gain, reflecting consistent strength.
- October is another favorable month, with high probability of gains and a stable historical average increase of 21.89%. Notably, October surged by 60.79% in 2013, 47.81% in 2017, and 27.7% in 2020—significantly outperforming most other months.
- November stands out as the strongest month annually, showing the highest average historical gains. For example, it rose 42.95% in 2020, 39.93% in 2021, and 37.29% in 2025. Its robust performance is especially pronounced during bull markets (e.g., 2020).
2. Weakest Performing Months: January, August, September
Conversely, Bitcoin has historically underperformed in January, August, and September:
- January has generally performed poorly, often experiencing sharp declines—such as -33.05% in 2015, -25.41% in 2018, and -16.68% in 2022. The average monthly return is low at just 3.81%. Although there were gains in 2020 and 2023, overall risk remains elevated.
- August also tends to be weak, frequently recording negative returns, with an average monthly gain of only 1.75%. Examples include drops of 13.88% in 2022, 8.6% in 2024, and 17.55% in 2014, reflecting generally bearish sentiment.
- September is particularly notable, commonly known as the "September curse," with an average monthly decline of -3.77%, clearly weaker than other months. For instance, it fell 13.38% in 2019, 3.12% in 2022, and 19.01% in 2014, showing persistent weakness.
3. Highly Volatile Months: April, May, July
Some months show positive overall performance but extreme volatility:
- April has a relatively strong average gain of 13.06%. It saw surges like +50.01% in 2013, +34.26% in 2020, and +33.43% in 2018. However, it also experienced sharp drops—-14.76% in 2024 and -17.3% in 2022—indicating high volatility.
- May is dubbed the “devil month” due to frequent wild swings. Gains reached +52.71% in 2017 and +52.38% in 2019, yet crashes followed—-35.31% in 2021 and -15.6% in 2022. Despite an average monthly rise of 8.18%, the high volatility makes timing difficult for investors.
- July shows generally positive momentum, averaging 7.56% gains. Notable increases occurred in 2020 (+24.03%), 2021 (+18.19%), and 2017 (+17.92%). Still, volatility is high, requiring careful risk management. Interestingly, when June sees a sharp drop, July often rebounds strongly.
4. Transitional Months: March, June, December
- March and June show more neutral trends. March averages +12.21%, while June hovers near zero (-0.32%). Both are directionally ambiguous, though March is slightly stronger. June often acts as a turning point.
- December tends to be stable, with a historical average gain of 4.75%. Year-end fund settlements and holiday effects often lead to consolidation or moderate gains.
Taken together, Bitcoin’s seasonal pattern emerges clearly: early-year weakness (especially January), springtime strength (February, April), mixed summer performance (July stronger than June and August), a frequent autumn trough in September, followed by a likely fourth-quarter rally (October–December). While variations occur year-to-year, this general trend is remarkably consistent. That said, specific market conditions and macro developments can cause deviations from historical norms.
3. Causes Behind Bitcoin’s Monthly Performance Patterns
Bitcoin’s seasonal trends are not random—they stem from multiple interwoven market dynamics and cyclical forces, including both internal crypto-market rhythms and broader macroeconomic influences.
1. Market Cycles and Capital Flows
Bitcoin’s famed “four-year cycle” plays a crucial role in shaping seasonality. Approximately every four years, Bitcoin undergoes a halving event, reducing block rewards by half. Historically, this scarcity mechanism triggers bull markets within 1–2 years post-halving. As a result, many past bull market peaks occurred in Q4—such as November–December 2013 and 2017, and November 2021. This concentration of bullish momentum toward year-end explains why October and November show outsized average gains. Conversely, bear markets following these peaks often begin around year-end or early January, dragging down performance in the first months of the year—evident in the downturns starting in early 2018 and 2022, making January one of the weakest months on average.
2. Macroeconomic and Traditional Market Seasonality
Macroeconomic cycles and traditional financial market seasonality also spill over into crypto. Many investors follow conventional wisdom such as “Sell in May,” leading to reduced risk appetite in late spring and early summer. This tendency manifests in Bitcoin’s weaker performance from May to June, followed by renewed inflows in the second half of the year, particularly in autumn. Additionally, fiscal and tax cycles in major economies—like the U.S.—influence investor behavior. For example, U.S. taxpayers often liquidate assets in April to cover tax liabilities, which may contribute to selling pressure in March–April. Once tax season ends, market stress eases, often triggering a rebound in mid-to-late April—consistent with the historically positive April performance.
3. Macro Data Releases and Policy Cycles
Seasonal macro events—such as mid-year monetary policy shifts or year-end liquidity adjustments—often amplify Bitcoin’s monthly price swings. The Federal Reserve’s interest rate decisions, typically scheduled in March, June, September, and December, impact global risk assets. As a highly volatile asset, Bitcoin often reacts sharply around these dates. Historical data suggests that tightening policies in the first half of the year correlate with weaker Bitcoin performance during spring and early summer. Conversely, expectations of easing or actual rate cuts tend to boost Bitcoin later in the year. The U.S. dollar index also exhibits an inverse relationship with Bitcoin prices: when the dollar weakens, Bitcoin often rallies several months later. For example, after the Fed’s aggressive stimulus in 2020 caused the dollar to plunge, Bitcoin surged from late 2020 through 2021. In contrast, the dollar’s 20-year peak in 2022 coincided with a prolonged Bitcoin bear market. By 2024–2025, inflation had cooled and the Fed paused rate hikes by late 2023, improving macro liquidity. Markets widely expect rate cuts beginning in 2024–2025, creating a more favorable backdrop for Bitcoin.
4. Investor Psychology and Market Participation
Market activity and trading volume fluctuate seasonally due to holidays and investor sentiment. End-of-year profit-taking and lower participation during holidays may explain the consolidation seen in December and weakness in January. In contrast, spring and Q4 see increased institutional engagement—after key FOMC meetings conclude and new capital allocations begin—boosting risk appetite. The final quarter is further fueled by “year-end performance chasing” and holiday optimism, with many investors aiming to capitalize on the seasonal upswing, thereby reinforcing Bitcoin’s strong finish to the year.
In summary, Bitcoin’s monthly patterns arise from the confluence of internal market cycles and external macro forces: halving-driven bull-bear transitions set the annual tone, while macro conditions and investor timing dictate when capital flows in and sentiment peaks. Across most years, these elements combine to produce the seasonal tendencies observed statistically. However, each year can deviate due to regulatory changes, black swan events, or unforeseen shocks.
4. Macroeconomic Environment and Market Context in 2025
The global macro environment is undergoing a pivotal shift shaped by multiple converging forces. Slowing U.S. economic growth, sticky inflation, and an impending transition from tight to loose monetary policy are reshaping capital flows. Geopolitical tensions, rising trade barriers, and supply chain reconfigurations continue to elevate systemic risks, affecting investor risk appetite. Traditional and crypto markets are diverging: institutions dominate, while retail investors grow cautious.
1. U.S. Macroeconomic Policy: Cautious Easing Amid Renewed Trade Tensions
In the first half of 2025, U.S. economic momentum weakened. Q1 GDP growth slowed to just +0.3% annualized, and unemployment rose to 4.2% in April. Inflation continued to ease, prompting the Fed to maintain a cautious stance between inflation control and employment stability. Since December 2024, the federal funds rate has been held steady at 4.25%–4.50%. As of June 2025, no official rate cut has begun. Although markets widely anticipate the first cut in Q3, the FOMC repeatedly emphasized the need for “more concrete evidence of weakening growth and declining core inflation.” Thus, policy expectations remain uncertain, fueling ongoing market speculation.
In May 2025, the White House announced steep new tariffs—raising rates to 60%–100%—on Chinese electric vehicles, batteries, semiconductors, and other strategic goods, reigniting U.S.-China trade tensions. China retaliated with counter-tariffs on U.S. chips and agricultural imports. This shift amid “re-globalization” directly threatens global supply chain stability and raises concerns about renewed inflationary pressures.
2. Global Security Landscape: Escalating Conflicts Rekindle Risk Aversion
Global security conditions worsened in 2025:
- The Ukraine war entered its third year, with ongoing stalemate despite reduced Western aid;
- Middle East tensions escalated, with border clashes between Israel and Lebanon and renewed fears over Iran’s nuclear program;
- Instability in East Asian waters intensified, with frequent military drills in the South China Sea and Taiwan Strait, raising risks of supply disruptions.
These uncertainties heightened fears of “systemic black swan” events. From April to June, gold prices broke above $3,000—an all-time high—and assets like U.S. Treasuries and Bitcoin saw concurrent capital inflows, signaling broad-based risk aversion.
3. Traditional Market Risk Appetite: Shift from Growth Chasing to Structural Defense
U.S. equities continued a structural bull run, but gains were concentrated in “mega-cap tech” and AI-related stocks. The S&P 500 rose ~6.2% in H1 2025, while small- and mid-cap stocks lagged. The Nasdaq’s ascent was driven largely by five dominant tech giants, showing early signs of valuation bubbles.
In fixed income, institutions increased allocations to long-dated U.S. Treasuries, flattening the yield curve—a sign that rate-cut expectations persist. High-yield and emerging market bonds faced capital outflows.
Overall, retail investors adopted conservative strategies, favoring low-volatility ETFs and short-duration bonds. Meanwhile, institutional capital showed a new trend: “overweight gold, overweight Bitcoin.”
4. Crypto Market Structure: Institutional Adoption Continues Amid Regulatory Uncertainty
Despite global uncertainty, Bitcoin demonstrated resilience in the first half of 2025. After breaking its all-time high of $110,000 in May, it entered a consolidation phase, trading between $103,000 and $105,000 by June—with narrowing volatility but strong support.
A key driver was sustained net inflows into U.S. spot Bitcoin ETFs. By June, products managed by BlackRock, Fidelity, ARK, and others surpassed $130 billion in AUM. Institutional perception of Bitcoin evolved from “speculative asset” to “digital gold and hedge instrument.”
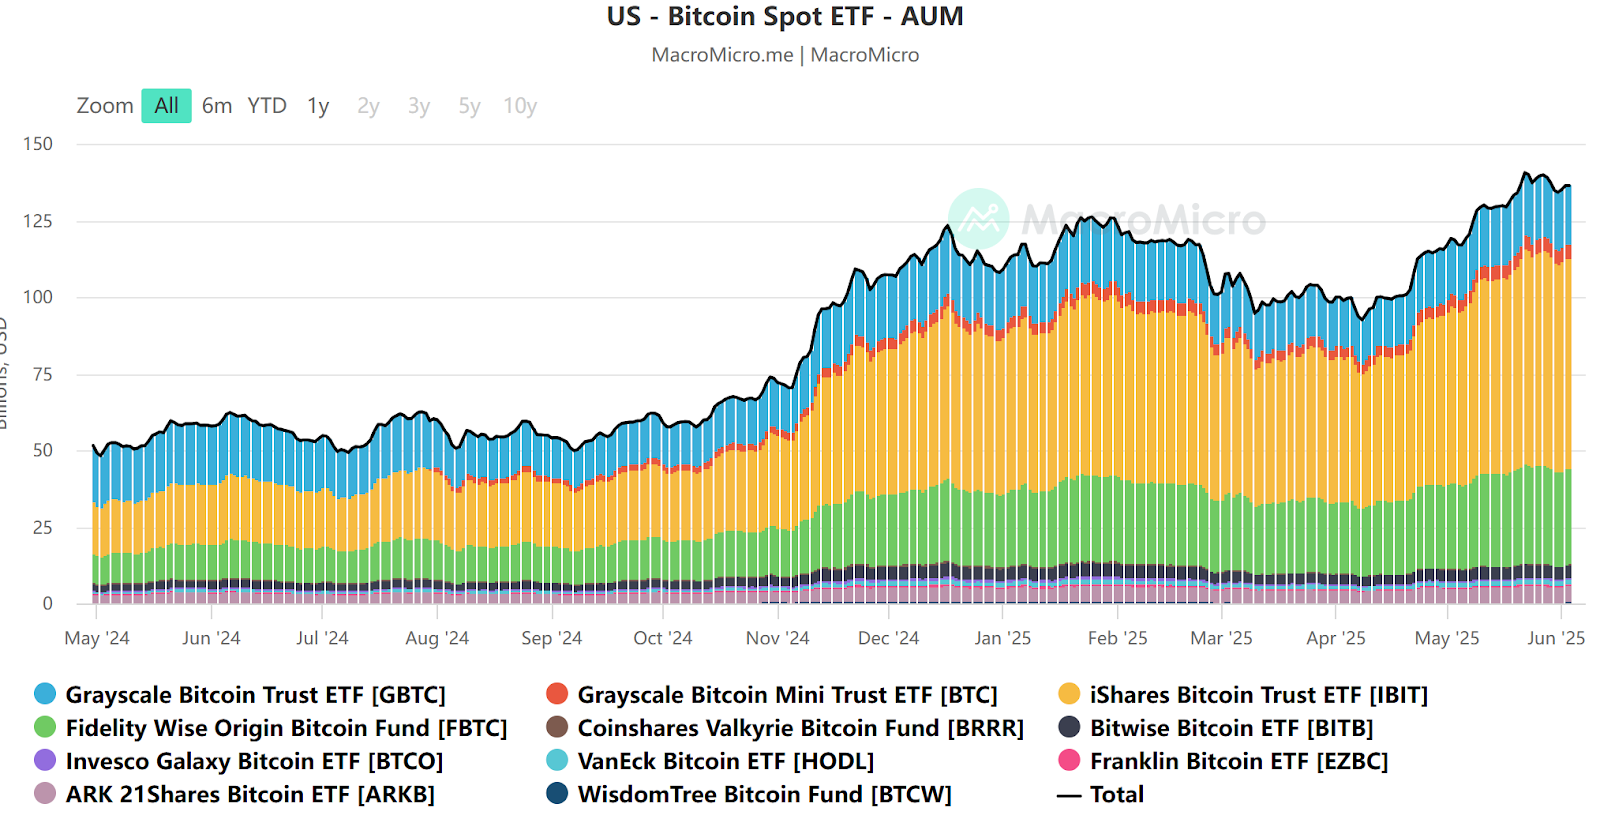
Source:https://en.macromicro.me/collections/3785/crypto/122014/us-bitcoin-spot-et-faum
On-chain data further confirms structural change: the proportion of long-term Bitcoin holders hit record highs; short-term active addresses and transaction counts dropped over 20% YoY; meme coins and altcoins lost steam. The market entered a mature phase dominated by core assets with diminished speculative fervor.
Regulatory-wise, the SEC continues internal debates on stablecoin oversight and DeFi classification, expected to become focal points before year-end. These developments are shifting crypto’s core liquidity from “retail speculation” toward “institutional long-term allocation,” enhancing Bitcoin’s resilience across market cycles.
5. Outlook and Summary: Bitcoin’s Trajectory from June to December 2025
Combining historical patterns and current macro conditions, we offer a preliminary outlook for Bitcoin’s monthly trajectory in H2 2025. Blending statistical trends with real-world dynamics—including economic cycles, Fed policy, and market sentiment—we aim to provide investors with a reference framework for risk management.
- June: Traditionally mixed. With the Fed still on hold and rate cuts delayed, Bitcoin is likely to consolidate between $100,000–$110,000, with shrinking volatility. Caution is advised—observe rather than chase rallies.
- July: Historically ~70% chance of gain. If June consolidates fully and the FOMC turns dovish, the first rate cut could spark inflows. A “low start, strong finish” is possible, with double-digit monthly gains.
- August: The traditional “summer lull.” With institutions on vacation and volumes thinning, technical pullbacks may emerge. Absent major macro catalysts, expect sideways-to-weak action—key support levels must hold.
- September: The “September curse” remains a threat. Third-quarter portfolio rebalancing and any disappointment on rate-cut magnitude could trigger a 10–15% correction. A break below key moving averages warrants strict leverage control.
- October: “Uptober” likely to repeat. If rate cuts begin in Q3, their liquidity effect should amplify in Q4. At 18 months post-halving, historical precedent favors entering the main bull phase. Watch for rising volume, price momentum, and on-chain revival—October could deliver substantial gains.
- November: Historically the strongest month—and potentially a turning point. If October’s momentum pushes sentiment to extremes, November may see a rapid blow-off top, testing $180,000–$200,000 amid high volatility.
- December: Direction depends on November. If November peaks, December may cool off with profit-taking. If November remains orderly, a slow grind higher could extend into year-end. Holiday-season thin liquidity may amplify swings. Regardless, the year-end close is likely to be more than double the opening price.
Summary: Based on Bitcoin’s historical seasonality and the 2025 macro backdrop, we expect continued upward momentum in H2 2025, albeit with volatility. June through September may bring setbacks and consolidation, but October to December could see strong rallies—potentially setting new records. However, crypto markets remain highly volatile and unpredictable. Black swan events could disrupt established patterns. Therefore, while positioning for the “broad trend,” investors must prioritize risk management and tactical flexibility. “History doesn’t repeat itself, but it often rhymes.” As we approach the second half of 2025, will Bitcoin once again echo past patterns? Only time will tell!
About Us
TechFlow Research, the core research hub of the TechFlow ecosystem, is dedicated to providing professional, in-depth analysis and forward-looking insights for global crypto investors. We offer a three-pillar service model—“trend assessment + value discovery + real-time tracking”—delivering deep industry trend analyses, multidimensional project evaluations, and round-the-clock market monitoring. Through our weekly “Top Coin Picks” livestream strategy sessions and daily “Blockchain Headlines” briefings, we equip investors at all levels with precise market interpretations and actionable strategies. Leveraging cutting-edge data models and extensive industry networks, we empower newcomers to build analytical frameworks and help institutional players capture alpha, jointly seizing value-growth opportunities in the Web3 era.
Risk Warning
Cryptocurrency markets are highly volatile and inherently risky. We strongly recommend that investors fully understand these risks and operate within a rigorous risk management framework to ensure capital safety.
Website:https://lite.hotcoingex.cc/r/Hotcoinresearch
Mail:[email protected]
Bienvenue dans la communauté officielle TechFlow
Groupe Telegram :https://t.me/TechFlowDaily
Compte Twitter officiel :https://x.com/TechFlowPost
Compte Twitter anglais :https://x.com/BlockFlow_News


