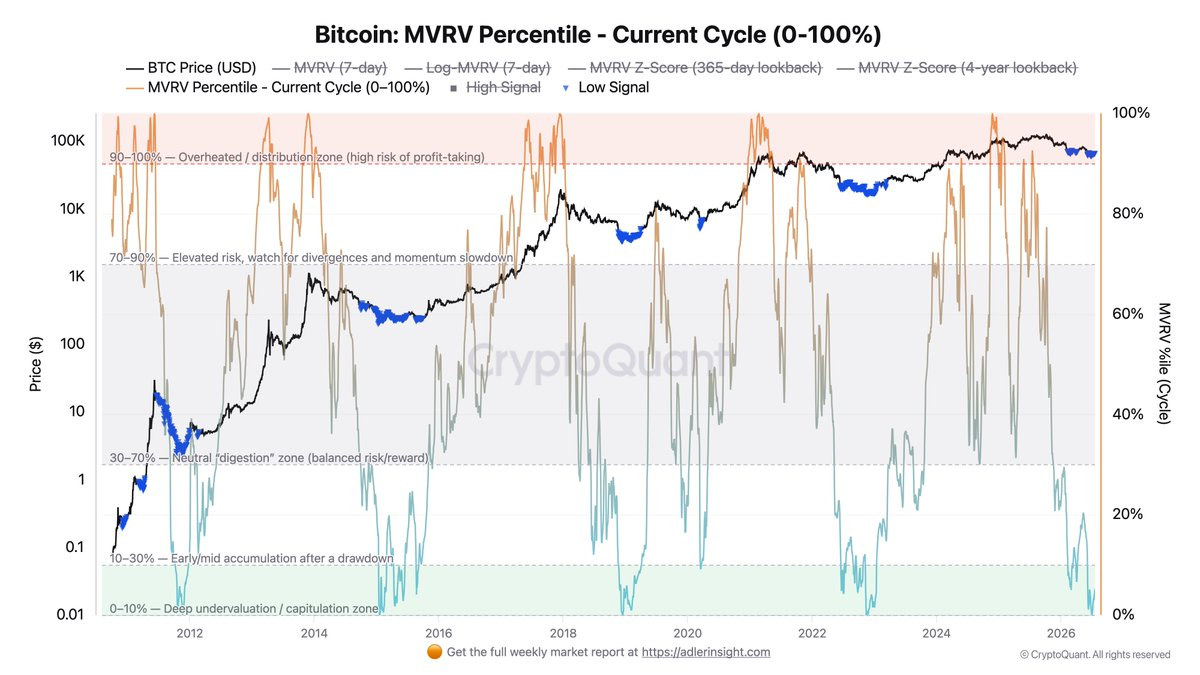
TechFlow News, July 21, CryptoQuant analyst Darkfost stated that following the "capitulation zone" in February this year when Bitcoin fell below $60,000 and the MVRV percentile dropped below 10%, this situation has reappeared since June.
He pointed out that the chart does not simply display the raw MVRV metric, but measures the relative position of the current MVRV in historical evolution, thereby adding a probability dimension to the metric against the backdrop of Bitcoin's structural changes and cycles, and reinterpreting it within the current market environment.
Data shows that currently BTC's MVRV is around the 5th historical percentile, meaning that 95% of the time Bitcoin's MVRV level is higher than the current value, reflecting that BTC is significantly undervalued compared to its historical evolution level. Historically, such phases usually correspond to long-term bottom regions.