GPUs Have No “Price”: Four Indices Clash, Making the Compute Market More Chaotic Than You Think
TechFlow Selected TechFlow Selected
GPUs Have No “Price”: Four Indices Clash, Making the Compute Market More Chaotic Than You Think
Computing power is being hoarded and sublet like short-term rental apartments.
Author: David Lopez Mateos
Translated by: TechFlow
TechFlow Intro: Media outlets love to summarize GPU compute pricing trends with a single number—but reality is far messier. On Bloomberg Terminals, four index providers quote prices for GPU compute that diverge by over $2, and their directional movements and timing are inconsistent. This article’s author, David Lopez Mateos—founder of the GPU compute trading platform Compute Desk—uses first-hand transaction data to unpack the real pricing structure of H100s and B200s, revealing a raw, pre-institutional market: one without a consensus benchmark, without standardized contracts, and without a forward curve—where compute is being hoarded and sublet like short-term rental apartments.
Media headlines suggest GPU compute prices are surging. This narrative is comforting—it fits neatly into the macro framework of “tight supply + insatiable AI demand”—and implies something reassuring: that we have a well-functioning market where price signals are clear and interpretable.
We don’t. This narrative rests almost entirely on a single index—and it implies something it shouldn’t: that the GPU leasing market has become efficient enough to be captured by a single number.
Supply constraints are real—but different participants experience scarcity in radically different ways, depending on who they are, where they’re located, what contract terms they trade, and which compute assets they use. Faced with such opacity, markets do not respond with orderly price discovery—they respond with hoarding: locking in GPU time you may not yet need, because you can’t be sure those GPUs will be available at any price next month. Where hoarding meets no transparent benchmark, fragmented secondary markets emerge. At Compute Desk, we’ve already facilitated tenants subleasing their clusters much like people sublet apartments during major sporting events. This isn’t hypothetical—it’s happening now.
Indices Don’t Converge
In mature commodity markets, indices built on different methodologies tend to converge. Brent and WTI crude oil exhibit multi-dollar spreads due to geography and quality differences—but they move in sync directionally (Figure 1). Such convergence is a hallmark of market efficiency.
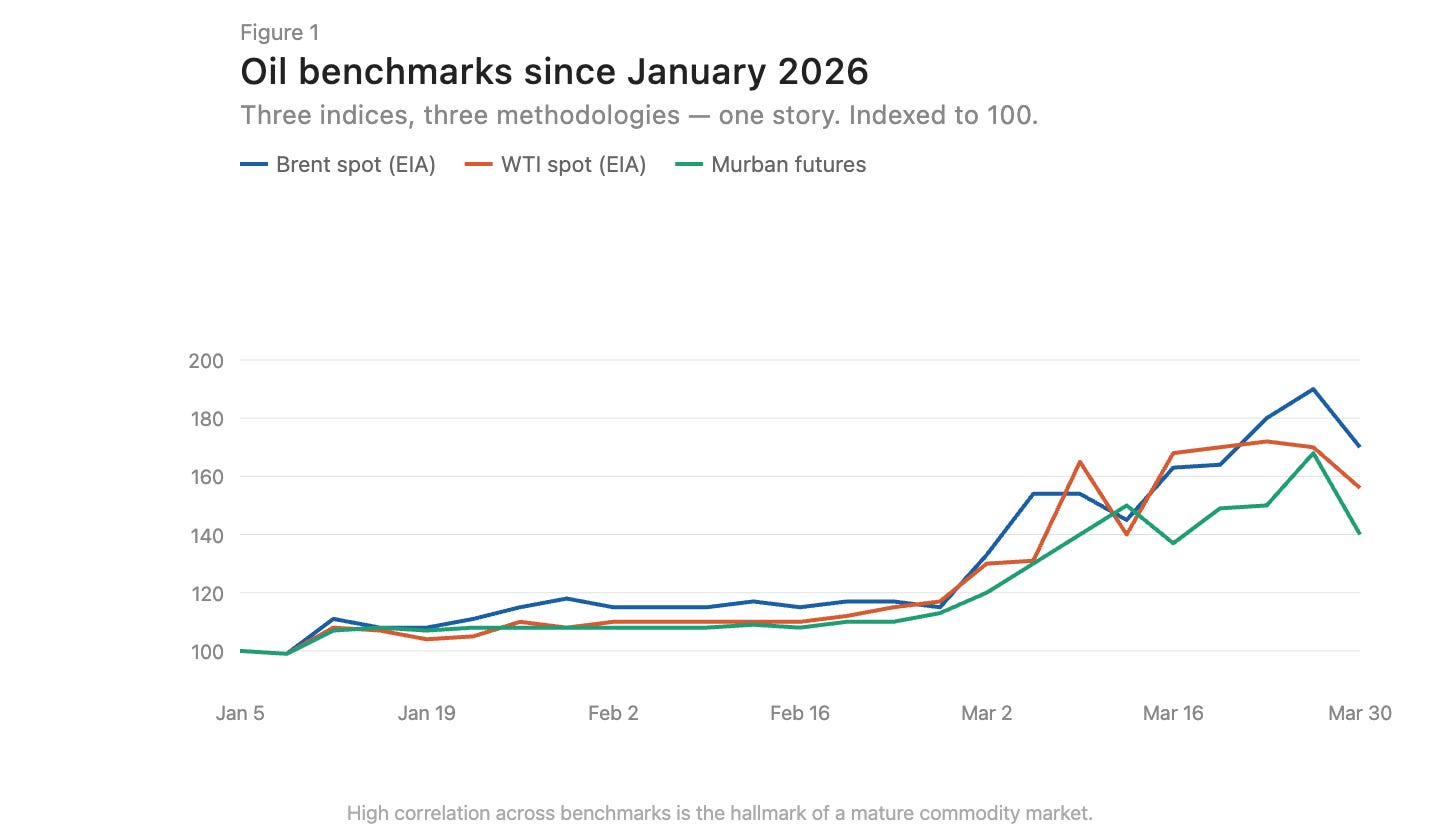
Caption: Brent vs. WTI crude oil price trends—highly aligned directionally
There are now three GPU pricing index providers on Bloomberg Terminals: Silicon Data, Ornn AI, and Compute Desk. SemiAnalysis has just launched the fourth—a monthly H100 one-year contract price index built from survey data across more than 100 market participants. Silicon Data and Ornn publish daily H100 leasing indices; Compute Desk aggregates data at the Hopper architecture level; SemiAnalysis captures negotiated contract prices—not listed or scraped prices. Their methodologies differ, their update frequencies differ, and their vantage points on the same market differ too. Overlay them, and the divergence becomes immediately apparent (Figure 2).
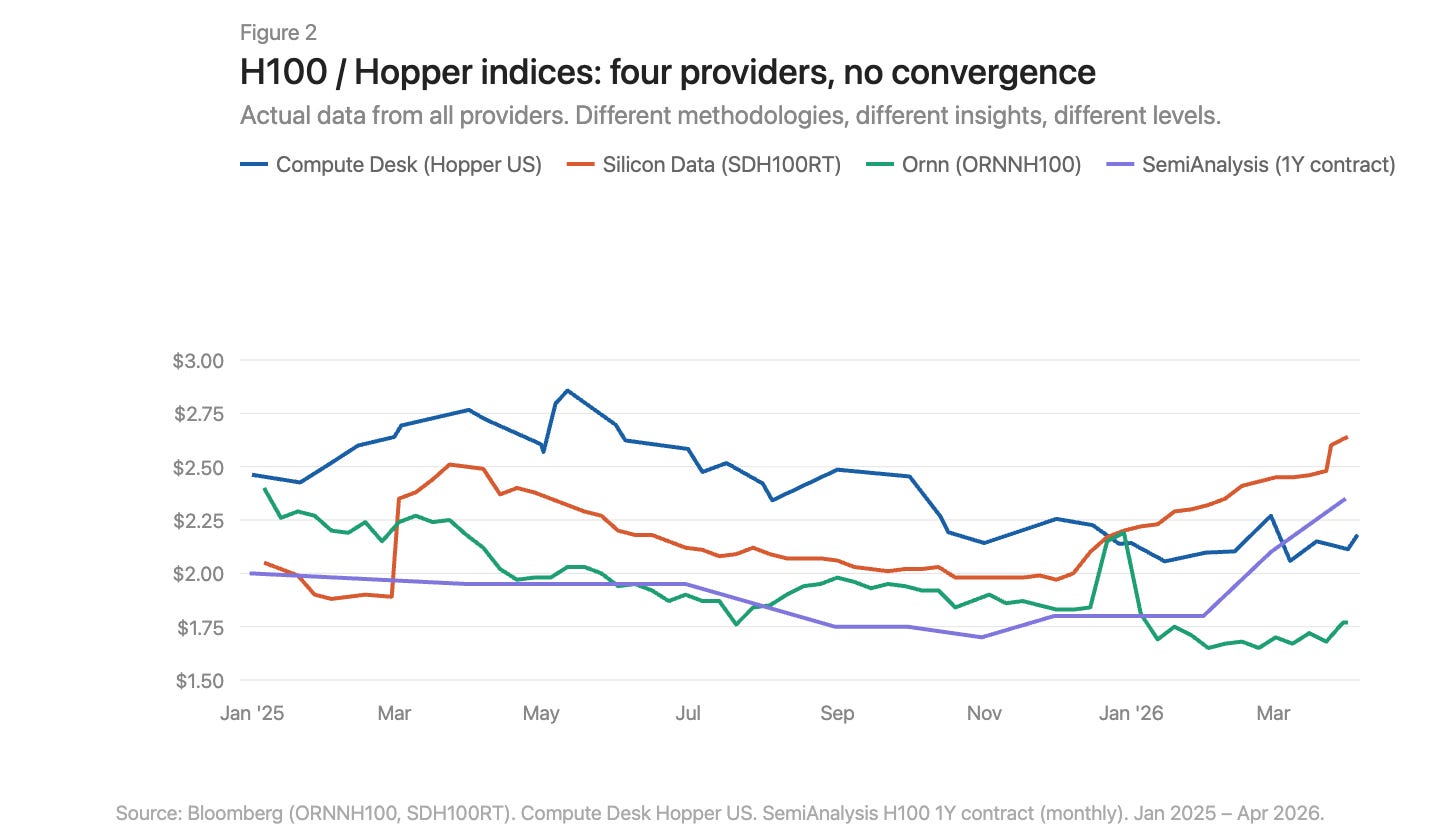
Caption: Overlay comparison of four GPU indices—clear divergence in both levels and trends
Where Exactly Is the Price Rising?
Using Compute Desk data, we can break down H100 price changes by supplier type and contract structure—and overlay them against Silicon Data’s SDH100RT index (Figure 3). All metrics show rising prices—but starting points and magnitudes vary dramatically across indices and contract types.
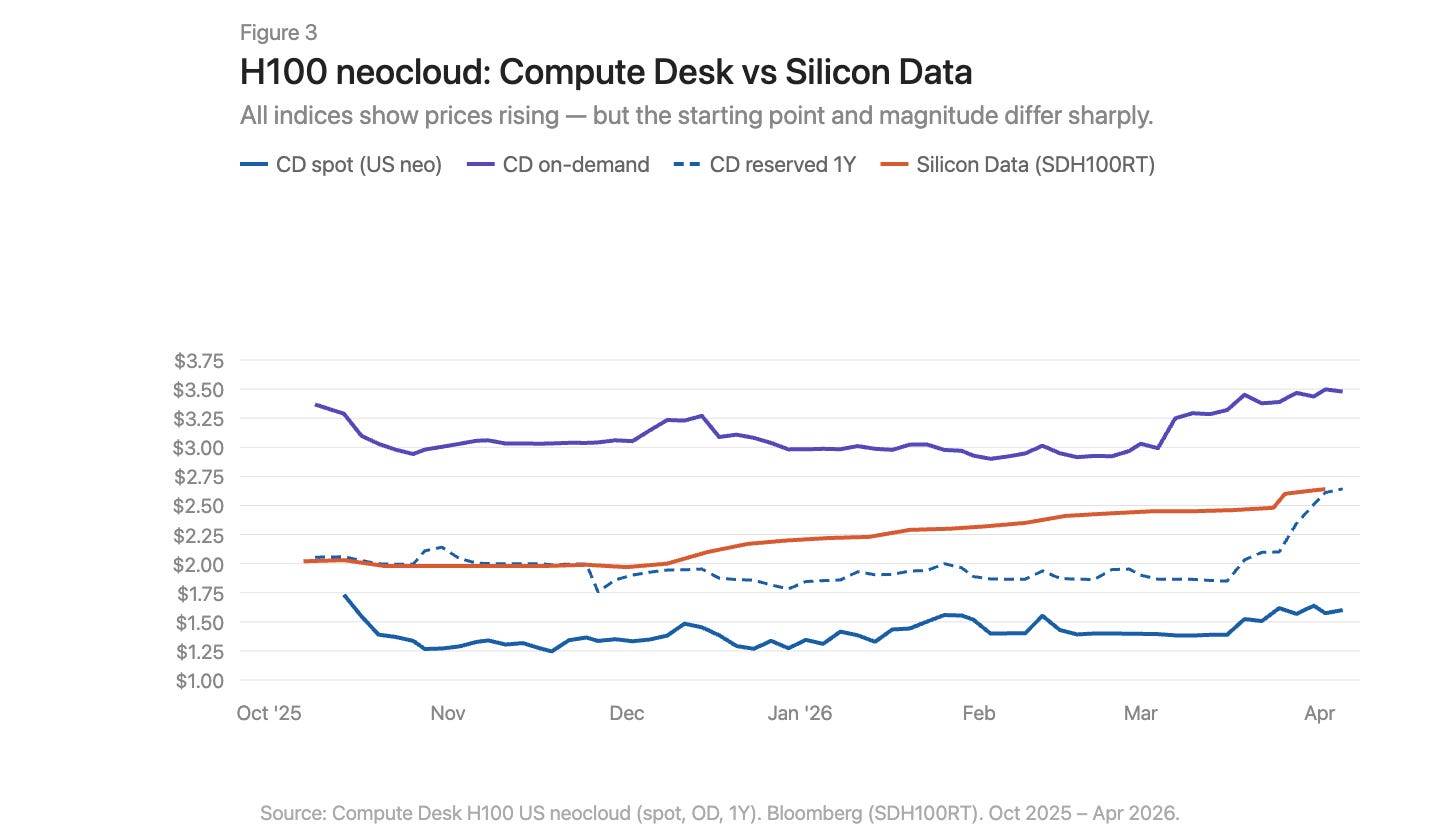
Caption: H100 price trends broken down by contract type, overlaid with SDH100RT index
Compute Desk’s H100 “Neocloud” data tells a more granular story than aggregated indices. On-demand pricing remained relatively stable all winter at ~$3.00/hour, then spiked sharply to $3.50/hour in March. Spot pricing was noisier and lower—only showing modest upward momentum beginning in March. Silicon Data’s SDH100RT followed a smoother, steadier ascent—rising from $2.00 to $2.64 over the same period. The two indices consistently sit at different absolute levels and tell different stories about timing: Compute Desk sees a March jump; Silicon Data sees gradual creep.
One-year reserved pricing held flat through February, then surged abruptly from $1.90 to $2.64 by end-March—not a gradual catch-up, but a sudden repricing. This looks more like suppliers collectively adjusting contract rates after tightening in the on-demand market—not sustained structural demand.
The March story for B200s is even more dramatic (Figure 4). Compute Desk’s on-demand index exploded from $5.70 to over $8.00 within weeks. Silicon Data’s SDB200RT soared from $4.40 to $6.11 before retreating to $5.47. Both indices capture the surge—but their starting points differ by over $2, and their shapes of rise and retreat diverge. With less than five months of B200 data, fewer suppliers, and wider spreads, the two indices are observing the same event through profoundly different lenses.
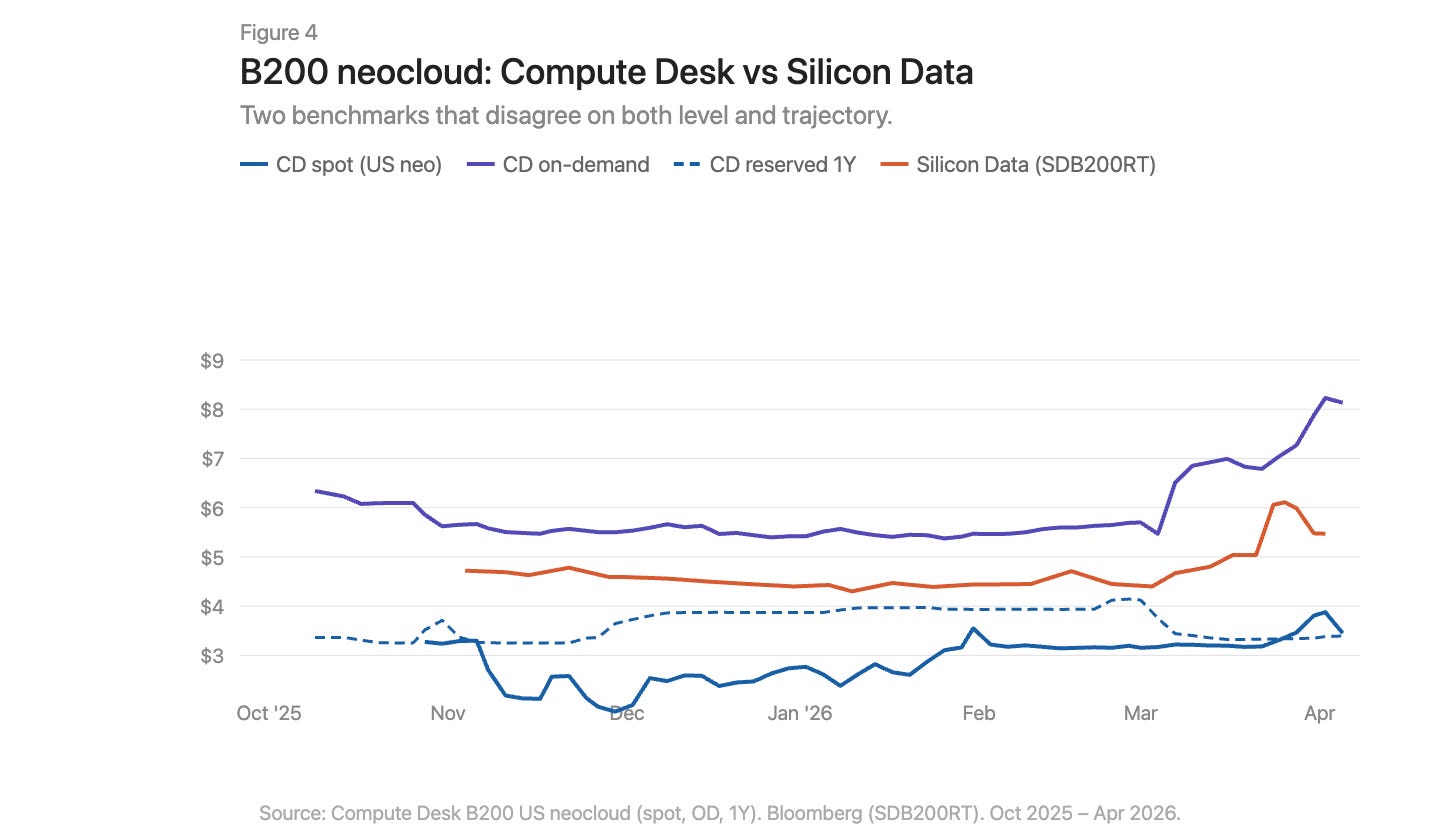
Caption: B200 on-demand and reserved price trends—Compute Desk and Silicon Data data overlaid
Infrastructure Gaps Go Far Beyond Geography
Commodity markets feature basis differentials. Appalachian natural gas is the textbook case: massive reserves sit atop structurally constrained pipeline capacity—the Pennsylvania-Ohio corridor routinely operates above 100% utilization, and new projects like the Borealis Pipeline won’t come online until the late 2020s.
The GPU market faces a similar situation: an H100 in Virginia and an H100 in Frankfurt are not economically identical. But geography alone cannot explain why indices measuring the *same* market diverge so wildly. GPU market dislocations run deeper than Appalachian gas. Gas suffers from a single missing link: pipeline capacity connecting supply and demand. In compute markets, infrastructure gaps exist on *both* sides. Physical infrastructure—consistent networks needed to reliably deliver compute, predictable configurations, predictable availability—is immature and sometimes nonfunctional. Financial infrastructure—standardized contracts, transparent benchmarks, and arbitrage mechanisms capable of compressing spreads *despite* physical differences—is equally absent.
The data tells a story. The lived experience of trying to procure compute in early 2026 tells a sharper, more painful one. On-demand capacity for *all* GPU types is effectively sold out. Securing 64 H100s is difficult: Compute Desk shows 90% of suppliers reporting zero available on-demand cluster capacity; the reserved market isn’t much better. In a well-functioning market, this degree of scarcity would have pushed prices to a new equilibrium long ago. It hasn’t. That suggests suppliers themselves lack real-time pricing intelligence to adjust. Prices are rising—but too slowly to clear the market. The gap between listed prices and actual willingness-to-pay is being filled by hoarding, subleasing, and informal secondary-market transactions.
What Needs to Change
The current GPU compute market suffers from seven core problems:
No consensus benchmark. Multiple indices coexist, each with distinct methodologies and contradictory conclusions.
Aggregated narratives obscure structure. A single “H100 price” hides enormous variation across supplier types and contract tenors.
Lack of trade-level data. In bilateral markets, the gap between listed and executed prices is extremely wide.
No contract standardization. Most GPU leases result from bespoke bilateral negotiations. Shorter, standardized contract tenors would improve liquidity and price discovery.
No assurance of delivery quality. Interconnect topology, CPU pairing, network stack, and uptime vary drastically. Buyers need to know exactly what quality of compute they’re purchasing before committing.
No contract liquidity. If demand shifts during a reserved period, options are limited: absorb the cost—or informally sublease. Markets need infrastructure enabling transfer or resale of committed compute, directing capacity to where it’s most needed.
No forward curve. Without forward pricing, there’s no hedging. That’s why lenders discount GPU collateral by 40–50%, keeping financing costs high.
Building a properly functioning market for the most important commodity of this century cannot proceed along a single axis. Measurement, standardization, contract design, delivery quality, and liquidity must advance in lockstep—until then, no one can truly say what a GPU-hour is worth.
Join TechFlow official community to stay tuned
Telegram:https://t.me/TechFlowDaily
X (Twitter):https://x.com/TechFlowPost
X (Twitter) EN:https://x.com/BlockFlow_News