

Hotcoin Research | Unveiling the Script Behind Bitcoin's Price Swings: Analysis of Bitcoin's Monthly Patterns and Outlook on Future Trends
TechFlow Selected TechFlow Selected
Hotcoin Research | Unveiling the Script Behind Bitcoin's Price Swings: Analysis of Bitcoin's Monthly Patterns and Outlook on Future Trends
History does not repeat itself simply, but it rhymes with similar cadences.
1. Introduction
As the world's largest cryptocurrency by market capitalization, Bitcoin's price movements have always attracted significant market attention. April and October are often referred to as "golden windows" for Bitcoin’s market performance. But does Bitcoin truly exhibit clear seasonal patterns? Are certain months more prone to price increases or declines? If such patterns exist, what drives them? More importantly, can these historical trends guide future investment decisions?
In fact, with over a decade of trading history, substantial data indicates that Bitcoin’s price behavior does show notable monthly and seasonal tendencies. For instance, certain months—such as October and November—tend to rise, while others—like September—typically underperform. These patterns may seem coincidental, but they reflect complex market cycles and macroeconomic dynamics.
This study will delve into Bitcoin’s historical monthly performance, analyze the underlying market logic in conjunction with macroeconomic contexts, and offer analysis and forecasts for the second half of 2025. Our goal is to help investors better understand Bitcoin’s seasonality and make more informed investment decisions.
2. Analysis of Bitcoin’s Historical Monthly Performance Patterns
By analyzing Bitcoin’s monthly price performance from 2013 to 2024, we find clear evidence of seasonal patterns. Different months display marked differences: some consistently trend upward, while others are more likely to decline.
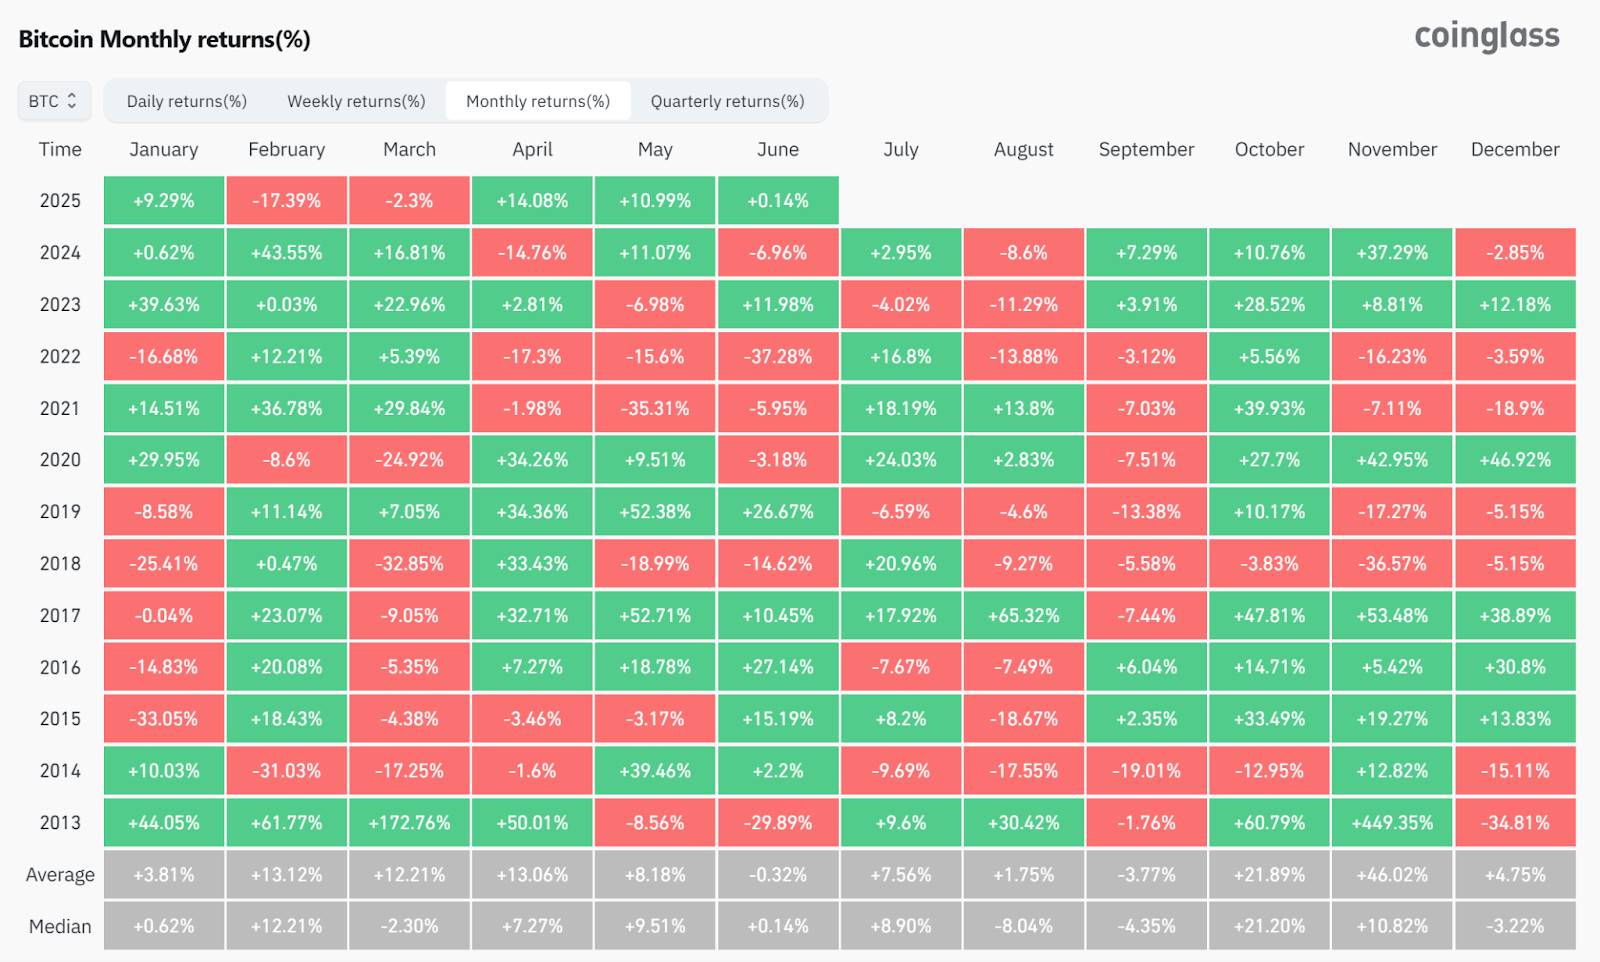
Source: https://www.coinglass.com/today
1. Strongest Performing Months: February, October, November
Historical data shows Bitcoin typically performs well in February, October, and November:
- February often sees strong gains. Since 2013, major rallies occurred in this month—43.55% in 2024, 36.78% in 2021, and 61.77% in 2013. On average, February posts a solid 13.12% gain, reflecting consistent strength.
- October is another favorable month, with high probability of gains and an average increase of 21.89%. Notably, October 2013 (+60.79%), 2017 (+47.81%), and 2020 (+27.7%) significantly outperformed most other months.
- November stands out as the strongest month historically, showing the highest average return. Examples include +42.95% in 2020, +39.93% in 2021, and +37.29% in 2025. The bullish momentum is especially pronounced during bull markets (e.g., 2020).
2. Weakest Performing Months: January, August, September
Conversely, Bitcoin has historically underperformed in January, August, and September:
- January tends to be weak, with sharp drops such as -33.05% in 2015, -25.41% in 2018, and -16.68% in 2022. Average monthly gain is only 3.81%, indicating relatively high risk despite occasional upswings (e.g., 2020, 2023).
- August also struggles, frequently posting negative returns with an average gain of just 1.75%. For example, August 2022 (-13.88%), 2024 (-8.6%), and 2014 (-17.55%) saw bearish sentiment dominate.
- September is particularly notorious—the so-called “September Curse”—with an average monthly loss of -3.77%. Notable declines include -13.38% in 2019, -3.12% in 2022, and -19.01% in 2014, underscoring its reputation for weakness.
3. Highly Volatile Months: April, May, July
Some months show positive bias overall but exhibit extreme volatility:
- April has a solid average gain of 13.06%. Notable rallies include +50.01% in 2013, +34.26% in 2020, and +33.43% in 2018. However, it has also seen steep losses—-14.76% in 2024 and -17.3% in 2022—highlighting high volatility.
- May is dubbed the “devil month” due to frequent wild swings. It surged +52.71% in 2017 and +52.38% in 2019, yet crashed -35.31% in 2021 and -15.6% in 2022. Despite an average gain of 8.18%, its unpredictability makes timing difficult.
- July generally performs positively (average +7.56%) but features alternating sharp rises and falls. For example, gains were +24.03% in 2020, +18.19% in 2021, and +17.92% in 2017. Notably, when June sees a significant drop, July often rebounds strongly.
4. Transitional Months: March, June, December
- March and June are relatively neutral. March averages +12.21%, while June nearly breaks even (-0.32%). Both are directionally ambiguous, though March is slightly stronger. June often acts as a turning point.
- December tends to be stable, averaging +4.75%. Year-end fund settlements and holiday effects often lead to consolidation or moderate gains.
Combining these observations, we can outline Bitcoin’s seasonal profile: early-year weakness (January), spring rallies (February, April), mixed summer performance (July stronger than June and August), a frequent low point in early autumn (September), followed by strong fourth-quarter momentum (October–December). While variations occur annually, this general trend remains evident. That said, each year’s unique market conditions and macro developments may cause deviations.
3. Reasons Behind Bitcoin’s Monthly Performance Patterns
Bitcoin’s seasonal trends are not random but driven by multiple interlocking market and macro factors—including internal crypto cycles and broader economic rhythms.
1. Market Cycles and Capital Flows
Bitcoin’s famed “four-year cycle” plays a key role. Approximately every four years, Bitcoin undergoes a halving event, reducing block rewards. Historically, this has triggered bull markets within 1–2 years afterward. As a result, many previous all-time highs occurred in Q4—November–December 2013 and 2017, and November 2021. This explains why October and November show large average gains: multiple bull runs peaked at year-end. Conversely, bear markets often begin near year-end or early January, dragging down subsequent months. For example, the downturns starting in early 2018 and 2022 contributed to January’s poor average returns.
2. Macroeconomic and Traditional Market Seasonality
Macroeconomic and traditional financial seasonality also spill over into crypto. Many investors follow conventional wisdom like “Sell in May,” leading to tighter liquidity and rising risk aversion after May, weakening June–July performance. In contrast, capital often re-enters markets in the fall. Additionally, fiscal and tax cycles in major economies (e.g., U.S.) influence investor behavior. For instance, U.S. taxpayers often liquidate assets in April to cover liabilities, potentially contributing to selling pressure in March–April. Once tax season ends, market stress eases, and prices often rebound—consistent with April’s historically strong performance.
3. Macro Data Releases and Policy Cycles
Seasonal macro events—such as mid-year shifts in monetary policy or year-end fund reallocations—often amplify Bitcoin’s monthly volatility. The Federal Reserve holds rate-setting meetings in specific months (March, June, September, December), impacting global risk assets. As a highly sensitive asset, Bitcoin reacts sharply around these times. Historically, Fed tightening in H1 correlates with weak Bitcoin performance in spring/summer. Conversely, expectations of easing—or actual rate cuts—tend to boost Bitcoin later in the year. The U.S. dollar index also inversely affects Bitcoin: dollar weakness often precedes Bitcoin rallies. For example, post-2020 Fed stimulus led to dollar depreciation and a massive Bitcoin rally through 2021. Conversely, the strong dollar in 2022 coincided with a prolonged Bitcoin bear market. From 2024–2025, as inflation cools and the Fed’s hiking cycle concludes, liquidity conditions improve. Markets widely expect rate cuts in 2024–2025, creating a supportive backdrop for Bitcoin.
4. Investor Psychology and Market Participation
Market activity and trading volume fluctuate seasonally. End-of-year holidays and New Year lulls reduce participation, sometimes triggering profit-taking or consolidation. Early-year weakness may stem from reduced liquidity. In contrast, spring and Q4 bring renewed activity: FOMC decisions settle, new budgets launch, and institutional flows resume—lifting risk appetite. Q4, in particular, benefits from “year-end performance chasing” and holiday optimism, encouraging investors to position for year-end rallies, thereby boosting Bitcoin’s late-year strength.
In summary, Bitcoin’s monthly patterns arise from the interplay of internal crypto cycles and external macro forces. Halving-driven bull-bear cycles set the annual tone, while macro conditions and investor rhythms determine timing. Together, these factors shape the seasonal trends we observe statistically. However, regulatory changes or black swan events can disrupt these patterns in any given year.
4. 2025 Macroeconomic Environment and Market Context
The global economy is navigating a period of converging uncertainties. Slowing growth, sticky inflation, and shifting monetary policy mark a transitional phase. Geopolitical tensions, rising trade barriers, and supply chain restructuring elevate systemic risks, influencing capital flows and investor sentiment. Traditional and crypto markets increasingly diverge: institutions lead the charge, while retail investors remain cautious.
1. U.S. Macroeconomic Policy: Cautious Easing Amid Renewed Trade Tensions
In early 2025, U.S. economic momentum weakened further. Q1 GDP grew just 0.3% annualized, and unemployment rose to 4.2% in April. Inflation continued to ease, but the Fed remained cautious between employment and price stability. Since December 2024, the federal funds rate has held steady at 4.25%–4.50%. As of June 2025, no rate cut has been initiated. Although markets widely anticipate the first cut in Q3, the FOMC repeatedly emphasized needing “more conclusive evidence of sustained economic softening and core inflation decline.” This keeps policy expectations and market speculation alive.
In May 2025, the White House announced steep new tariffs—60% to 100%—on Chinese EVs, batteries, semiconductors, and other strategic goods, reigniting U.S.-China trade tensions. China retaliated with tariffs on U.S. chips and agricultural imports. This shift toward “re-globalization” threatens supply chain stability and raises concerns about renewed inflation pressures.
2. Global Security Landscape: Rising Conflicts Fuel Risk Aversion
Global security deteriorated further in 2025:
- The Ukraine war entered its third year, with frontline stalemate persisting despite reduced Western aid;
- Middle East tensions escalated, with Israel-Lebanon border clashes and renewed fears over Iran’s nuclear program;
- Instability in East Asian waters intensified, with frequent military drills in the South China Sea and Taiwan Strait raising supply chain disruption risks.
These uncertainties heightened fears of “systemic black swans.” From April to June, gold surpassed $3,000—an all-time high—while U.S. Treasuries and Bitcoin both attracted inflows, signaling broad-based risk-off sentiment.
3. Traditional Market Risk Appetite: Shift from Growth to Structural Defense
U.S. equities maintained a structural bull run, concentrated in “mega-cap tech” and AI-related stocks. The S&P 500 gained ~6.2% in H1, but small- and mid-cap firms lagged. The Nasdaq’s ascent was driven largely by five dominant tech names, showing early signs of valuation bubbles.
In fixed income, institutional investors favored long-dated Treasuries, flattening the yield curve—reflecting persistent expectations of rate cuts. High-yield and emerging market bonds experienced capital outflows.
Overall, retail investors adopted conservative strategies, favoring low-volatility ETFs and short-duration bonds. Institutions, however, showed a new trend: “overweight gold, add Bitcoin.”
4. Crypto Market Structure: Institutional Adoption Accelerates Amid Regulatory Uncertainty
Despite global uncertainty, Bitcoin demonstrated resilience in early 2025. After breaking its all-time high above $110,000 in May, it entered a consolidation phase, trading between $103,000 and $105,000 by June—with narrowing volatility but strong support.
The main driver: sustained net inflows into U.S. spot Bitcoin ETFs. By June, products managed by BlackRock, Fidelity, ARK, and others reached over $130 billion in AUM. Institutional perception of Bitcoin shifted from “speculative asset” to “digital gold and hedge instrument.”
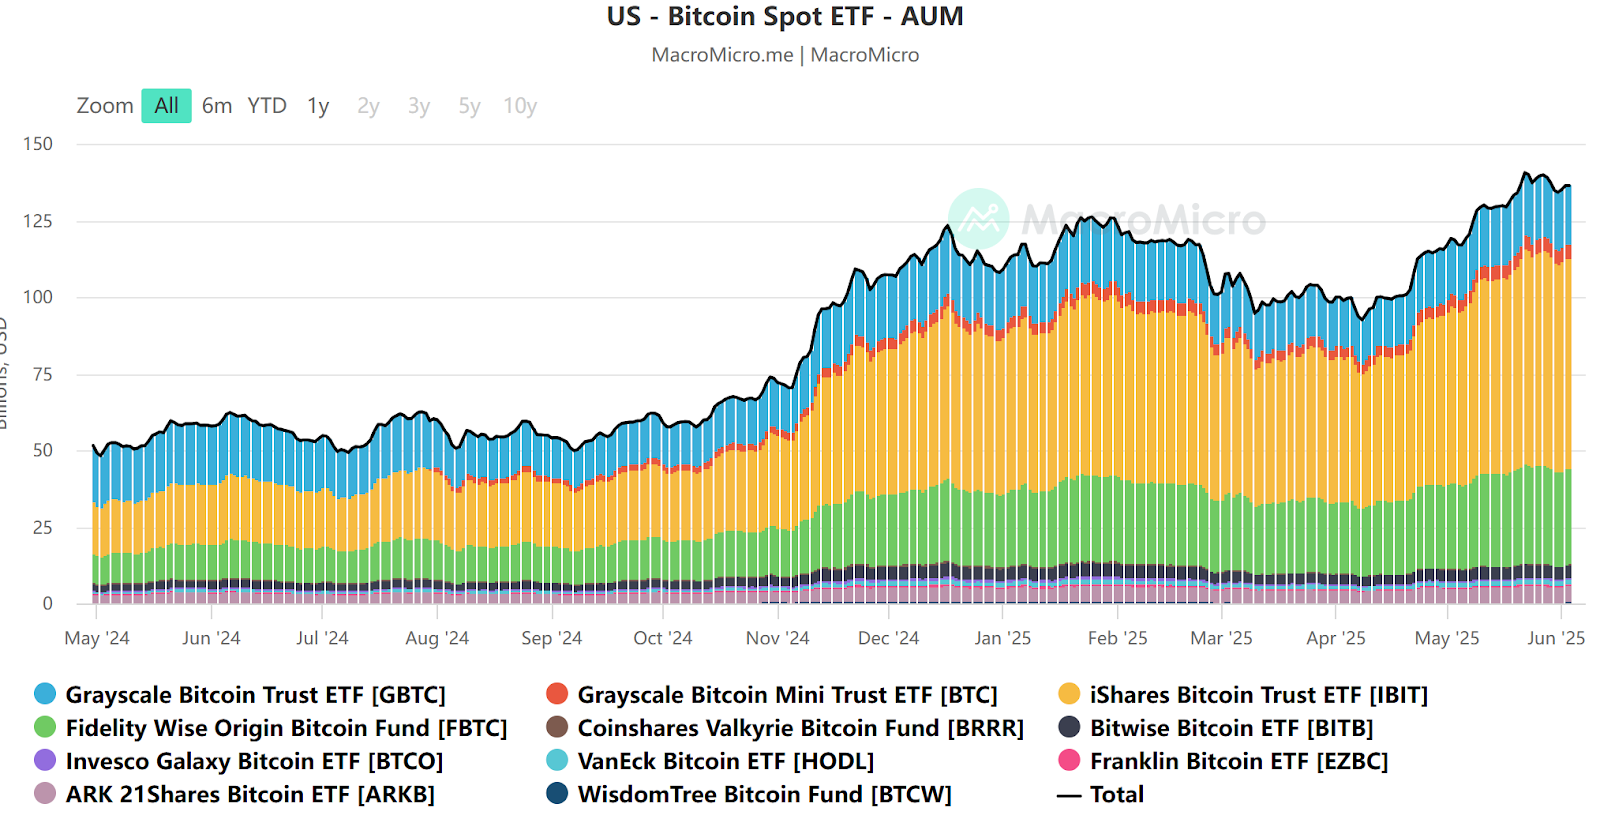
Source: https://en.macromicro.me/collections/3785/crypto/122014/us-bitcoin-spot-et-faum
On-chain data confirms structural change: the share of long-term holders hit record highs; short-term active addresses and transaction volumes declined over 20% YoY; meme coins and altcoins cooled significantly. The market entered a mature phase dominated by core assets with reduced speculative froth.
Regulatory-wise, the SEC continues internal deliberations on stablecoin oversight and DeFi classification, expected to become key issues before year-end. These factors collectively shift crypto liquidity from “retail speculation” to “institutional long-term allocation,” enhancing Bitcoin’s resilience across market cycles.
5. Outlook for Bitcoin’s 2025 H2 Performance and Conclusion
Based on historical patterns and current macro conditions, we offer a tentative outlook for Bitcoin’s monthly performance in the second half of 2025. Integrating statistical trends with real-world dynamics—economic cycles, Fed policy, market sentiment—we aim to provide investors with a reference framework for risk management.
- June: Traditionally balanced. With the Fed on hold and rate cuts delayed, Bitcoin is likely to trade sideways between $100K–$110K, with tightening volatility. Caution advised; better to watch than chase.
- July: Historically ~70% chance of gain. If June consolidates fully and the FOMC turns dovish, the first rate cut could spark inflows. Expect a “low start, strong finish,” with potential double-digit monthly gains.
- August: Classic “summer slump.” Institutional vacations and lower volume increase technical correction risks. With few major macro events, expect range-bound or slightly weak action—key support levels must hold.
- September: Beware the “September Curse.” Portfolio rebalancing and potential disappointment if rate cuts fall short could trigger a 10–15% pullback. Breach of key moving averages would demand strict leverage control.
- October: “Uptober” likely to repeat. If rate cuts begin in Q3, their liquidity impact amplifies in Q4. At 18 months post-halving, historical patterns suggest entry into the main bull phase. Watch for rising volume, price momentum, and recovering on-chain activity—potentially strong monthly gains.
- November: Historically the strongest month—and potential inflection point. If October fuels euphoria, November could see a rapid blow-off top, testing $180K–$200K amid extreme volatility.
- December: Direction depends on November. If November peaks, December may cool off with profit-taking. If November remains orderly, December could extend a slow bull run. Holiday thin liquidity may amplify swings. Year-end close is likely to be over double the January opening level.
Conclusion: Based on historical seasonality and the 2025 macro backdrop, we expect Bitcoin to continue rising through H2 2025 despite periodic corrections. June–September may see consolidation, but October–December could deliver strong gains, possibly setting new records. However, crypto remains highly volatile and unpredictable—black swan events can shatter established patterns. While leveraging historical insights, investors must prioritize risk management and adaptive strategies. “History doesn’t repeat itself, but it rhymes.” Whether Bitcoin echoes past patterns in the second half of 2025 remains to be seen—let’s wait and see!
About Us
TechFlow Research, as the core research hub within the TechFlow ecosystem, is dedicated to delivering professional, in-depth analysis and forward-looking insights for global crypto investors. We have built a three-pillar service framework—“trend assessment, value discovery, real-time monitoring”—offering deep industry trend analysis, multidimensional project evaluations, and round-the-clock market tracking. Through our weekly “Top Pick” strategy livestreams and daily “Blockchain Headlines” briefings, we provide precise market interpretations and actionable strategies for investors at all levels. Leveraging cutting-edge data models and extensive industry networks, we empower beginners to build analytical frameworks and help institutional players capture alpha, jointly seizing value growth opportunities in the Web3 era.
Risk Warning
Cryptocurrency markets are highly volatile and inherently risky. We strongly advise investors to fully understand these risks and operate within a robust risk management framework to safeguard capital.
Website: https://lite.hotcoingex.cc/r/Hotcoinresearch
Mail: [email protected]
Join TechFlow official community to stay tuned
Telegram:https://t.me/TechFlowDaily
X (Twitter):https://x.com/TechFlowPost
X (Twitter) EN:https://x.com/BlockFlow_News


