December Market Test: Can Bitcoin Rebound to $100,000? A Comprehensive Year-End Capital Markets Outlook
TechFlow Selected TechFlow Selected
December Market Test: Can Bitcoin Rebound to $100,000? A Comprehensive Year-End Capital Markets Outlook
This week will see several major global interest rate decisions, drawing extremely high market attention.
Author: Ostium
Translation: TechFlow

The views expressed in this article are solely those of the author and are intended for entertainment and informational purposes only. They do not constitute investment advice. For personalized investment guidance, please consult a qualified professional.
In the 15th edition of Ostium Research's market outlook, we team up with @cointradernik to analyze the market dynamics for the coming week, focusing on price movements, market positioning, and potential event risks for Bitcoin, Ethereum, gold, copper, and the U.S. Dollar Index.
Key Economic Calendar This Week
This week features several major central bank interest rate decisions globally, drawing significant market attention:
-
Tuesday: Reserve Bank of Australia (RBA) rate decision (expected 4.35%, previous 4.35%)
-
Wednesday: U.S. Consumer Price Index (CPI) year-on-year (November) (expected 2.7%, previous 2.6%)
-
Wednesday: Bank of Canada (BOC) rate decision (expected 3.25%, previous 3.75%)
-
Thursday: Swiss National Bank (SNB) rate decision (expected 0.75%, previous 1.0%)
-
Thursday: European Central Bank (ECB) rate decision (expected 3.0%, previous 3.25%)
-
Thursday: U.S. Producer Price Index (PPI) year-on-year (November) (expected 2.5%, previous 2.4%)
Bitcoin
Current Price: $99,460
Weekly Analysis
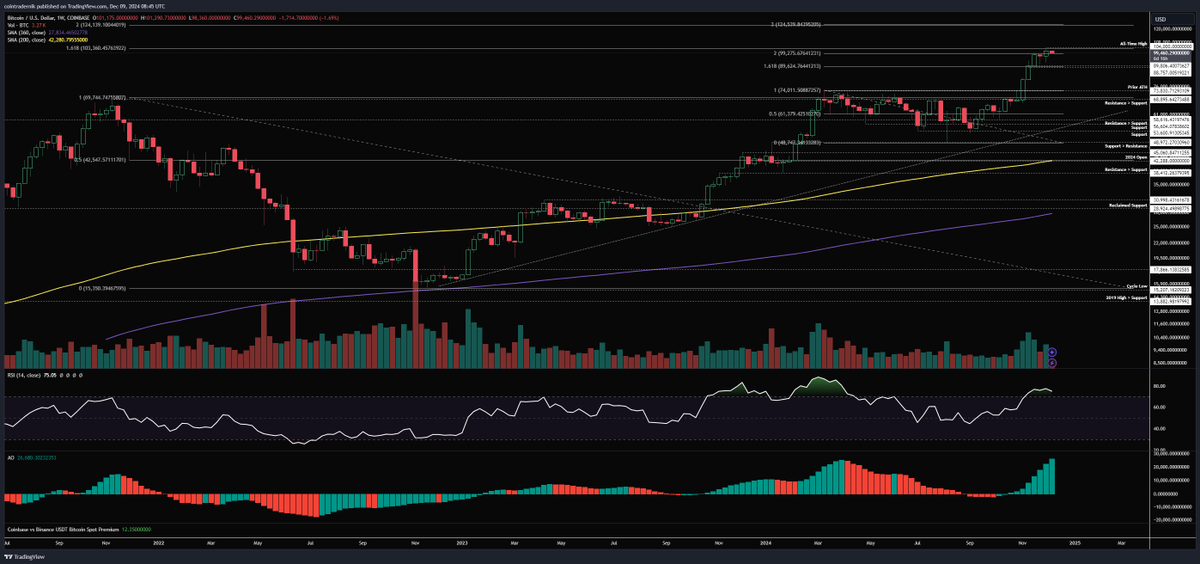
Last week, Bitcoin closed above $100,000 for the first time in history, surpassing its prior two weekly highs just under $99,000. Despite slightly lower volume, price momentum remains strong, and the weekly structure stays bullish. Bitcoin has now firmly broken above a key resistance zone; if this level gains further market acceptance, additional upside could follow.
However, it’s important to note that Bitcoin’s price action this year closely follows an “11-week lagged M2SL/DXY liquidity correlation,” which has almost perfectly predicted Bitcoin’s price moves throughout 2024. If this correlation persists, Bitcoin may enter a multi-week correction phase starting this week, with the bottom potentially forming between late January and early February next year.
Alternatively, this correlation could break down. If weekly price structure and momentum dominate instead, Bitcoin could resume its rally toward ~$125,000—the next major resistance zone.
Key Watch Levels:
-
If this week closes above last week’s high at $104,000, it would suggest the correlation has broken, opening the path toward $125,000 by year-end.
-
If prices fail to hold above $104,000 and instead fall below $99,000, it may indicate the correlation remains intact, increasing the likelihood of deeper pullbacks before January, possibly extending below $89,000.
In short, this is a pivotal week for Bitcoin, warranting close attention.
Daily Analysis:
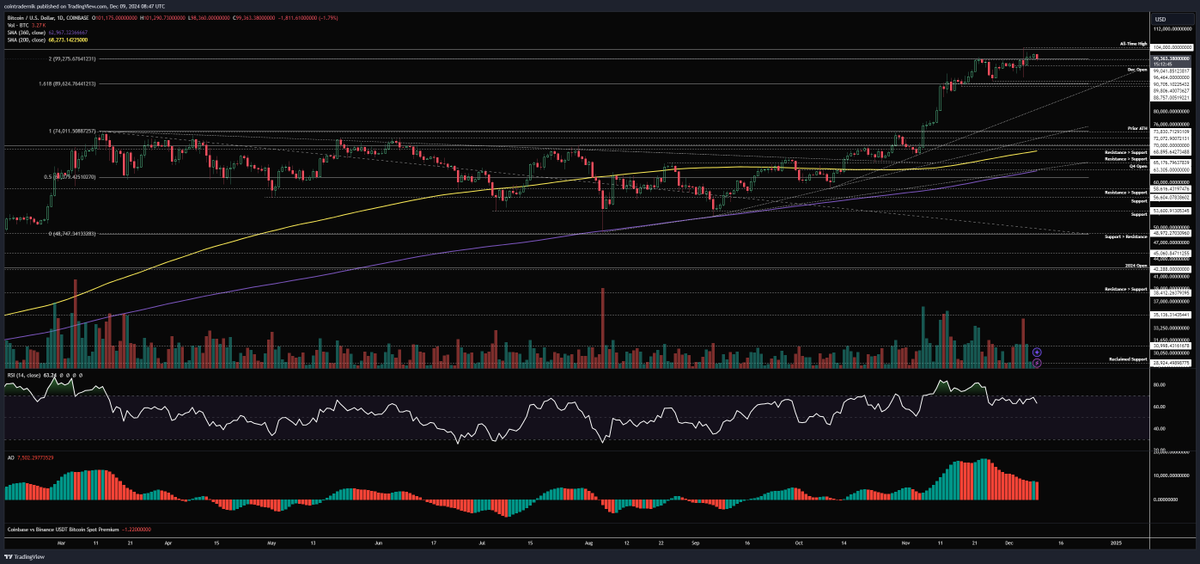
On the daily chart, Bitcoin’s momentum is beginning to weaken. The series of higher lows formed in RSI (Relative Strength Index) since August may now be reversing. A break and sustained close below RSI 50 could signal the start of a corrective phase. That said, momentum hasn’t fully collapsed yet, and the daily structure remains bullish. Any early-week pullback is likely to retest last week’s high, and the market’s reaction will determine the next directional move. A daily close above $104,000—turning that level into support—would open the door to $125,000. Conversely, failure to hold that level and a drop below $99,000, especially below December’s open at $96,500, would suggest exhaustion of bullish momentum.
Bullish strategy: If prices continue a slow pullback early in the week without reaching the weekly open or high (set early in the week), consider initiating long positions near the December open. Add to longs once price regains and holds above $99,300 as support, targeting a new high at $104,000 later in the week. Such a pattern would increase the odds that the historical correlation has broken down.
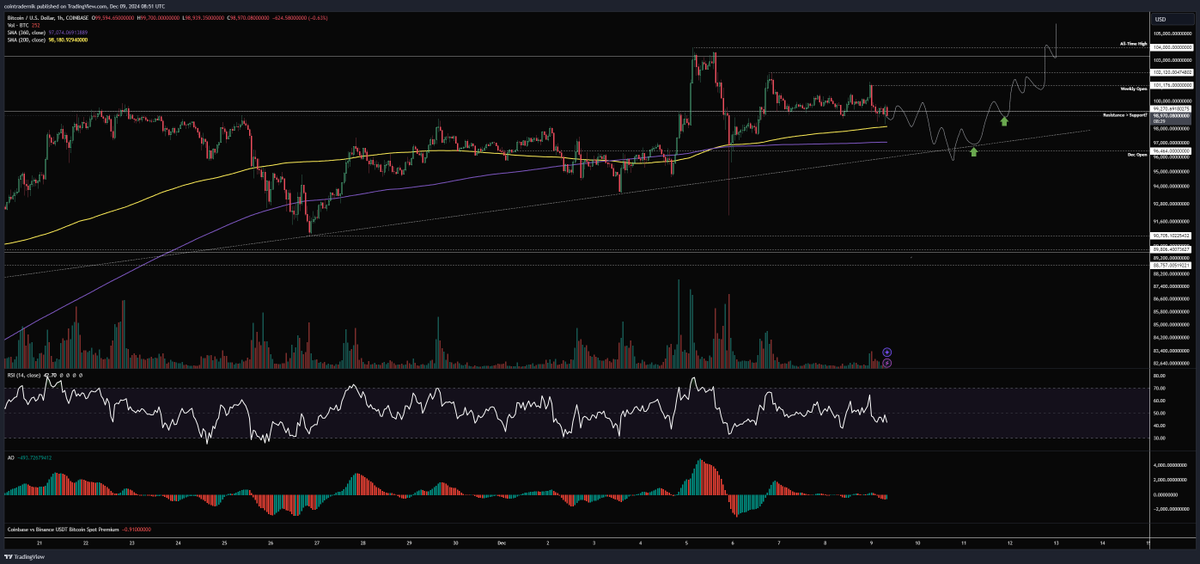
Bearish strategy: If price briefly spikes above the weekend high to $104,000 but is then rejected and drops below the week’s opening price at $101,200, it could trigger long liquidations and accelerate downside pressure. Later in the week, the trendline support may be tested, reinforcing the view that the historical correlation remains valid and a broader correction is underway.

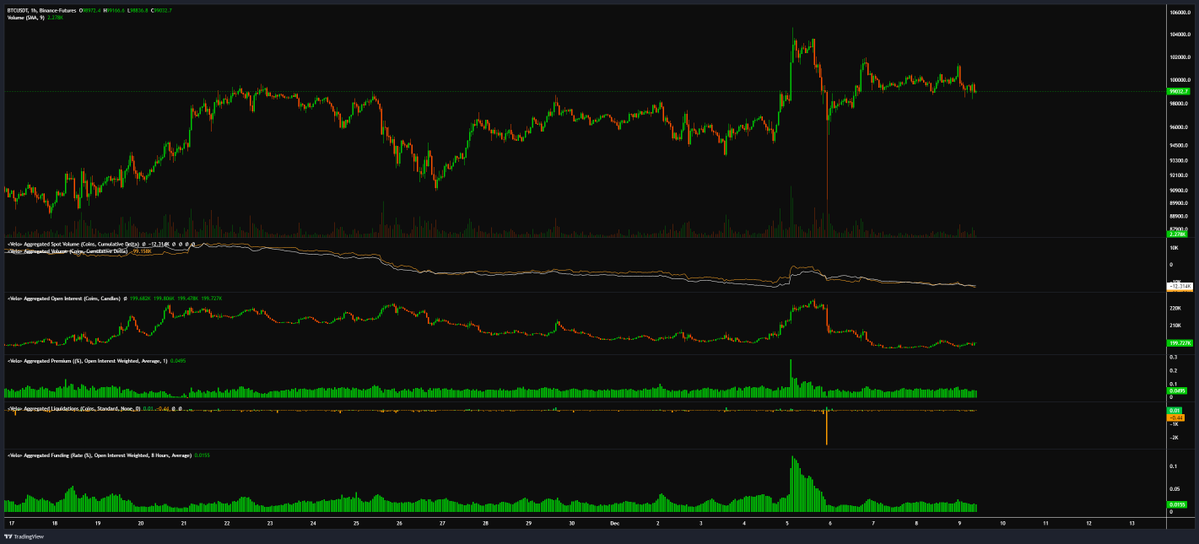
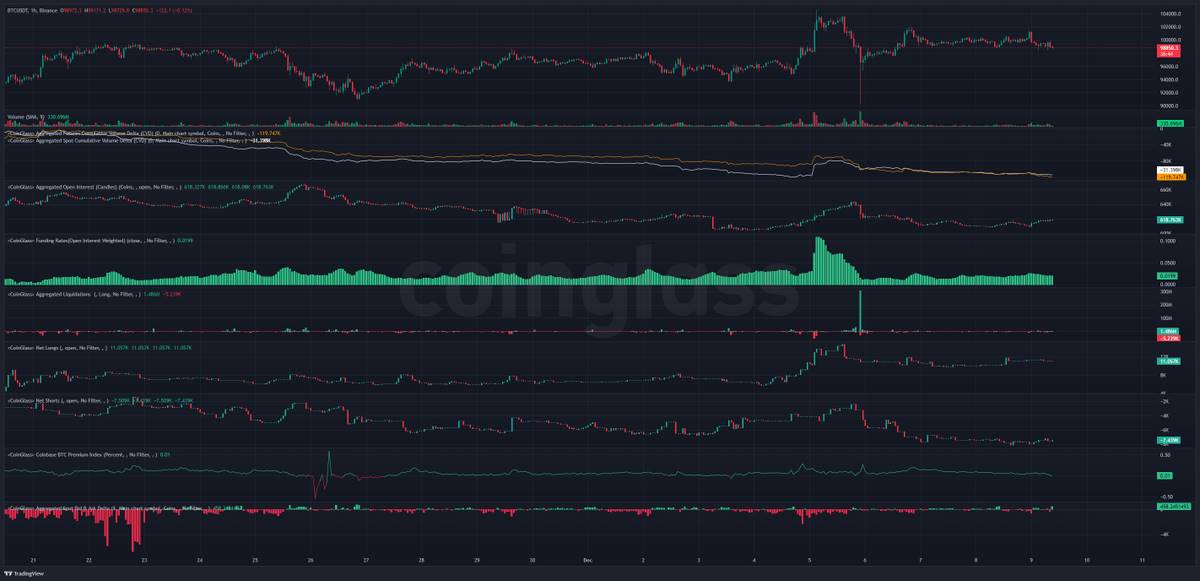
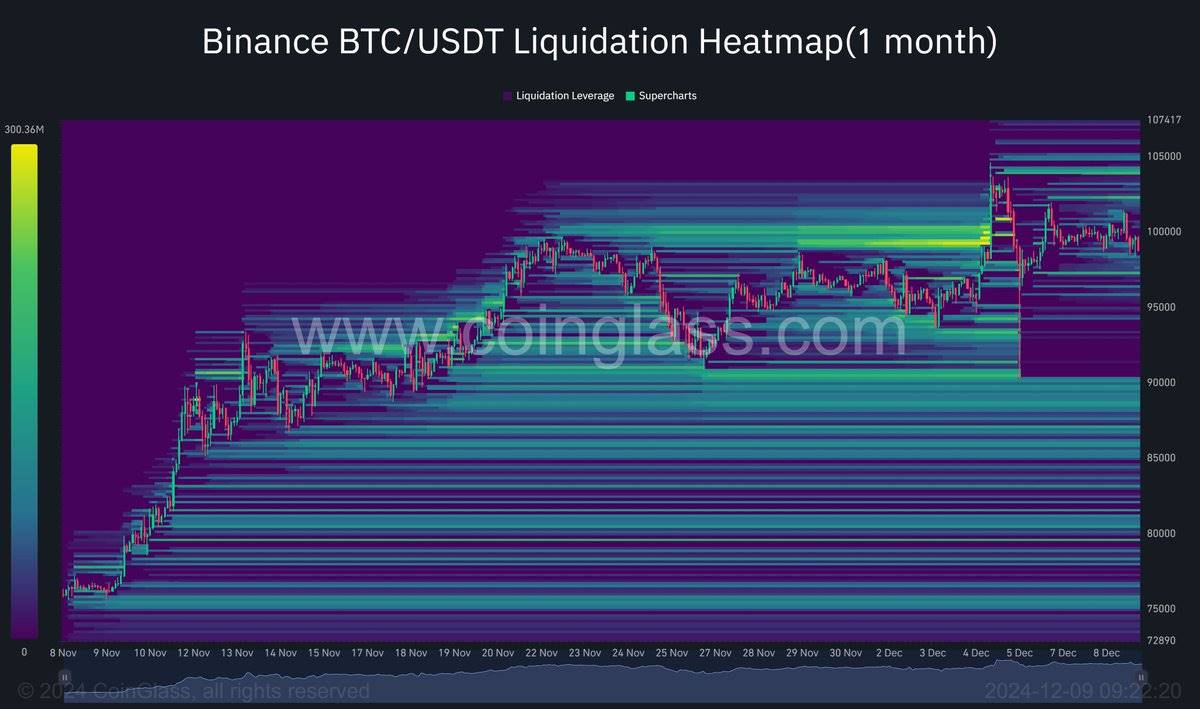
Current positioning data shows that last week’s flash crash cleared out excessive leverage in the derivatives market, creating a healthier environment for a potential breakout above $104,000. This is further supported by changes in three-month annualized basis and liquidation levels.
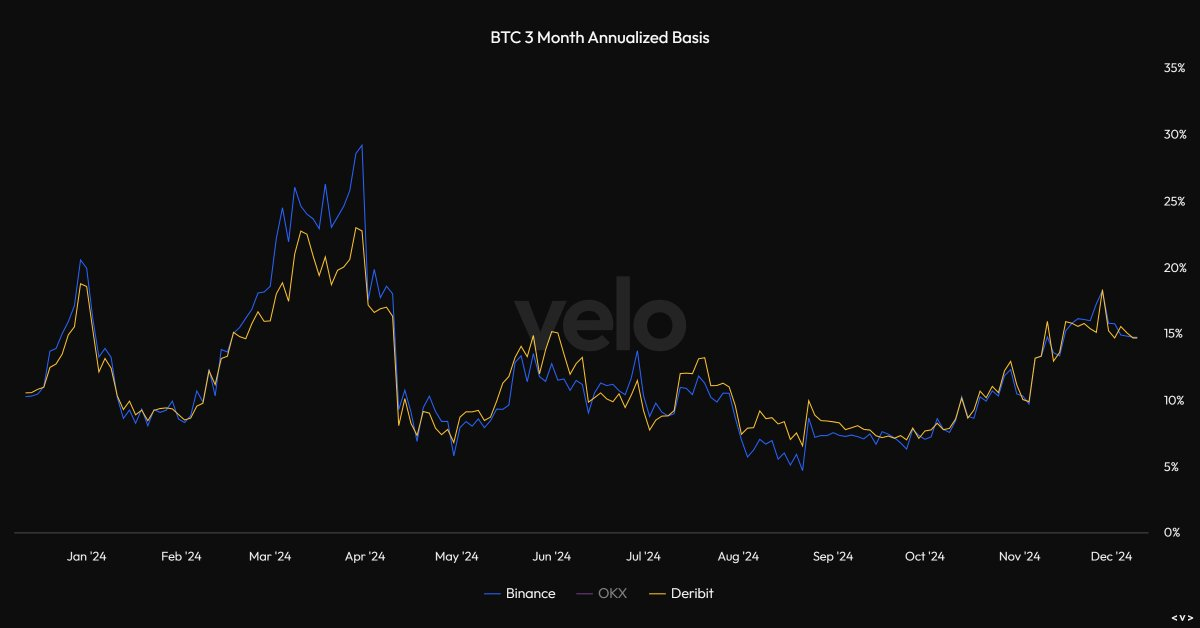
This is further confirmed by the three-month annualized basis:
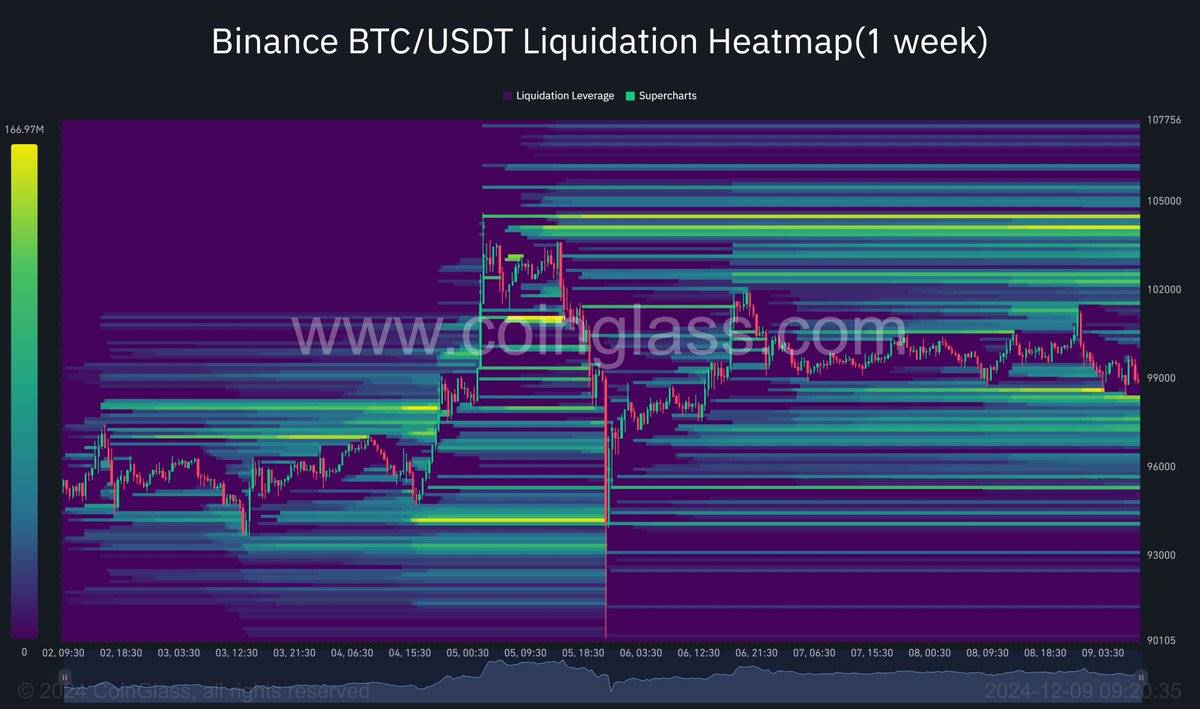
Below are also shown the expected one-week and one-month liquidation levels.
Ethereum
Current Price: $3,863
Weekly Analysis
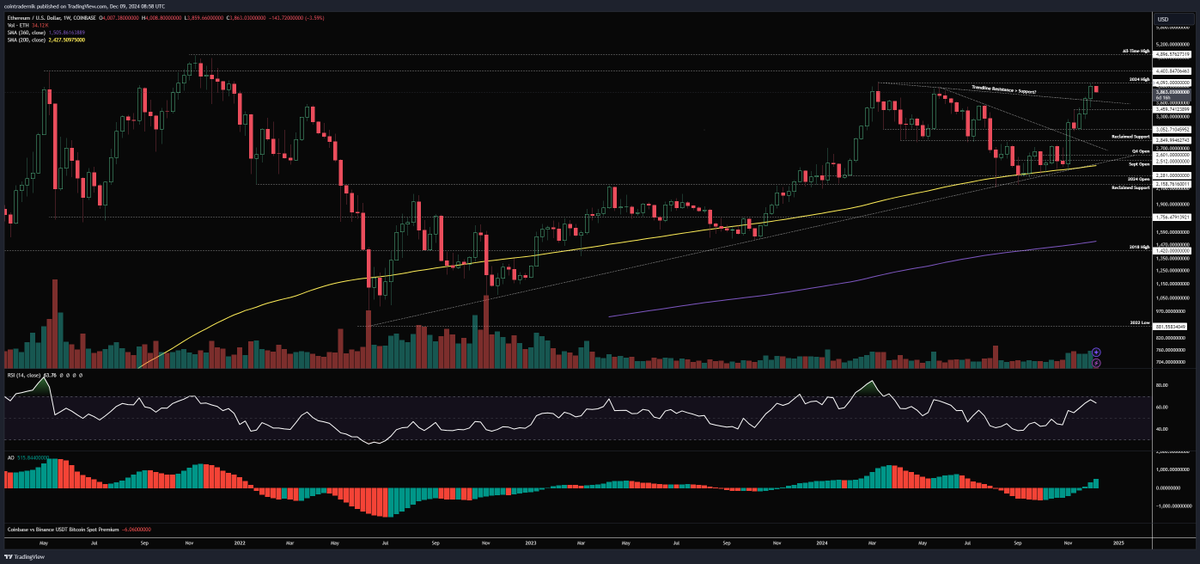
Last week, Ethereum decisively broke above its final trendline resistance and found support above it, rallying to a yearly high of $4,093 before closing around $4,000, accompanied by rising volume and momentum. If price retests this trendline this week, it is expected to act as support, pushing price back toward $4,093. A weekly close above that level could open the path toward $4,400 and even challenge the all-time high near $4,900. Given the current structure and momentum, Ethereum remains strongly bullish. I believe Ethereum will continue to strengthen through year-end, even if Bitcoin corrects. Only a weekly close below $3,450 would require reassessment of the bullish thesis.
Daily Analysis
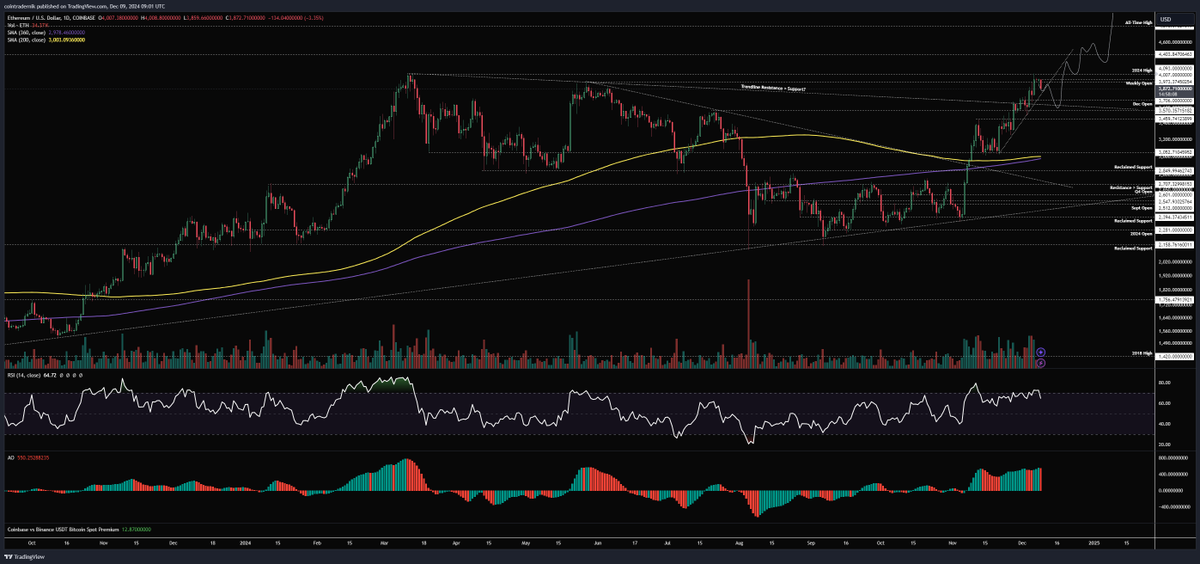
The daily chart shows Ethereum’s trendline support from mid-November remains intact. As long as price holds above this trendline, a low is likely to form early this week, followed by a daily close above the 2024 high at $4,093—turning it into support—and driving further upside into 2025. A break below the trendline could see a pullback to December’s open at $3,700, where it may find new support before resuming higher.
ETH/BTC Analysis
Weekly Analysis
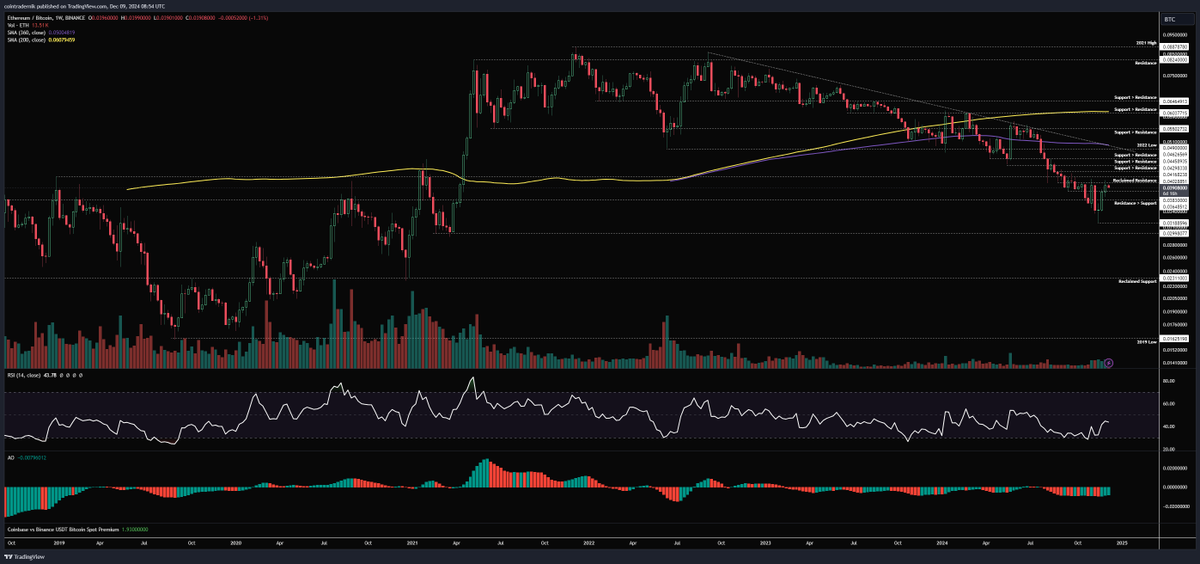
On the weekly chart, ETH/BTC continues its rebound momentum from last week, rising to resistance near 0.0403 and closing at 0.0396. This week, a further breakout above 0.0403 is expected, testing 0.0417—the decisive resistance level. A sustained break above 0.0417 could trigger a larger reversal, targeting the long-term trendline resistance and the 2022 low at 0.049. A rejection from this zone and drop below 0.0383 would suggest a failed bottom formation. The weekly structure turns bullish upon acceptance above 0.0417.
Daily Analysis:
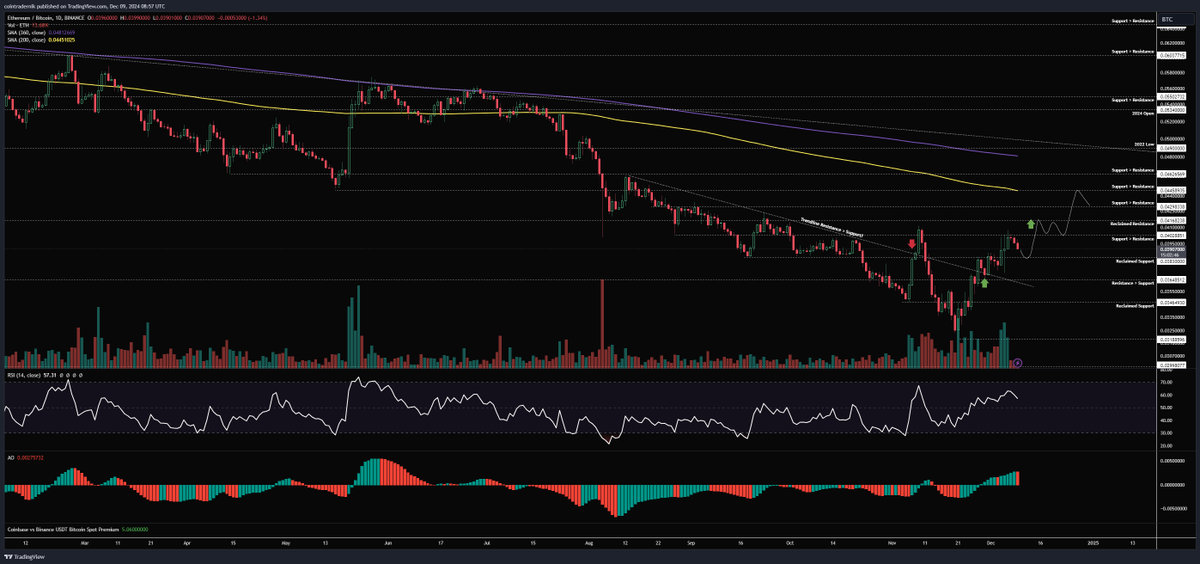
From a daily perspective, our prior expectation—that a breakout above the local trendline resistance would not result in a false breakout—has proven correct. The trendline has now shifted from resistance to support, fueling further upward momentum. We expect 0.0383 to become the new support level. This week, price is likely to break and hold above 0.0403 before testing 0.0417. Near this critical level, consolidation may occur to confirm the validity of the breakout. Once 0.0417 is cleared, the next target is the 200-day moving average (200dMA) at 0.0445, which could serve as a key resistance zone for subsequent rallies.
Gold
Current Price: $2,650
Weekly Analysis
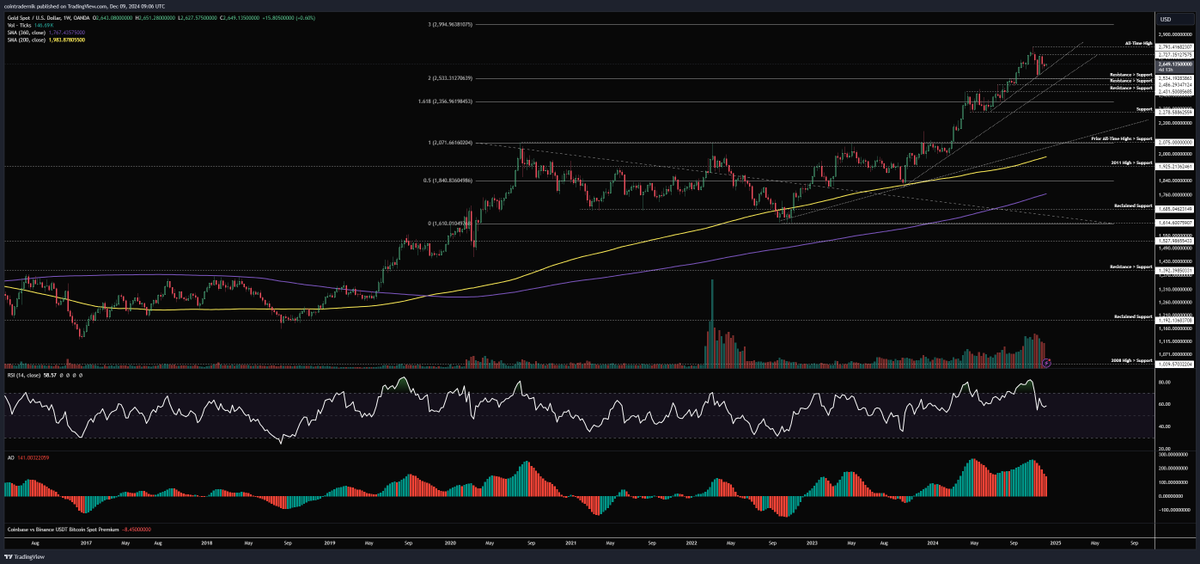
On the weekly chart, gold has been trading above a key trendline support, consolidating below $2,727 over recent weeks, and forming a higher low last week atop the trendline. The market is approaching a critical decision point. A weekly close below the trendline could trigger deeper corrections, with targets at $2,535 and $2,430. Conversely, a weekly close above $2,727 could mark the start of the next leg up, targeting $3,000. Markets are currently in wait-and-see mode, awaiting clearer directional confirmation. A weekly close below $2,535 would shift the structure to bearish and confirm a potential intermediate top.
Daily Analysis
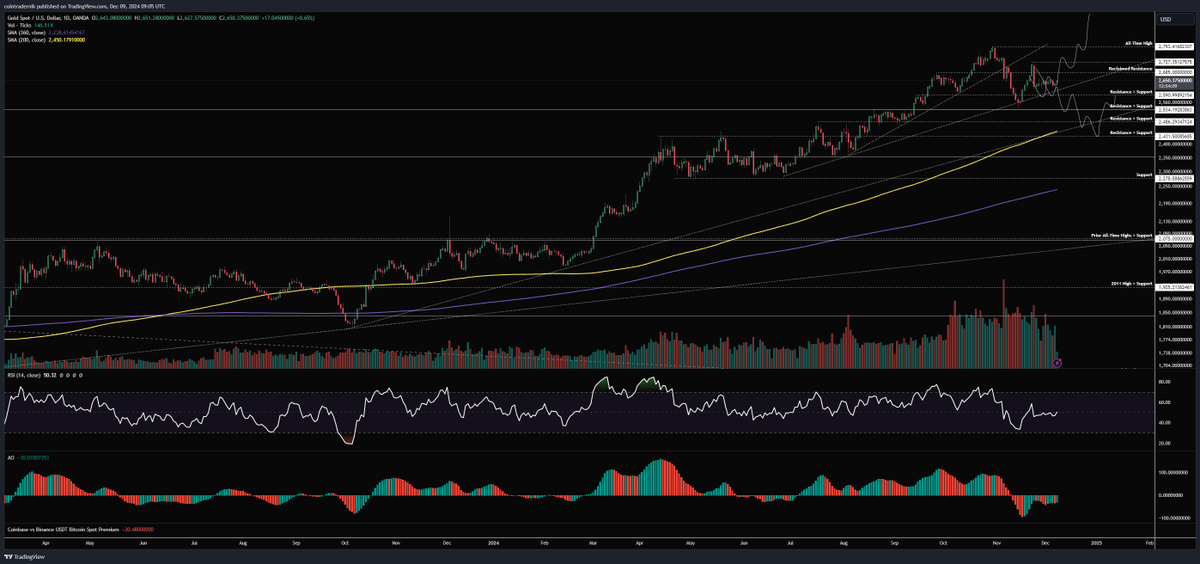
The daily chart shows gold progressing along the previously outlined bullish path. A breakout above $2,685 and reclaiming $2,727 as support would confirm the next phase of the uptrend, aiming to clear $2,800 and advance toward $3,000. However, if price forms a lower high below $2,685 this week and breaks the trendline support, falling below $2,590, it would confirm a bearish scenario, potentially leading to further downside, breaking November’s low, and testing the lower trendline and 200-day moving average near $2,450.
Copper
Current Price: $4.27
Weekly Analysis
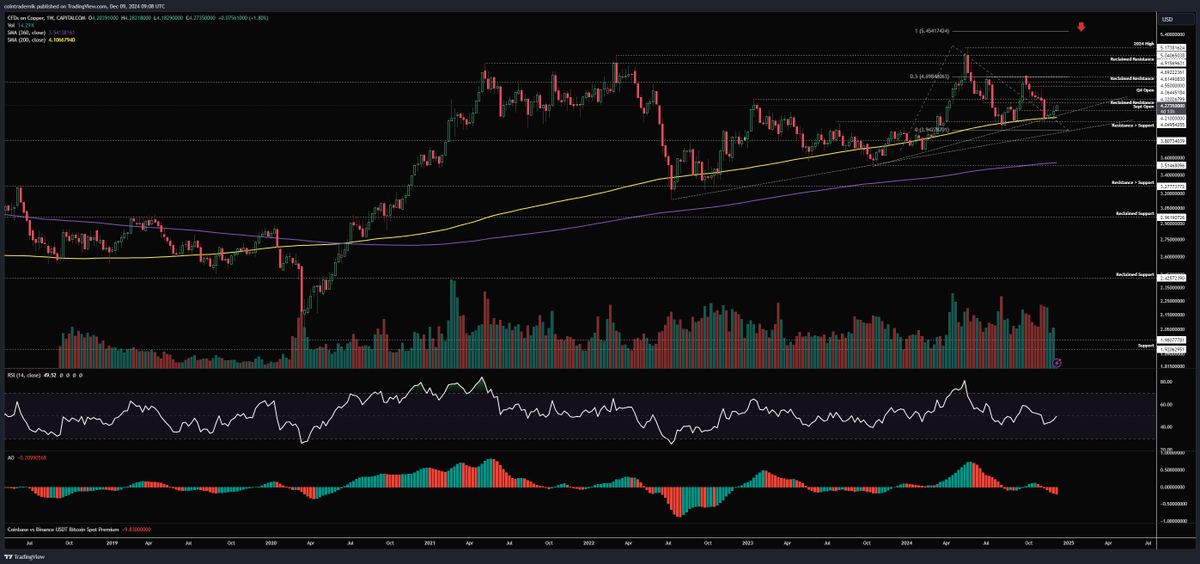
The weekly copper chart finally shows signs of a rebound from a major support zone, likely tied to recent Chinese policy signals favoring fiscal easing. Although specific measures have not been detailed, market pricing already reflects expectations of a policy pivot. A weekly close above $4.36 would confirm a medium-term bottom, potentially leading to a retest of the $4.70 high and further advances toward the multi-year range top near $5. As long as price holds above $4.00, the market structure remains bullish.
Daily Analysis
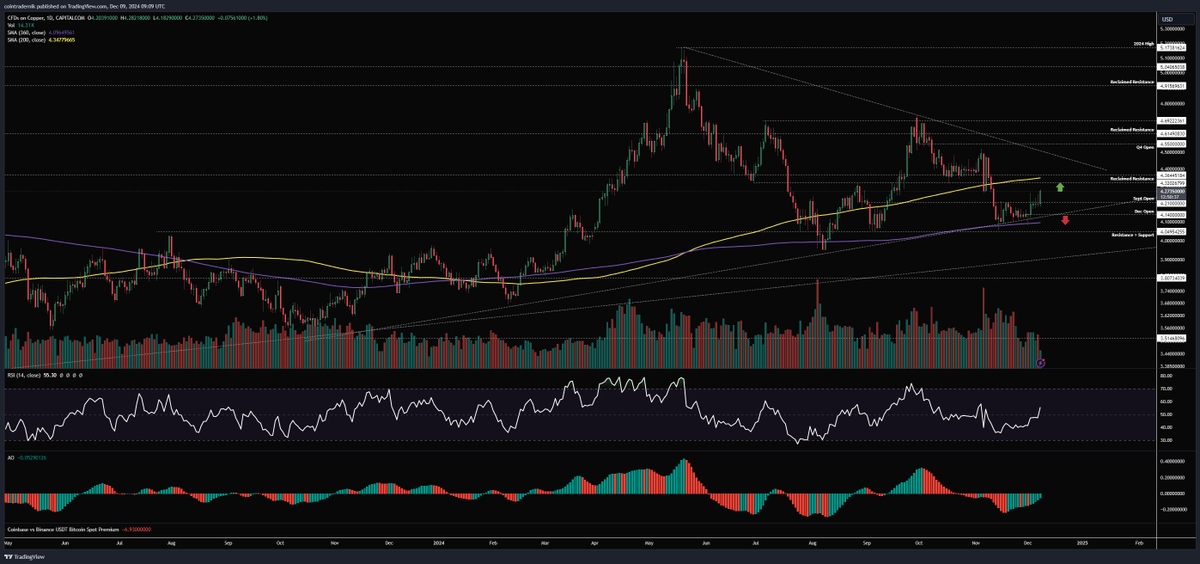
The daily chart shows copper finding support at the 360-day moving average, with momentum indicators turning upward. Price is currently trading between this support and resistance near the 200-day moving average, while the trendline resistance from the yearly high remains to be broken. If this formation holds as a bottom, the $4.20 zone is expected to serve as support, with a breakout above $4.36 likely in the coming weeks, attempting to clear the trendline resistance and retesting $4.70 early in 2025. A break below the 360-day moving average ($4.09) would invalidate the current bullish outlook.
Dollar Index
Current Price: 105.6
Weekly Analysis
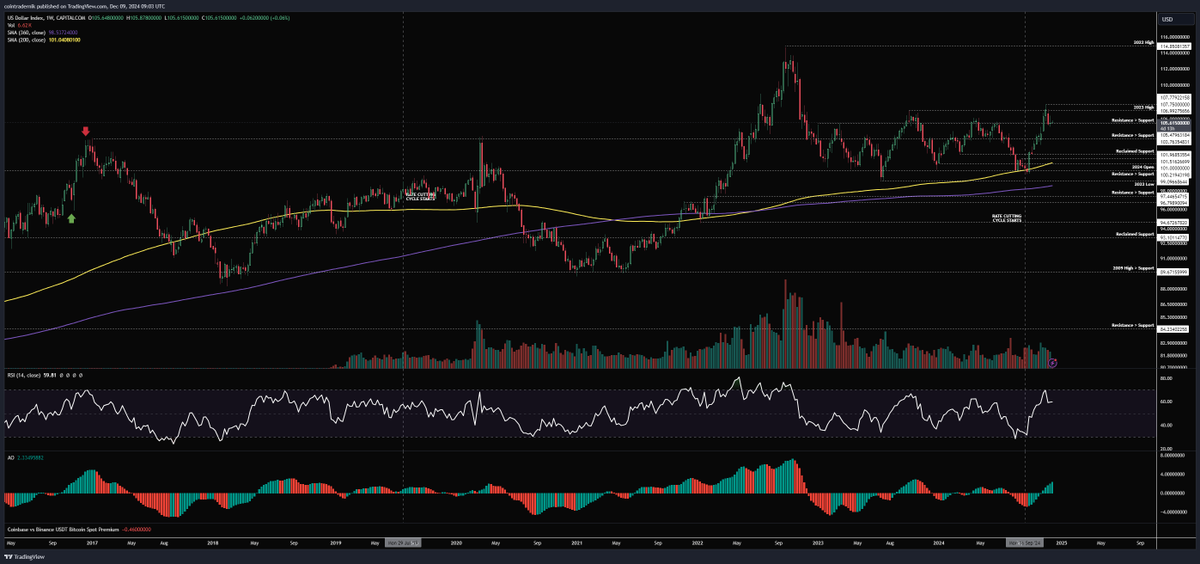
Last week, the Dollar Index once again failed to break above its 2023 high but closed slightly above 105.5, leaving uncertain whether the earlier move toward 107.8 was a “false breakout.” A weekly close below 105.5 this week could trigger further downside, targeting the 200-week moving average and the range bottom, potentially unfolding over the coming weeks or months. On the other hand, holding above 105.5 and bouncing from here could signal the start of a broader uptrend, turning the 2023 high at 107 into support and setting sights on 108 and beyond. The market is approaching a critical inflection point.
Daily Analysis
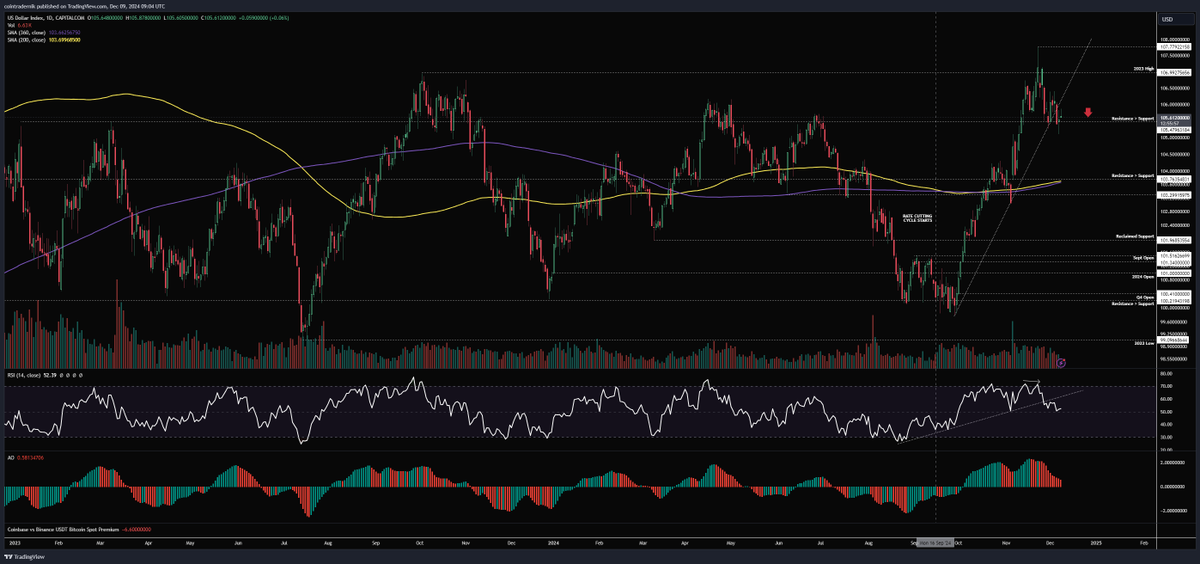
The daily chart shows that the anticipated weakening in momentum and RSI pullback has partially materialized, but further confirmation is needed. If price forms lower lows and lower highs below 105.5, it would confirm the prior move up as a false breakout, suggesting a decline toward the confluence of the 200-day and 360-day moving averages around 103.7—a former resistance-turned-support zone. Conversely, a breakout above the trendline and sustained move above the 2023 high at 107 would pave the way for further gains, targeting 108 and beyond.
Join TechFlow official community to stay tuned
Telegram:https://t.me/TechFlowDaily
X (Twitter):https://x.com/TechFlowPost
X (Twitter) EN:https://x.com/BlockFlow_News